

Key Insights
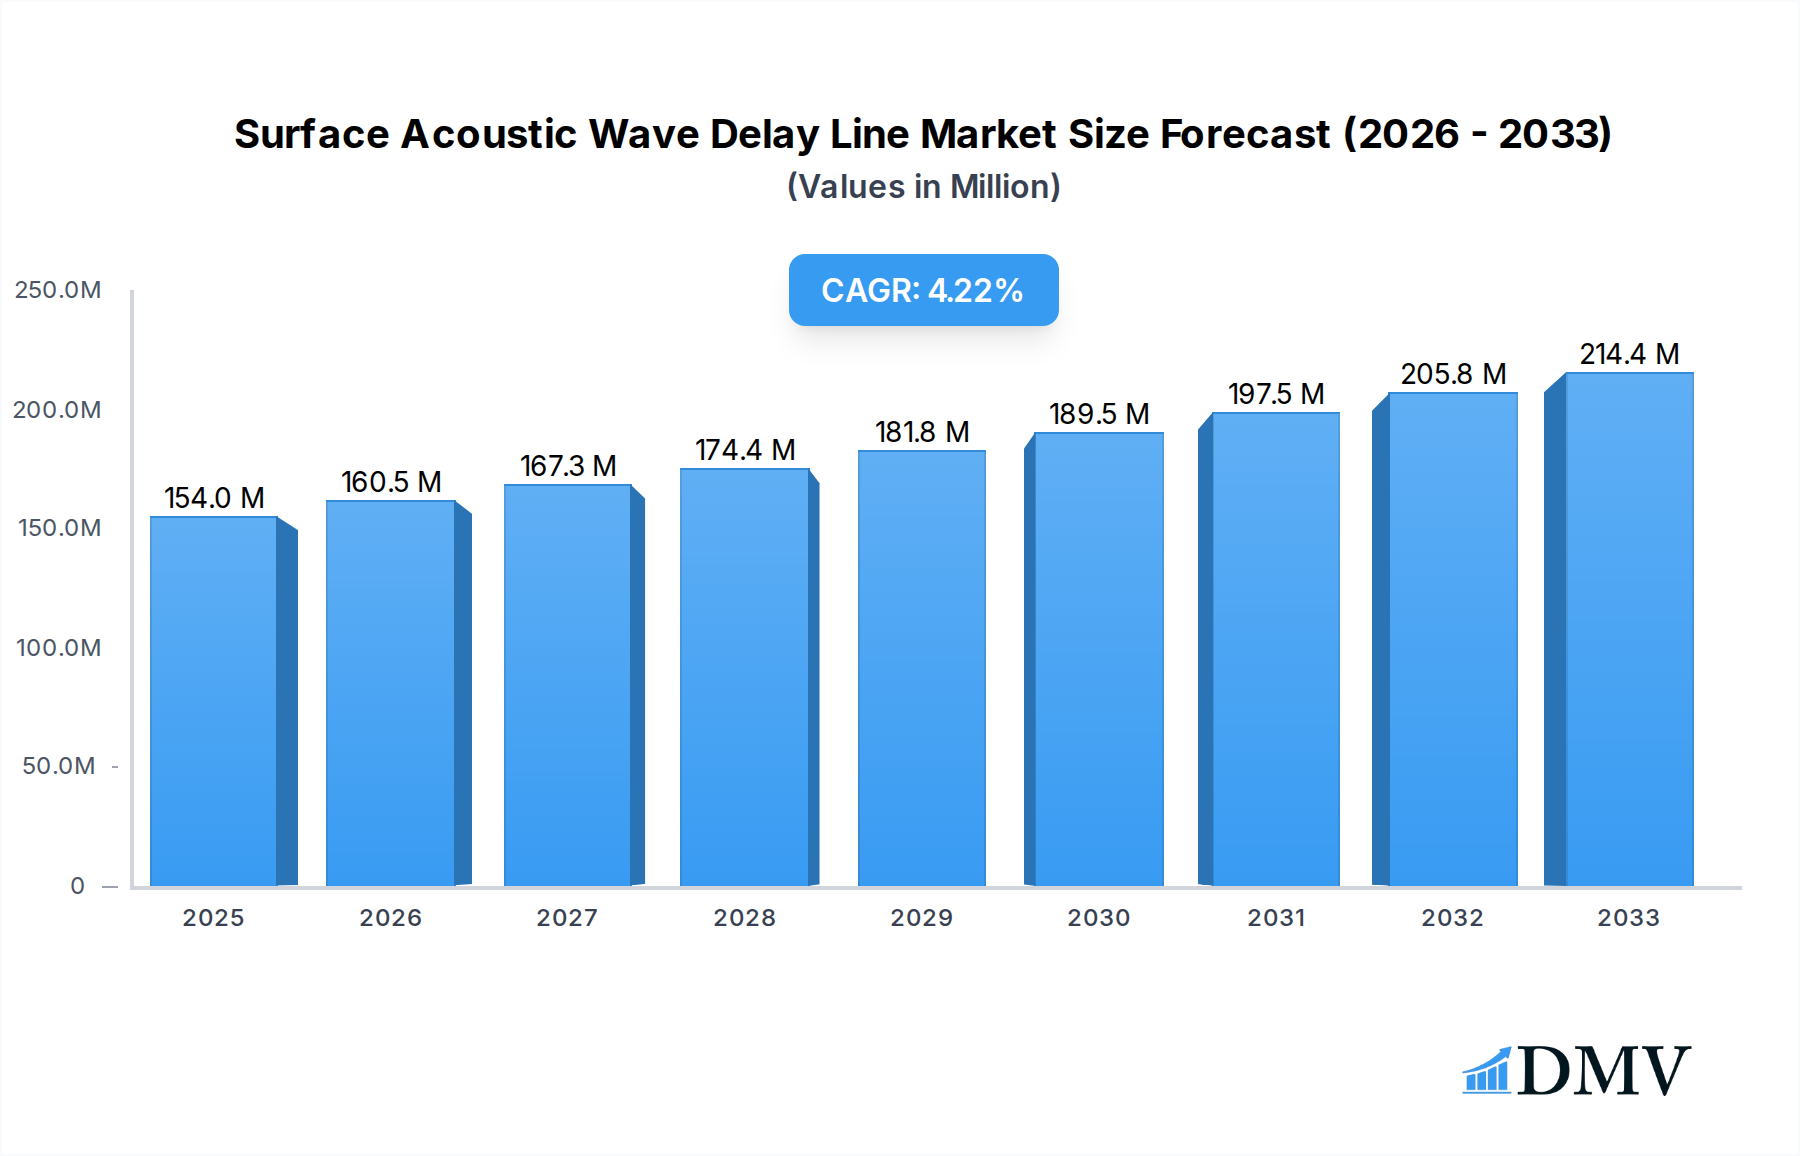
The Surface Acoustic Wave (SAW) Delay Line market is poised for significant expansion, with an estimated market size of $154 million in 2025. This growth is underpinned by a robust Compound Annual Growth Rate (CAGR) of 4.3%, projecting a dynamic trajectory through 2033. The primary impetus for this expansion stems from the increasing demand for high-performance sensing solutions across various critical sectors. The military segment, in particular, is a substantial driver, leveraging SAW delay lines for advanced radar systems, electronic warfare, and secure communication technologies that demand precise timing and signal processing. Similarly, the automotive industry's rapid adoption of sophisticated driver-assistance systems (ADAS) and autonomous driving features necessitates the accuracy and reliability offered by SAW-based sensors for applications like proximity detection and environmental monitoring.

Surface Acoustic Wave Delay Line Market Size (In Million)
Further fueling market growth are ongoing technological advancements and the inherent advantages of SAW delay lines, including their compact size, low power consumption, and excellent signal integrity. The industrial sector is increasingly integrating these devices into automation, robotics, and process control systems to enhance efficiency and safety. Key trends include the miniaturization of SAW devices, improved frequency stability, and the development of multi-functional sensors. While the market is generally robust, certain restraints, such as the emergence of competing technologies and the initial cost of integration in some niche applications, may pose challenges. However, the continuous innovation by leading companies like Vectron International, Qualtre, and Sensor Technology Ltd, coupled with expanding applications in temperature, pressure, and humidity sensing, are expected to overcome these hurdles, solidifying the market's upward trend.
Surface Acoustic Wave Delay Line Company Market Share
Unlock the future of advanced sensing with our comprehensive Surface Acoustic Wave (SAW) Delay Line Market Research Report. This in-depth analysis offers critical insights into the evolving landscape, market dynamics, and future projections for SAW delay line technology. Covering a study period from 2019 to 2033, with a base year of 2025, this report is your definitive guide to understanding market concentration, innovation, and growth opportunities. Dive deep into granular data, market segmentation, and strategic forecasts, all meticulously crafted to empower stakeholders and drive informed decision-making.
Surface Acoustic Wave Delay Line Market Composition & Trends
The Surface Acoustic Wave (SAW) Delay Line market is characterized by a moderate to high level of concentration, with a few key players holding substantial market share. Innovation catalysts driving this sector include the increasing demand for miniaturized, high-performance sensors, particularly in harsh environments where traditional sensing methods struggle. Regulatory landscapes are becoming increasingly supportive, especially in sectors like automotive and industrial automation, pushing for enhanced safety and efficiency. Substitute products exist, such as piezoelectric sensors and optical sensors, but SAW delay lines offer unique advantages in terms of sensitivity, cost-effectiveness, and robustness. End-user profiles range from military and defense organizations requiring reliable battlefield sensing to automotive manufacturers integrating advanced driver-assistance systems (ADAS), and industrial firms implementing sophisticated process control and monitoring. Merger and Acquisition (M&A) activities, while not overtly dominant, are present as larger entities seek to acquire specialized SAW expertise and intellectual property, contributing to market consolidation. M&A deal values are estimated to be in the range of tens to hundreds of millions for significant acquisitions.
- Market Share Distribution: Dominated by a few established manufacturers, with a significant portion attributed to companies specializing in RF components and sensors.
- Innovation Catalysts: Miniaturization, enhanced sensitivity, robust performance in extreme conditions, and integration with IoT platforms.
- Regulatory Landscapes: Growing emphasis on safety, environmental monitoring, and industrial efficiency standards driving SAW adoption.
- Substitute Products: Piezoelectric sensors, MEMS sensors, fiber optic sensors, offering varying degrees of performance and cost.
- End-User Profiles: Military (guidance systems, radar), Automotive (ADAS, engine monitoring), Industrial (process control, structural health monitoring), Aerospace, and Healthcare.
- M&A Activities: Strategic acquisitions to gain technological edge and expand product portfolios, with an estimated total M&A deal value of over 50 million during the historical period.
Surface Acoustic Wave Delay Line Industry Evolution
The Surface Acoustic Wave (SAW) delay line industry has witnessed a remarkable evolution, marked by consistent market growth trajectories fueled by relentless technological advancements and the shifting consumer demands for more sophisticated and reliable sensing solutions. From its inception, SAW technology has transitioned from niche applications to becoming an integral component in a wide array of high-value sectors. Initially recognized for its capabilities in radio frequency (RF) filtering and signal processing, the underlying principles of SAW wave propagation have been ingeniously adapted for precise sensing applications. The historical period (2019–2024) saw a steady upward trend in adoption, driven by the increasing complexity of electronic devices and the need for embedded sensing. Key market players have consistently invested in research and development, leading to the miniaturization of SAW delay line sensors, improved performance characteristics like linearity and hysteresis, and enhanced durability for operation in challenging environments.
The growth rate during this period averaged approximately 7.8% annually, with specific segments experiencing even higher expansion due to burgeoning applications. For instance, the automotive sector's push towards autonomous driving and advanced safety features significantly boosted the demand for SAW-based sensors for temperature, pressure, and even humidity monitoring within vehicle systems. Similarly, the industrial automation boom, emphasizing Industry 4.0 principles, has amplified the need for robust and accurate sensors for process control, predictive maintenance, and environmental monitoring, areas where SAW delay lines excel. The adoption metrics for SAW delay lines in new product designs are estimated to have increased by over 35% from 2019 to 2024, indicating a strong market penetration.
Looking ahead, the forecast period (2025–2033) is projected to maintain this robust growth, with an estimated compound annual growth rate (CAGR) of 8.5%. This sustained expansion will be propelled by ongoing innovation in materials science, enabling SAW devices with even greater sensitivity and resistance to extreme conditions. The integration of SAW delay lines with advanced data analytics and AI algorithms will unlock new predictive capabilities and real-time diagnostics, further solidifying their position. The development of novel packaging techniques and the exploration of new wave propagation modes will also contribute to their versatility. The estimated market size for SAW delay lines is projected to reach over 2,500 million by 2033, a substantial increase from the estimated 1,200 million in the base year of 2025. This evolution is a testament to the inherent adaptability and superior performance of SAW delay line technology in meeting the ever-increasing demands of the modern technological landscape.
Leading Regions, Countries, or Segments in Surface Acoustic Wave Delay Line
The Surface Acoustic Wave (SAW) Delay Line market demonstrates clear regional and segmental leadership driven by specific technological demands and supportive ecosystems. Among the Applications, the Industrial segment emerges as a dominant force, showcasing exceptional growth and market penetration. This dominance is underpinned by the massive global push towards Industry 4.0, smart manufacturing, and the Internet of Things (IoT), all of which necessitate highly reliable, precise, and robust sensing solutions for process control, automation, and predictive maintenance.
- Dominant Segment: Industrial Application, primarily driven by the adoption of smart factory technologies and automation initiatives.
- Key Drivers in Industrial Segment:
- High Demand for Process Optimization: SAW sensors enable precise monitoring of temperature, pressure, and flow rates for enhanced efficiency and yield.
- Predictive Maintenance Needs: Early detection of anomalies through accurate parameter sensing reduces downtime and maintenance costs, with an estimated cost saving of up to 15% for adopters.
- Harsh Environment Suitability: SAW delay lines' inherent robustness makes them ideal for demanding industrial settings with extreme temperatures, vibrations, and corrosive elements.
- Growing Automation Landscape: The increasing deployment of robotics and automated systems in manufacturing relies heavily on accurate sensor feedback.
- Regulatory Compliance: Stringent industrial safety and environmental regulations necessitate continuous and reliable monitoring, driving SAW adoption.
In terms of Type, Temperature Sensing Parameter stands out as a significant growth area within the SAW delay line market. Accurate temperature monitoring is critical across numerous industrial processes, automotive systems, and even in emerging medical applications. The ability of SAW delay lines to provide non-contact or direct-contact temperature measurements with high precision and rapid response times makes them indispensable. The projected market for temperature sensing SAW delay lines is estimated to reach over 800 million by 2033.
- Prominent Type: Temperature Sensing Parameter, crucial for diverse applications requiring precise thermal management.
- Dominant Region: North America and Europe currently lead in the adoption of advanced SAW delay line technologies, largely due to their mature industrial bases and significant investments in R&D and smart manufacturing initiatives. Asia-Pacific is rapidly emerging as a key growth region due to its expanding manufacturing capabilities and increasing adoption of industrial automation.
Surface Acoustic Wave Delay Line Product Innovations
Recent product innovations in the Surface Acoustic Wave (SAW) Delay Line market are focused on enhancing performance, miniaturization, and expanding application versatility. Manufacturers are developing SAW delay lines with improved temperature stability, offering accuracy of ±0.1°C or better, crucial for critical applications in automotive and industrial sectors. Furthermore, innovations in materials and fabrication techniques are yielding devices with significantly extended operational temperature ranges, from -55°C to +175°C, enabling deployment in more extreme environments. The integration of SAW delay lines into smaller, more compact modules is also a key trend, facilitating their seamless incorporation into space-constrained devices. These advancements are driving new applications in areas such as high-frequency pressure sensing for advanced automotive braking systems and non-invasive fluid level monitoring in industrial tanks, demonstrating unique selling propositions like unparalleled accuracy and long-term reliability.
Propelling Factors for Surface Acoustic Wave Delay Line Growth
The Surface Acoustic Wave (SAW) Delay Line market is propelled by a confluence of potent factors. Technological advancements in materials science and microfabrication are enabling SAW devices with enhanced sensitivity, stability, and a broader operational temperature range, from -40°C to +150°C. This directly feeds into the increasing demand for high-performance sensors in critical applications across automotive (ADAS, engine management), industrial automation (Industry 4.0, process control), and military sectors, where reliability is paramount. Economic drivers include the growing investments in smart infrastructure and IoT deployment, which necessitates ubiquitous and accurate sensing capabilities. Furthermore, supportive regulatory frameworks in various regions, pushing for improved safety standards and environmental monitoring, indirectly boost the adoption of SAW delay lines due to their inherent accuracy and robustness. The projected growth in these areas alone is expected to contribute over 1,000 million in new market value.
Obstacles in the Surface Acoustic Wave Delay Line Market
Despite robust growth, the Surface Acoustic Wave (SAW) Delay Line market faces several obstacles. Intense competitive pressure from alternative sensing technologies like MEMS and fiber optics can limit market share, particularly in cost-sensitive applications, with some MEMS solutions offering up to 10% lower unit costs. Supply chain disruptions, particularly for specialized raw materials and manufacturing components, can lead to production delays and increased costs, impacting overall market availability. High initial R&D and manufacturing setup costs can also pose a barrier to entry for new players. Furthermore, while regulations are often supportive, complex certification processes for highly specialized applications, particularly in the military and aerospace sectors, can slow down market penetration, sometimes adding 6-12 months to product commercialization timelines.
Future Opportunities in Surface Acoustic Wave Delay Line
Emerging opportunities for Surface Acoustic Wave (SAW) Delay Lines lie in several key areas. The burgeoning field of wearable technology and personalized healthcare presents a significant avenue, with SAW sensors offering a biocompatible and highly sensitive platform for non-invasive health monitoring. The expanding 5G infrastructure deployment requires advanced RF components, where SAW filters and delay lines are crucial, offering performance beyond 10 GHz. Furthermore, the increasing adoption of autonomous systems in logistics and warehousing will drive demand for robust and precise navigation and environmental sensors. The development of multi-functional SAW devices capable of sensing multiple parameters simultaneously, potentially reducing overall system complexity and cost by up to 20%, represents a significant technological advancement with immense market potential.
Major Players in the Surface Acoustic Wave Delay Line Ecosystem
- Vectron International
- Qualtre
- Sensor Technology Ltd
- NanoTemper Technologies GmbH
- Althen GmbH Mess- und Sensortechnik
- Transense Technologies
- H. Heinz MeBwiderstande GmbH
- Hawk Measurement Systems
Key Developments in Surface Acoustic Wave Delay Line Industry
- 2023 Q4: Launch of advanced SAW temperature sensors with enhanced accuracy of ±0.05°C for automotive applications by a leading manufacturer.
- 2024 Q1: Acquisition of a niche SAW sensor startup by a major sensor conglomerate to bolster its portfolio in industrial IoT. Estimated deal value: 45 million.
- 2024 Q2: Introduction of new SAW pressure sensors capable of operating at pressures exceeding 100 MPa, targeting high-pressure industrial systems.
- 2024 Q3: Significant R&D investment announcement by a key player in exploring novel piezoelectric materials for next-generation SAW delay lines, aiming for a 30% performance uplift.
- 2024 Q4: Release of a miniaturized SAW humidity sensor with a response time of under 5 seconds, enabling real-time environmental monitoring in compact devices.
Strategic Surface Acoustic Wave Delay Line Market Forecast
The strategic outlook for the Surface Acoustic Wave (SAW) Delay Line market is exceptionally positive, driven by the relentless pursuit of miniaturization, enhanced performance, and robust sensing capabilities across critical sectors. Future opportunities in emerging markets and the continuous evolution of technology, particularly in areas like IoT and autonomous systems, are expected to fuel sustained growth. The estimated market size is projected to expand significantly, with a robust CAGR, reaching over 2,500 million by the end of the forecast period. This growth trajectory is underpinned by ongoing innovation and the indispensable role SAW delay lines play in delivering accurate and reliable data in increasingly complex technological landscapes.
Surface Acoustic Wave Delay Line Segmentation
-
1. Application
- 1.1. Military
- 1.2. Automotive
- 1.3. Industrial
-
2. Type
- 2.1. Temperature Sensing Parameter
- 2.2. Pressure Sensing Parameter
- 2.3. Humidity Sensing Parameter
Surface Acoustic Wave Delay Line Segmentation By Geography
-
1. North America
- 1.1. United States
- 1.2. Canada
- 1.3. Mexico
-
2. South America
- 2.1. Brazil
- 2.2. Argentina
- 2.3. Rest of South America
-
3. Europe
- 3.1. United Kingdom
- 3.2. Germany
- 3.3. France
- 3.4. Italy
- 3.5. Spain
- 3.6. Russia
- 3.7. Benelux
- 3.8. Nordics
- 3.9. Rest of Europe
-
4. Middle East & Africa
- 4.1. Turkey
- 4.2. Israel
- 4.3. GCC
- 4.4. North Africa
- 4.5. South Africa
- 4.6. Rest of Middle East & Africa
-
5. Asia Pacific
- 5.1. China
- 5.2. India
- 5.3. Japan
- 5.4. South Korea
- 5.5. ASEAN
- 5.6. Oceania
- 5.7. Rest of Asia Pacific
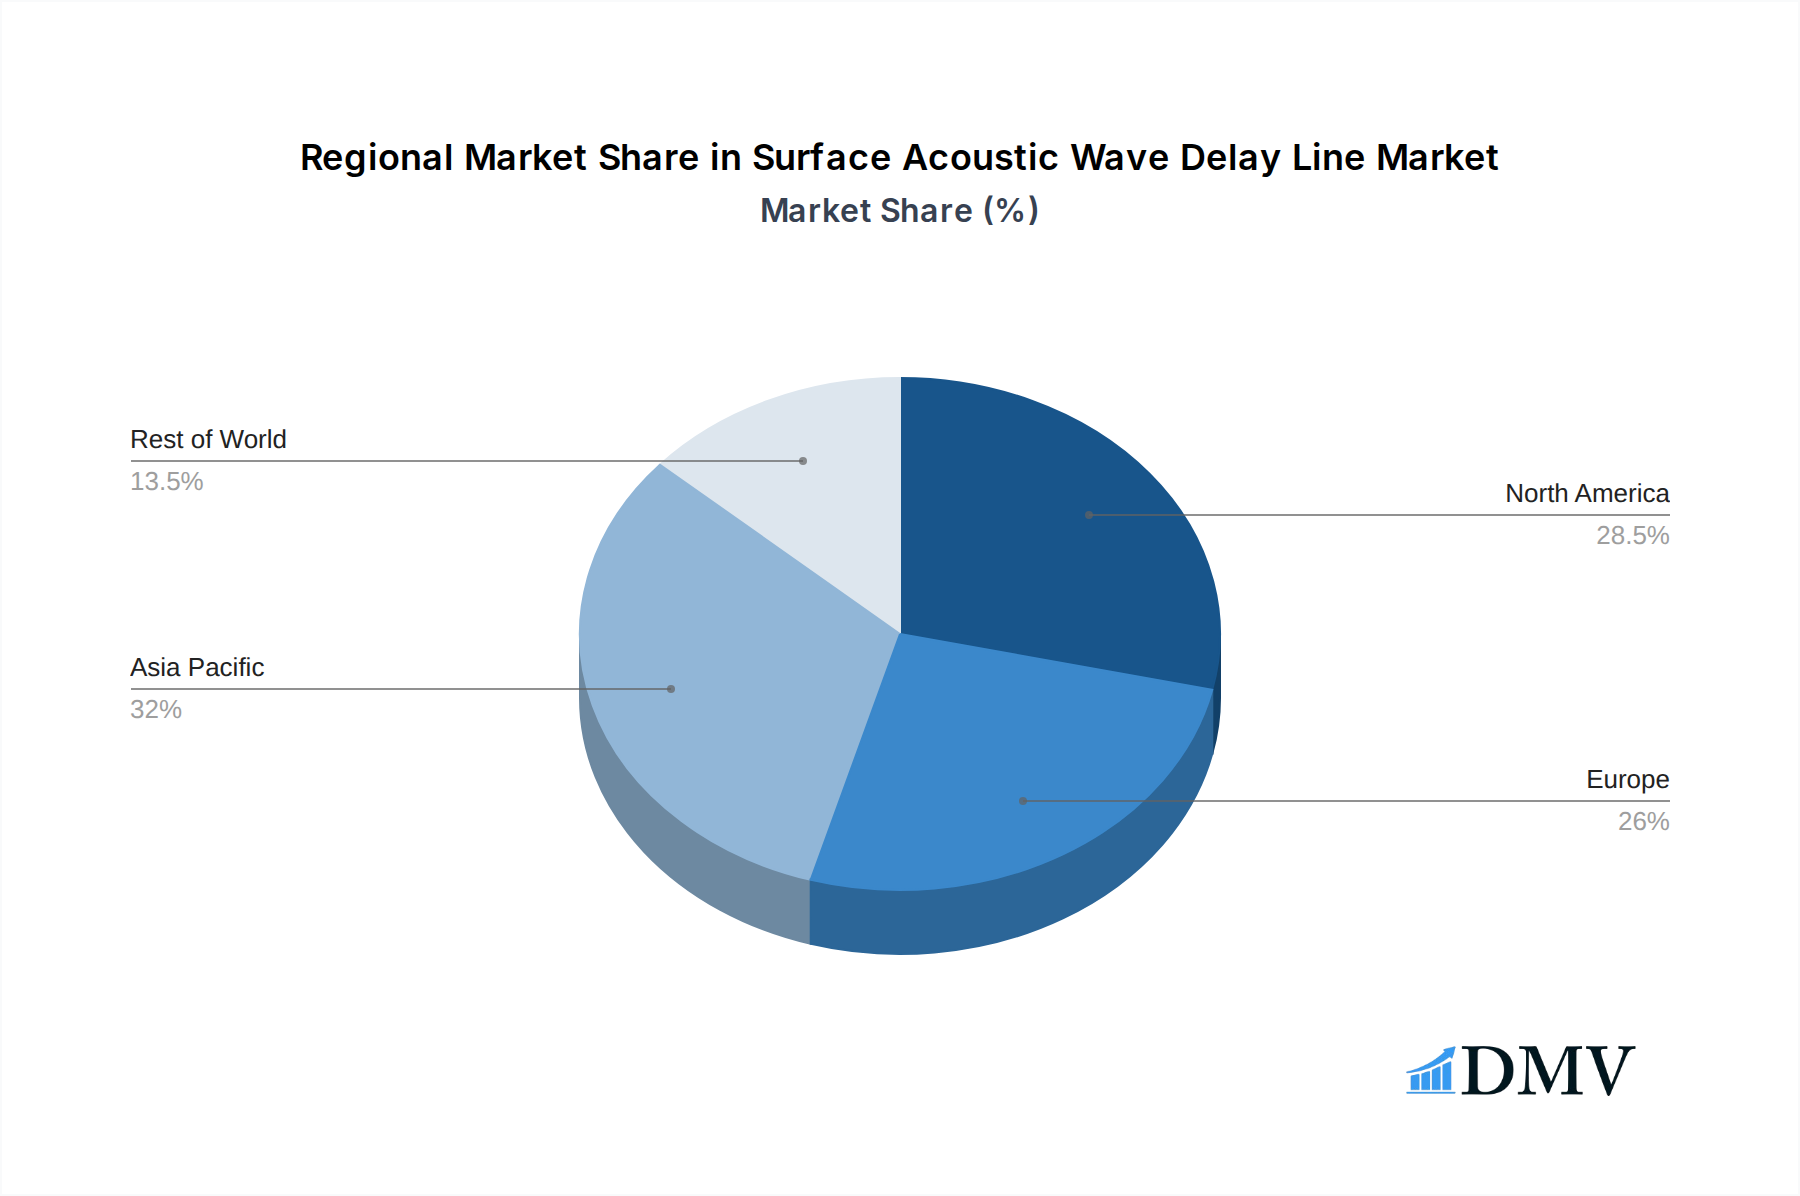
Surface Acoustic Wave Delay Line Regional Market Share
Geographic Coverage of Surface Acoustic Wave Delay Line
Surface Acoustic Wave Delay Line REPORT HIGHLIGHTS
| Aspects | Details |
|---|---|
| Study Period | 2020-2034 |
| Base Year | 2025 |
| Estimated Year | 2026 |
| Forecast Period | 2026-2034 |
| Historical Period | 2020-2025 |
| Growth Rate | CAGR of 4.3% from 2020-2034 |
| Segmentation |
|
Table of Contents
- 1. Introduction
- 1.1. Research Scope
- 1.2. Market Segmentation
- 1.3. Research Methodology
- 1.4. Definitions and Assumptions
- 2. Executive Summary
- 2.1. Introduction
- 3. Market Dynamics
- 3.1. Introduction
- 3.2. Market Drivers
- 3.3. Market Restrains
- 3.4. Market Trends
- 4. Market Factor Analysis
- 4.1. Porters Five Forces
- 4.2. Supply/Value Chain
- 4.3. PESTEL analysis
- 4.4. Market Entropy
- 4.5. Patent/Trademark Analysis
- 5. Global Surface Acoustic Wave Delay Line Analysis, Insights and Forecast, 2020-2032
- 5.1. Market Analysis, Insights and Forecast - by Application
- 5.1.1. Military
- 5.1.2. Automotive
- 5.1.3. Industrial
- 5.2. Market Analysis, Insights and Forecast - by Type
- 5.2.1. Temperature Sensing Parameter
- 5.2.2. Pressure Sensing Parameter
- 5.2.3. Humidity Sensing Parameter
- 5.3. Market Analysis, Insights and Forecast - by Region
- 5.3.1. North America
- 5.3.2. South America
- 5.3.3. Europe
- 5.3.4. Middle East & Africa
- 5.3.5. Asia Pacific
- 5.1. Market Analysis, Insights and Forecast - by Application
- 6. North America Surface Acoustic Wave Delay Line Analysis, Insights and Forecast, 2020-2032
- 6.1. Market Analysis, Insights and Forecast - by Application
- 6.1.1. Military
- 6.1.2. Automotive
- 6.1.3. Industrial
- 6.2. Market Analysis, Insights and Forecast - by Type
- 6.2.1. Temperature Sensing Parameter
- 6.2.2. Pressure Sensing Parameter
- 6.2.3. Humidity Sensing Parameter
- 6.1. Market Analysis, Insights and Forecast - by Application
- 7. South America Surface Acoustic Wave Delay Line Analysis, Insights and Forecast, 2020-2032
- 7.1. Market Analysis, Insights and Forecast - by Application
- 7.1.1. Military
- 7.1.2. Automotive
- 7.1.3. Industrial
- 7.2. Market Analysis, Insights and Forecast - by Type
- 7.2.1. Temperature Sensing Parameter
- 7.2.2. Pressure Sensing Parameter
- 7.2.3. Humidity Sensing Parameter
- 7.1. Market Analysis, Insights and Forecast - by Application
- 8. Europe Surface Acoustic Wave Delay Line Analysis, Insights and Forecast, 2020-2032
- 8.1. Market Analysis, Insights and Forecast - by Application
- 8.1.1. Military
- 8.1.2. Automotive
- 8.1.3. Industrial
- 8.2. Market Analysis, Insights and Forecast - by Type
- 8.2.1. Temperature Sensing Parameter
- 8.2.2. Pressure Sensing Parameter
- 8.2.3. Humidity Sensing Parameter
- 8.1. Market Analysis, Insights and Forecast - by Application
- 9. Middle East & Africa Surface Acoustic Wave Delay Line Analysis, Insights and Forecast, 2020-2032
- 9.1. Market Analysis, Insights and Forecast - by Application
- 9.1.1. Military
- 9.1.2. Automotive
- 9.1.3. Industrial
- 9.2. Market Analysis, Insights and Forecast - by Type
- 9.2.1. Temperature Sensing Parameter
- 9.2.2. Pressure Sensing Parameter
- 9.2.3. Humidity Sensing Parameter
- 9.1. Market Analysis, Insights and Forecast - by Application
- 10. Asia Pacific Surface Acoustic Wave Delay Line Analysis, Insights and Forecast, 2020-2032
- 10.1. Market Analysis, Insights and Forecast - by Application
- 10.1.1. Military
- 10.1.2. Automotive
- 10.1.3. Industrial
- 10.2. Market Analysis, Insights and Forecast - by Type
- 10.2.1. Temperature Sensing Parameter
- 10.2.2. Pressure Sensing Parameter
- 10.2.3. Humidity Sensing Parameter
- 10.1. Market Analysis, Insights and Forecast - by Application
- 11. Competitive Analysis
- 11.1. Global Market Share Analysis 2025
- 11.2. Company Profiles
- 11.2.1 Vectron International
- 11.2.1.1. Overview
- 11.2.1.2. Products
- 11.2.1.3. SWOT Analysis
- 11.2.1.4. Recent Developments
- 11.2.1.5. Financials (Based on Availability)
- 11.2.2 Qualtre
- 11.2.2.1. Overview
- 11.2.2.2. Products
- 11.2.2.3. SWOT Analysis
- 11.2.2.4. Recent Developments
- 11.2.2.5. Financials (Based on Availability)
- 11.2.3 Sensor Technology Ltd
- 11.2.3.1. Overview
- 11.2.3.2. Products
- 11.2.3.3. SWOT Analysis
- 11.2.3.4. Recent Developments
- 11.2.3.5. Financials (Based on Availability)
- 11.2.4 NanoTemper Technologies GmbH
- 11.2.4.1. Overview
- 11.2.4.2. Products
- 11.2.4.3. SWOT Analysis
- 11.2.4.4. Recent Developments
- 11.2.4.5. Financials (Based on Availability)
- 11.2.5 Althen GmbH Mess- und Sensortechnik
- 11.2.5.1. Overview
- 11.2.5.2. Products
- 11.2.5.3. SWOT Analysis
- 11.2.5.4. Recent Developments
- 11.2.5.5. Financials (Based on Availability)
- 11.2.6 Transense Technologies
- 11.2.6.1. Overview
- 11.2.6.2. Products
- 11.2.6.3. SWOT Analysis
- 11.2.6.4. Recent Developments
- 11.2.6.5. Financials (Based on Availability)
- 11.2.7 H.Heinz MeBwiderstande GmbH
- 11.2.7.1. Overview
- 11.2.7.2. Products
- 11.2.7.3. SWOT Analysis
- 11.2.7.4. Recent Developments
- 11.2.7.5. Financials (Based on Availability)
- 11.2.8 Hawk Measurement Systems
- 11.2.8.1. Overview
- 11.2.8.2. Products
- 11.2.8.3. SWOT Analysis
- 11.2.8.4. Recent Developments
- 11.2.8.5. Financials (Based on Availability)
- 11.2.1 Vectron International
List of Figures
- Figure 1: Global Surface Acoustic Wave Delay Line Revenue Breakdown (million, %) by Region 2025 & 2033
- Figure 2: North America Surface Acoustic Wave Delay Line Revenue (million), by Application 2025 & 2033
- Figure 3: North America Surface Acoustic Wave Delay Line Revenue Share (%), by Application 2025 & 2033
- Figure 4: North America Surface Acoustic Wave Delay Line Revenue (million), by Type 2025 & 2033
- Figure 5: North America Surface Acoustic Wave Delay Line Revenue Share (%), by Type 2025 & 2033
- Figure 6: North America Surface Acoustic Wave Delay Line Revenue (million), by Country 2025 & 2033
- Figure 7: North America Surface Acoustic Wave Delay Line Revenue Share (%), by Country 2025 & 2033
- Figure 8: South America Surface Acoustic Wave Delay Line Revenue (million), by Application 2025 & 2033
- Figure 9: South America Surface Acoustic Wave Delay Line Revenue Share (%), by Application 2025 & 2033
- Figure 10: South America Surface Acoustic Wave Delay Line Revenue (million), by Type 2025 & 2033
- Figure 11: South America Surface Acoustic Wave Delay Line Revenue Share (%), by Type 2025 & 2033
- Figure 12: South America Surface Acoustic Wave Delay Line Revenue (million), by Country 2025 & 2033
- Figure 13: South America Surface Acoustic Wave Delay Line Revenue Share (%), by Country 2025 & 2033
- Figure 14: Europe Surface Acoustic Wave Delay Line Revenue (million), by Application 2025 & 2033
- Figure 15: Europe Surface Acoustic Wave Delay Line Revenue Share (%), by Application 2025 & 2033
- Figure 16: Europe Surface Acoustic Wave Delay Line Revenue (million), by Type 2025 & 2033
- Figure 17: Europe Surface Acoustic Wave Delay Line Revenue Share (%), by Type 2025 & 2033
- Figure 18: Europe Surface Acoustic Wave Delay Line Revenue (million), by Country 2025 & 2033
- Figure 19: Europe Surface Acoustic Wave Delay Line Revenue Share (%), by Country 2025 & 2033
- Figure 20: Middle East & Africa Surface Acoustic Wave Delay Line Revenue (million), by Application 2025 & 2033
- Figure 21: Middle East & Africa Surface Acoustic Wave Delay Line Revenue Share (%), by Application 2025 & 2033
- Figure 22: Middle East & Africa Surface Acoustic Wave Delay Line Revenue (million), by Type 2025 & 2033
- Figure 23: Middle East & Africa Surface Acoustic Wave Delay Line Revenue Share (%), by Type 2025 & 2033
- Figure 24: Middle East & Africa Surface Acoustic Wave Delay Line Revenue (million), by Country 2025 & 2033
- Figure 25: Middle East & Africa Surface Acoustic Wave Delay Line Revenue Share (%), by Country 2025 & 2033
- Figure 26: Asia Pacific Surface Acoustic Wave Delay Line Revenue (million), by Application 2025 & 2033
- Figure 27: Asia Pacific Surface Acoustic Wave Delay Line Revenue Share (%), by Application 2025 & 2033
- Figure 28: Asia Pacific Surface Acoustic Wave Delay Line Revenue (million), by Type 2025 & 2033
- Figure 29: Asia Pacific Surface Acoustic Wave Delay Line Revenue Share (%), by Type 2025 & 2033
- Figure 30: Asia Pacific Surface Acoustic Wave Delay Line Revenue (million), by Country 2025 & 2033
- Figure 31: Asia Pacific Surface Acoustic Wave Delay Line Revenue Share (%), by Country 2025 & 2033
List of Tables
- Table 1: Global Surface Acoustic Wave Delay Line Revenue million Forecast, by Application 2020 & 2033
- Table 2: Global Surface Acoustic Wave Delay Line Revenue million Forecast, by Type 2020 & 2033
- Table 3: Global Surface Acoustic Wave Delay Line Revenue million Forecast, by Region 2020 & 2033
- Table 4: Global Surface Acoustic Wave Delay Line Revenue million Forecast, by Application 2020 & 2033
- Table 5: Global Surface Acoustic Wave Delay Line Revenue million Forecast, by Type 2020 & 2033
- Table 6: Global Surface Acoustic Wave Delay Line Revenue million Forecast, by Country 2020 & 2033
- Table 7: United States Surface Acoustic Wave Delay Line Revenue (million) Forecast, by Application 2020 & 2033
- Table 8: Canada Surface Acoustic Wave Delay Line Revenue (million) Forecast, by Application 2020 & 2033
- Table 9: Mexico Surface Acoustic Wave Delay Line Revenue (million) Forecast, by Application 2020 & 2033
- Table 10: Global Surface Acoustic Wave Delay Line Revenue million Forecast, by Application 2020 & 2033
- Table 11: Global Surface Acoustic Wave Delay Line Revenue million Forecast, by Type 2020 & 2033
- Table 12: Global Surface Acoustic Wave Delay Line Revenue million Forecast, by Country 2020 & 2033
- Table 13: Brazil Surface Acoustic Wave Delay Line Revenue (million) Forecast, by Application 2020 & 2033
- Table 14: Argentina Surface Acoustic Wave Delay Line Revenue (million) Forecast, by Application 2020 & 2033
- Table 15: Rest of South America Surface Acoustic Wave Delay Line Revenue (million) Forecast, by Application 2020 & 2033
- Table 16: Global Surface Acoustic Wave Delay Line Revenue million Forecast, by Application 2020 & 2033
- Table 17: Global Surface Acoustic Wave Delay Line Revenue million Forecast, by Type 2020 & 2033
- Table 18: Global Surface Acoustic Wave Delay Line Revenue million Forecast, by Country 2020 & 2033
- Table 19: United Kingdom Surface Acoustic Wave Delay Line Revenue (million) Forecast, by Application 2020 & 2033
- Table 20: Germany Surface Acoustic Wave Delay Line Revenue (million) Forecast, by Application 2020 & 2033
- Table 21: France Surface Acoustic Wave Delay Line Revenue (million) Forecast, by Application 2020 & 2033
- Table 22: Italy Surface Acoustic Wave Delay Line Revenue (million) Forecast, by Application 2020 & 2033
- Table 23: Spain Surface Acoustic Wave Delay Line Revenue (million) Forecast, by Application 2020 & 2033
- Table 24: Russia Surface Acoustic Wave Delay Line Revenue (million) Forecast, by Application 2020 & 2033
- Table 25: Benelux Surface Acoustic Wave Delay Line Revenue (million) Forecast, by Application 2020 & 2033
- Table 26: Nordics Surface Acoustic Wave Delay Line Revenue (million) Forecast, by Application 2020 & 2033
- Table 27: Rest of Europe Surface Acoustic Wave Delay Line Revenue (million) Forecast, by Application 2020 & 2033
- Table 28: Global Surface Acoustic Wave Delay Line Revenue million Forecast, by Application 2020 & 2033
- Table 29: Global Surface Acoustic Wave Delay Line Revenue million Forecast, by Type 2020 & 2033
- Table 30: Global Surface Acoustic Wave Delay Line Revenue million Forecast, by Country 2020 & 2033
- Table 31: Turkey Surface Acoustic Wave Delay Line Revenue (million) Forecast, by Application 2020 & 2033
- Table 32: Israel Surface Acoustic Wave Delay Line Revenue (million) Forecast, by Application 2020 & 2033
- Table 33: GCC Surface Acoustic Wave Delay Line Revenue (million) Forecast, by Application 2020 & 2033
- Table 34: North Africa Surface Acoustic Wave Delay Line Revenue (million) Forecast, by Application 2020 & 2033
- Table 35: South Africa Surface Acoustic Wave Delay Line Revenue (million) Forecast, by Application 2020 & 2033
- Table 36: Rest of Middle East & Africa Surface Acoustic Wave Delay Line Revenue (million) Forecast, by Application 2020 & 2033
- Table 37: Global Surface Acoustic Wave Delay Line Revenue million Forecast, by Application 2020 & 2033
- Table 38: Global Surface Acoustic Wave Delay Line Revenue million Forecast, by Type 2020 & 2033
- Table 39: Global Surface Acoustic Wave Delay Line Revenue million Forecast, by Country 2020 & 2033
- Table 40: China Surface Acoustic Wave Delay Line Revenue (million) Forecast, by Application 2020 & 2033
- Table 41: India Surface Acoustic Wave Delay Line Revenue (million) Forecast, by Application 2020 & 2033
- Table 42: Japan Surface Acoustic Wave Delay Line Revenue (million) Forecast, by Application 2020 & 2033
- Table 43: South Korea Surface Acoustic Wave Delay Line Revenue (million) Forecast, by Application 2020 & 2033
- Table 44: ASEAN Surface Acoustic Wave Delay Line Revenue (million) Forecast, by Application 2020 & 2033
- Table 45: Oceania Surface Acoustic Wave Delay Line Revenue (million) Forecast, by Application 2020 & 2033
- Table 46: Rest of Asia Pacific Surface Acoustic Wave Delay Line Revenue (million) Forecast, by Application 2020 & 2033
Frequently Asked Questions
1. What is the projected Compound Annual Growth Rate (CAGR) of the Surface Acoustic Wave Delay Line?
The projected CAGR is approximately 4.3%.
2. Which companies are prominent players in the Surface Acoustic Wave Delay Line?
Key companies in the market include Vectron International, Qualtre, Sensor Technology Ltd, NanoTemper Technologies GmbH, Althen GmbH Mess- und Sensortechnik, Transense Technologies, H.Heinz MeBwiderstande GmbH, Hawk Measurement Systems.
3. What are the main segments of the Surface Acoustic Wave Delay Line?
The market segments include Application, Type.
4. Can you provide details about the market size?
The market size is estimated to be USD 154 million as of 2022.
5. What are some drivers contributing to market growth?
N/A
6. What are the notable trends driving market growth?
N/A
7. Are there any restraints impacting market growth?
N/A
8. Can you provide examples of recent developments in the market?
N/A
9. What pricing options are available for accessing the report?
Pricing options include single-user, multi-user, and enterprise licenses priced at USD 4250.00, USD 6375.00, and USD 8500.00 respectively.
10. Is the market size provided in terms of value or volume?
The market size is provided in terms of value, measured in million.
11. Are there any specific market keywords associated with the report?
Yes, the market keyword associated with the report is "Surface Acoustic Wave Delay Line," which aids in identifying and referencing the specific market segment covered.
12. How do I determine which pricing option suits my needs best?
The pricing options vary based on user requirements and access needs. Individual users may opt for single-user licenses, while businesses requiring broader access may choose multi-user or enterprise licenses for cost-effective access to the report.
13. Are there any additional resources or data provided in the Surface Acoustic Wave Delay Line report?
While the report offers comprehensive insights, it's advisable to review the specific contents or supplementary materials provided to ascertain if additional resources or data are available.
14. How can I stay updated on further developments or reports in the Surface Acoustic Wave Delay Line?
To stay informed about further developments, trends, and reports in the Surface Acoustic Wave Delay Line, consider subscribing to industry newsletters, following relevant companies and organizations, or regularly checking reputable industry news sources and publications.
Methodology
Step 1 - Identification of Relevant Samples Size from Population Database


Step 2 - Approaches for Defining Global Market Size (Value, Volume* & Price*)

Note*: In applicable scenarios
Step 3 - Data Sources
Primary Research
- Web Analytics
- Survey Reports
- Research Institute
- Latest Research Reports
- Opinion Leaders
Secondary Research
- Annual Reports
- White Paper
- Latest Press Release
- Industry Association
- Paid Database
- Investor Presentations

Step 4 - Data Triangulation
Involves using different sources of information in order to increase the validity of a study
These sources are likely to be stakeholders in a program - participants, other researchers, program staff, other community members, and so on.
Then we put all data in single framework & apply various statistical tools to find out the dynamic on the market.
During the analysis stage, feedback from the stakeholder groups would be compared to determine areas of agreement as well as areas of divergence