

Key Insights
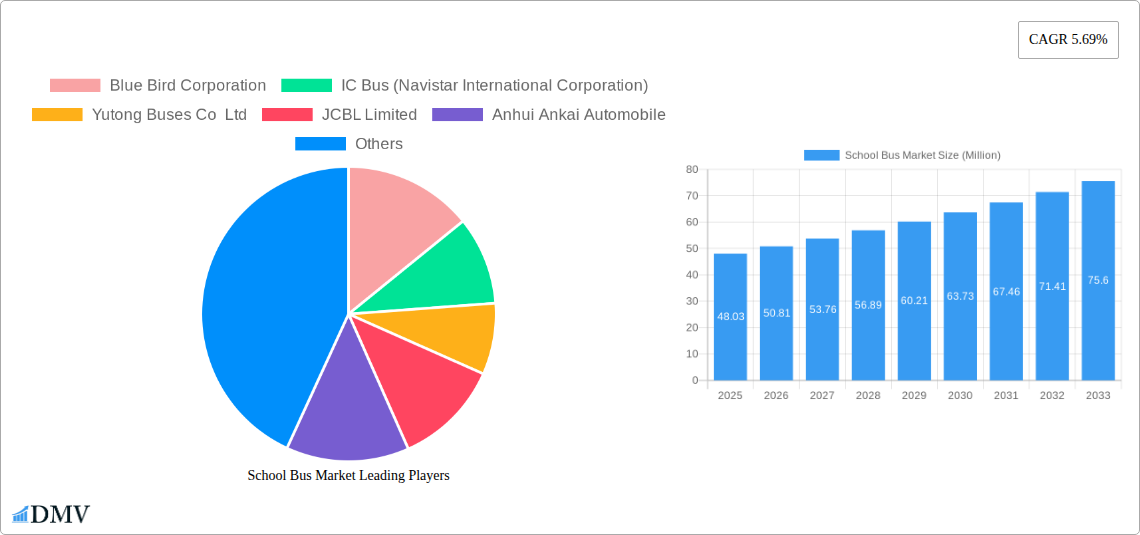
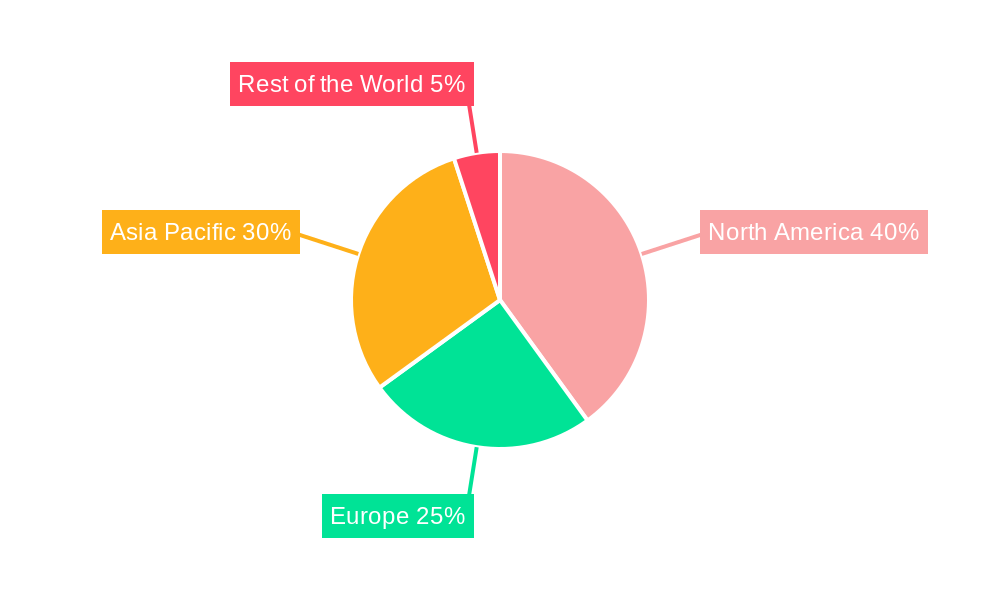
The global school bus market, valued at $48.03 million in 2025, is projected to experience robust growth, driven by rising school-age populations, increasing government initiatives promoting safe and efficient student transportation, and a growing preference for specialized school buses offering enhanced safety features and comfort. The market's Compound Annual Growth Rate (CAGR) of 5.69% from 2025 to 2033 indicates a significant expansion over the forecast period. Key growth drivers include the increasing adoption of electric and hybrid school buses to reduce carbon emissions and improve air quality around schools, along with technological advancements like improved safety systems (e.g., cameras, GPS tracking) and enhanced accessibility features for students with disabilities. Market segmentation reveals strong demand across various propulsion types, with Internal Combustion Engine (ICE) buses still dominating, but electric and hybrid options witnessing rapid adoption fueled by environmental concerns and government subsidies. Different capacity design types cater to varying school sizes and student populations, further contributing to market diversification. Geographically, North America and Asia Pacific are expected to lead the market due to substantial infrastructure development, robust economies, and expanding school populations. However, challenges such as fluctuating fuel prices and stringent emission regulations could potentially restrain market growth in some regions.
Despite the dominance of ICE buses, the shift towards sustainable transportation is evident in the increasing adoption of CNG/LNG and electric/hybrid options. This transition is fueled by government regulations promoting cleaner transportation and growing environmental awareness. The presence of established players like Blue Bird Corporation and Thomas Built Buses, alongside emerging players like Lion Electric Company, indicates a competitive landscape with ongoing innovation in bus technology. Furthermore, the expanding middle class in developing economies of Asia Pacific is expected to significantly boost demand for school buses in the coming years. Strategic partnerships and mergers & acquisitions are expected to shape the market's competitive dynamics, with companies focusing on offering innovative solutions and expanding their global footprint to capitalize on the growing market opportunity. The market's future trajectory depends on factors such as government policies, technological advancements, economic growth, and the evolving preferences of school districts and transportation authorities.
School Bus Market: A Comprehensive Report (2019-2033)
This insightful report provides a detailed analysis of the global School Bus Market, offering a comprehensive overview of its current state, future trends, and key players. With a study period spanning 2019-2033, a base year of 2025, and a forecast period of 2025-2033, this report is an invaluable resource for stakeholders seeking to understand and capitalize on the evolving dynamics of this crucial sector. The market is projected to reach xx Million by 2033, exhibiting a robust Compound Annual Growth Rate (CAGR).
School Bus Market Market Composition & Trends
This section delves into the intricate composition of the school bus market, examining market concentration, innovation drivers, regulatory landscapes, substitute products, end-user profiles, and mergers & acquisitions (M&A) activities. We analyze the market share distribution among key players, revealing the competitive landscape and identifying areas of dominance. The report also quantifies the value of significant M&A deals, providing crucial insights into strategic market movements. For instance, the market share of the top three players—Blue Bird Corporation, IC Bus, and Yutong Buses—is estimated at approximately 45% in 2025. The total value of M&A deals in the school bus sector during the historical period (2019-2024) is estimated at xx Million.
- Market Concentration: High concentration in certain regions, with a few dominant players.
- Innovation Catalysts: Stringent emission regulations and rising demand for electric and hybrid buses.
- Regulatory Landscape: Varying regulations across different geographies impacting technology adoption.
- Substitute Products: Limited viable substitutes, mainly private transportation options.
- End-User Profiles: School districts, private schools, and charter schools.
- M&A Activities: Strategic acquisitions driving consolidation and expansion into new markets.
School Bus Market Industry Evolution
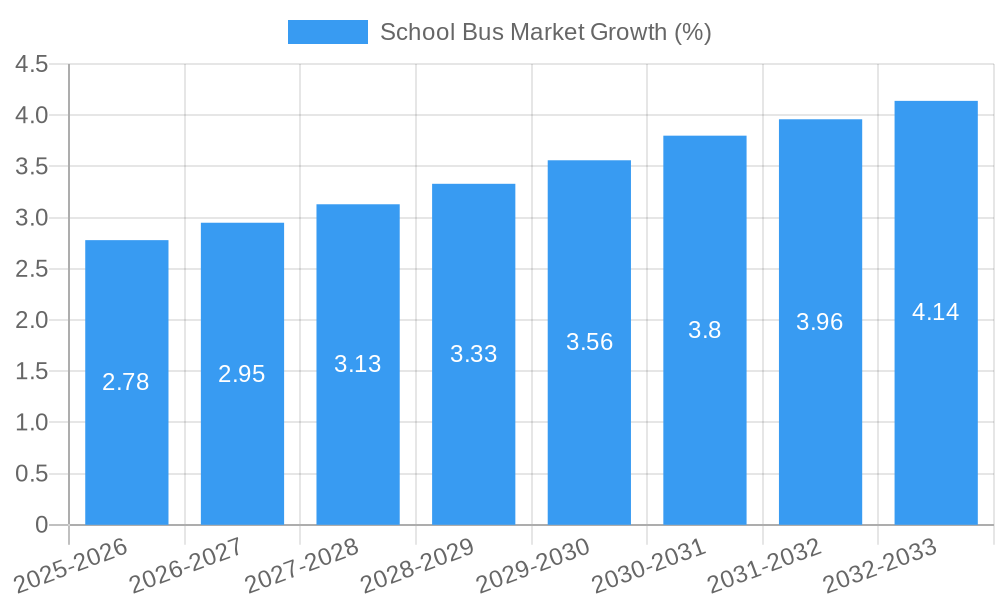
This section meticulously analyzes the historical and projected growth trajectories of the school bus market, detailing technological advancements and shifting consumer demands. We present specific data points, such as growth rates and adoption metrics, providing a comprehensive understanding of market evolution. The market experienced a period of slower growth during the 2019-2022 period, impacted by the global pandemic. However, with the recovery and increasing focus on sustainable transportation, the market is anticipated to witness a significant uptick, with a projected CAGR of xx% during the forecast period (2025-2033). Key technological advancements include the rising adoption of electric and hybrid propulsion systems, alongside improvements in safety features and telematics integration. The shift in consumer demand is primarily driven by concerns over environmental sustainability and the desire for safer and more efficient transportation solutions.
Leading Regions, Countries, or Segments in School Bus Market
This section identifies the dominant regions, countries, and segments within the school bus market, focusing on propulsion type (Internal Combustion Engine (ICE), Compressed Natural Gas (CNG)/Liquified Natural Gas (LNG), Electric and Hybrid) and capacity design type (Type A, Type B, Type C, Type D). We analyze the key drivers behind this dominance, including investment trends and regulatory support.
By Propulsion Type:
- Internal Combustion Engine (ICE): Continues to hold a significant market share due to lower upfront costs. However, this segment is facing declining growth due to environmental concerns.
- Electric and Hybrid: Experiencing rapid growth driven by government incentives and environmental regulations. North America and Europe are leading this adoption.
- CNG/LNG: A niche segment with moderate growth, primarily in regions with favorable natural gas infrastructure.
By Capacity Design Type:
- Type A: Dominates the market due to its suitability for smaller school districts and routes.
- Type B: Moderate market share, catering to mid-size routes.
- Type C & D: Smaller market share, primarily used for larger districts and transportation of greater numbers of students.
Key Drivers:
- Government Regulations: Emission standards and incentives for electric buses are major driving forces.
- Investment Trends: Significant investments in electric bus infrastructure are accelerating market growth.
- Fuel Costs: Fluctuations in fuel prices influence the adoption of alternative fuel technologies.
School Bus Market Product Innovations
This section details recent product innovations, their applications, and performance metrics, highlighting unique selling propositions (USPs) and technological advancements. The market is witnessing an influx of electric and hybrid school buses offering improved fuel efficiency, reduced emissions, and enhanced safety features. Companies are focusing on increased battery range, advanced telematics systems for real-time monitoring, and improved passenger comfort. The introduction of features like advanced driver-assistance systems (ADAS) and improved safety technologies are also key trends.
Propelling Factors for School Bus Market Growth
Several factors are propelling the growth of the school bus market. These include increasing government investments in school infrastructure, stringent emission norms driving the demand for electric buses, and the growing awareness of environmental sustainability. Moreover, technological advancements such as the development of safer and more efficient buses and the integration of telematics contribute to the growth.
Obstacles in the School Bus Market Market
The school bus market faces several obstacles, including high initial costs of electric and hybrid buses, the complexity of integrating new technologies, and fluctuations in raw material prices impacting production costs. Additionally, supply chain disruptions can lead to production delays and impact market growth.
Future Opportunities in School Bus Market
The future of the school bus market presents significant opportunities. The expanding adoption of electric and autonomous technologies, coupled with the development of advanced safety features, opens up new avenues for growth. Moreover, untapped markets in developing countries and the increasing focus on school transportation safety represent a significant growth potential.
Major Players in the School Bus Market Ecosystem
- Blue Bird Corporation
- IC Bus (Navistar International Corporation)
- Yutong Buses Co Ltd
- JCBL Limited
- Anhui Ankai Automobile
- Thomas Built Buses Inc
- Lion Electric Company
- Collins Bus Corporation
- Tata Motor
Key Developments in School Bus Market Industry
- December 2023: GreenPower Motor Company secured its first orders for the all-electric Nano BEAST school bus in New York.
- October 2023: GreenPower unveiled the Mega BEAST, a Type D electric school bus with a 140-mile range.
- September 2023: Phoenix Motor Inc. received an order for ten all-electric Type-A school buses in the District of Columbia.
Strategic School Bus Market Market Forecast
The school bus market is poised for significant growth, driven by the increasing demand for sustainable transportation solutions and technological advancements. The rising adoption of electric and hybrid buses, coupled with government initiatives promoting cleaner transportation, is expected to fuel substantial market expansion over the forecast period. The focus on safety and technological integration further enhances the market potential.
School Bus Market Segmentation
-
1. Propulsion Type
- 1.1. Internal Combustion Engine (ICE)
- 1.2. Compress
- 1.3. Electric and Hybrid
-
2. Capacity Design Type
- 2.1. Type A
- 2.2. Type B
- 2.3. Type C
- 2.4. Type D
School Bus Market Segmentation By Geography
-
1. North America
- 1.1. United States
- 1.2. Canada
- 1.3. Mexico
- 1.4. Rest of North America
-
2. Europe
- 2.1. Germany
- 2.2. United Kingdom
- 2.3. France
- 2.4. Russia
- 2.5. Spain
- 2.6. Rest of Europe
-
3. Asia Pacific
- 3.1. China
- 3.2. India
- 3.3. Japan
- 3.4. South Korea
- 3.5. Rest of Asia Pacific
-
4. Rest of the World
- 4.1. South America
- 4.2. Middle East and Africa
School Bus Market REPORT HIGHLIGHTS
| Aspects | Details |
|---|---|
| Study Period | 2019-2033 |
| Base Year | 2024 |
| Estimated Year | 2025 |
| Forecast Period | 2025-2033 |
| Historical Period | 2019-2024 |
| Growth Rate | CAGR of 5.69% from 2019-2033 |
| Segmentation |
|
Table of Contents
- 1. Introduction
- 1.1. Research Scope
- 1.2. Market Segmentation
- 1.3. Research Methodology
- 1.4. Definitions and Assumptions
- 2. Executive Summary
- 2.1. Introduction
- 3. Market Dynamics
- 3.1. Introduction
- 3.2. Market Drivers
- 3.2.1. Government Initiatives Worldwide Supporting Education Infrastructure are Propelling Growth
- 3.3. Market Restrains
- 3.3.1. Stringent Regulatory Compliance Standards Related to Emissions and Safety Present Hurdles
- 3.4. Market Trends
- 3.4.1. Growing Sales of Electric School Buses to Witness Growth in Coming Years
- 4. Market Factor Analysis
- 4.1. Porters Five Forces
- 4.2. Supply/Value Chain
- 4.3. PESTEL analysis
- 4.4. Market Entropy
- 4.5. Patent/Trademark Analysis
- 5. Global School Bus Market Analysis, Insights and Forecast, 2019-2031
- 5.1. Market Analysis, Insights and Forecast - by Propulsion Type
- 5.1.1. Internal Combustion Engine (ICE)
- 5.1.2. Compress
- 5.1.3. Electric and Hybrid
- 5.2. Market Analysis, Insights and Forecast - by Capacity Design Type
- 5.2.1. Type A
- 5.2.2. Type B
- 5.2.3. Type C
- 5.2.4. Type D
- 5.3. Market Analysis, Insights and Forecast - by Region
- 5.3.1. North America
- 5.3.2. Europe
- 5.3.3. Asia Pacific
- 5.3.4. Rest of the World
- 5.1. Market Analysis, Insights and Forecast - by Propulsion Type
- 6. North America School Bus Market Analysis, Insights and Forecast, 2019-2031
- 6.1. Market Analysis, Insights and Forecast - by Propulsion Type
- 6.1.1. Internal Combustion Engine (ICE)
- 6.1.2. Compress
- 6.1.3. Electric and Hybrid
- 6.2. Market Analysis, Insights and Forecast - by Capacity Design Type
- 6.2.1. Type A
- 6.2.2. Type B
- 6.2.3. Type C
- 6.2.4. Type D
- 6.1. Market Analysis, Insights and Forecast - by Propulsion Type
- 7. Europe School Bus Market Analysis, Insights and Forecast, 2019-2031
- 7.1. Market Analysis, Insights and Forecast - by Propulsion Type
- 7.1.1. Internal Combustion Engine (ICE)
- 7.1.2. Compress
- 7.1.3. Electric and Hybrid
- 7.2. Market Analysis, Insights and Forecast - by Capacity Design Type
- 7.2.1. Type A
- 7.2.2. Type B
- 7.2.3. Type C
- 7.2.4. Type D
- 7.1. Market Analysis, Insights and Forecast - by Propulsion Type
- 8. Asia Pacific School Bus Market Analysis, Insights and Forecast, 2019-2031
- 8.1. Market Analysis, Insights and Forecast - by Propulsion Type
- 8.1.1. Internal Combustion Engine (ICE)
- 8.1.2. Compress
- 8.1.3. Electric and Hybrid
- 8.2. Market Analysis, Insights and Forecast - by Capacity Design Type
- 8.2.1. Type A
- 8.2.2. Type B
- 8.2.3. Type C
- 8.2.4. Type D
- 8.1. Market Analysis, Insights and Forecast - by Propulsion Type
- 9. Rest of the World School Bus Market Analysis, Insights and Forecast, 2019-2031
- 9.1. Market Analysis, Insights and Forecast - by Propulsion Type
- 9.1.1. Internal Combustion Engine (ICE)
- 9.1.2. Compress
- 9.1.3. Electric and Hybrid
- 9.2. Market Analysis, Insights and Forecast - by Capacity Design Type
- 9.2.1. Type A
- 9.2.2. Type B
- 9.2.3. Type C
- 9.2.4. Type D
- 9.1. Market Analysis, Insights and Forecast - by Propulsion Type
- 10. North America School Bus Market Analysis, Insights and Forecast, 2019-2031
- 10.1. Market Analysis, Insights and Forecast - By Country/Sub-region
- 10.1.1 United States
- 10.1.2 Canada
- 10.1.3 Mexico
- 10.1.4 Rest of North America
- 11. Europe School Bus Market Analysis, Insights and Forecast, 2019-2031
- 11.1. Market Analysis, Insights and Forecast - By Country/Sub-region
- 11.1.1 Germany
- 11.1.2 United Kingdom
- 11.1.3 France
- 11.1.4 Russia
- 11.1.5 Spain
- 11.1.6 Rest of Europe
- 12. Asia Pacific School Bus Market Analysis, Insights and Forecast, 2019-2031
- 12.1. Market Analysis, Insights and Forecast - By Country/Sub-region
- 12.1.1 China
- 12.1.2 India
- 12.1.3 Japan
- 12.1.4 South Korea
- 12.1.5 Rest of Asia Pacific
- 13. Rest of the World School Bus Market Analysis, Insights and Forecast, 2019-2031
- 13.1. Market Analysis, Insights and Forecast - By Country/Sub-region
- 13.1.1 South America
- 13.1.2 Middle East and Africa
- 14. Competitive Analysis
- 14.1. Global Market Share Analysis 2024
- 14.2. Company Profiles
- 14.2.1 Blue Bird Corporation
- 14.2.1.1. Overview
- 14.2.1.2. Products
- 14.2.1.3. SWOT Analysis
- 14.2.1.4. Recent Developments
- 14.2.1.5. Financials (Based on Availability)
- 14.2.2 IC Bus (Navistar International Corporation)
- 14.2.2.1. Overview
- 14.2.2.2. Products
- 14.2.2.3. SWOT Analysis
- 14.2.2.4. Recent Developments
- 14.2.2.5. Financials (Based on Availability)
- 14.2.3 Yutong Buses Co Ltd
- 14.2.3.1. Overview
- 14.2.3.2. Products
- 14.2.3.3. SWOT Analysis
- 14.2.3.4. Recent Developments
- 14.2.3.5. Financials (Based on Availability)
- 14.2.4 JCBL Limited
- 14.2.4.1. Overview
- 14.2.4.2. Products
- 14.2.4.3. SWOT Analysis
- 14.2.4.4. Recent Developments
- 14.2.4.5. Financials (Based on Availability)
- 14.2.5 Anhui Ankai Automobile
- 14.2.5.1. Overview
- 14.2.5.2. Products
- 14.2.5.3. SWOT Analysis
- 14.2.5.4. Recent Developments
- 14.2.5.5. Financials (Based on Availability)
- 14.2.6 Thomas Built Buses Inc
- 14.2.6.1. Overview
- 14.2.6.2. Products
- 14.2.6.3. SWOT Analysis
- 14.2.6.4. Recent Developments
- 14.2.6.5. Financials (Based on Availability)
- 14.2.7 Lion Electric Company
- 14.2.7.1. Overview
- 14.2.7.2. Products
- 14.2.7.3. SWOT Analysis
- 14.2.7.4. Recent Developments
- 14.2.7.5. Financials (Based on Availability)
- 14.2.8 Collins Bus Corporation
- 14.2.8.1. Overview
- 14.2.8.2. Products
- 14.2.8.3. SWOT Analysis
- 14.2.8.4. Recent Developments
- 14.2.8.5. Financials (Based on Availability)
- 14.2.9 Tata Motor
- 14.2.9.1. Overview
- 14.2.9.2. Products
- 14.2.9.3. SWOT Analysis
- 14.2.9.4. Recent Developments
- 14.2.9.5. Financials (Based on Availability)
- 14.2.1 Blue Bird Corporation
List of Figures
- Figure 1: Global School Bus Market Revenue Breakdown (Million, %) by Region 2024 & 2032
- Figure 2: North America School Bus Market Revenue (Million), by Country 2024 & 2032
- Figure 3: North America School Bus Market Revenue Share (%), by Country 2024 & 2032
- Figure 4: Europe School Bus Market Revenue (Million), by Country 2024 & 2032
- Figure 5: Europe School Bus Market Revenue Share (%), by Country 2024 & 2032
- Figure 6: Asia Pacific School Bus Market Revenue (Million), by Country 2024 & 2032
- Figure 7: Asia Pacific School Bus Market Revenue Share (%), by Country 2024 & 2032
- Figure 8: Rest of the World School Bus Market Revenue (Million), by Country 2024 & 2032
- Figure 9: Rest of the World School Bus Market Revenue Share (%), by Country 2024 & 2032
- Figure 10: North America School Bus Market Revenue (Million), by Propulsion Type 2024 & 2032
- Figure 11: North America School Bus Market Revenue Share (%), by Propulsion Type 2024 & 2032
- Figure 12: North America School Bus Market Revenue (Million), by Capacity Design Type 2024 & 2032
- Figure 13: North America School Bus Market Revenue Share (%), by Capacity Design Type 2024 & 2032
- Figure 14: North America School Bus Market Revenue (Million), by Country 2024 & 2032
- Figure 15: North America School Bus Market Revenue Share (%), by Country 2024 & 2032
- Figure 16: Europe School Bus Market Revenue (Million), by Propulsion Type 2024 & 2032
- Figure 17: Europe School Bus Market Revenue Share (%), by Propulsion Type 2024 & 2032
- Figure 18: Europe School Bus Market Revenue (Million), by Capacity Design Type 2024 & 2032
- Figure 19: Europe School Bus Market Revenue Share (%), by Capacity Design Type 2024 & 2032
- Figure 20: Europe School Bus Market Revenue (Million), by Country 2024 & 2032
- Figure 21: Europe School Bus Market Revenue Share (%), by Country 2024 & 2032
- Figure 22: Asia Pacific School Bus Market Revenue (Million), by Propulsion Type 2024 & 2032
- Figure 23: Asia Pacific School Bus Market Revenue Share (%), by Propulsion Type 2024 & 2032
- Figure 24: Asia Pacific School Bus Market Revenue (Million), by Capacity Design Type 2024 & 2032
- Figure 25: Asia Pacific School Bus Market Revenue Share (%), by Capacity Design Type 2024 & 2032
- Figure 26: Asia Pacific School Bus Market Revenue (Million), by Country 2024 & 2032
- Figure 27: Asia Pacific School Bus Market Revenue Share (%), by Country 2024 & 2032
- Figure 28: Rest of the World School Bus Market Revenue (Million), by Propulsion Type 2024 & 2032
- Figure 29: Rest of the World School Bus Market Revenue Share (%), by Propulsion Type 2024 & 2032
- Figure 30: Rest of the World School Bus Market Revenue (Million), by Capacity Design Type 2024 & 2032
- Figure 31: Rest of the World School Bus Market Revenue Share (%), by Capacity Design Type 2024 & 2032
- Figure 32: Rest of the World School Bus Market Revenue (Million), by Country 2024 & 2032
- Figure 33: Rest of the World School Bus Market Revenue Share (%), by Country 2024 & 2032
List of Tables
- Table 1: Global School Bus Market Revenue Million Forecast, by Region 2019 & 2032
- Table 2: Global School Bus Market Revenue Million Forecast, by Propulsion Type 2019 & 2032
- Table 3: Global School Bus Market Revenue Million Forecast, by Capacity Design Type 2019 & 2032
- Table 4: Global School Bus Market Revenue Million Forecast, by Region 2019 & 2032
- Table 5: Global School Bus Market Revenue Million Forecast, by Country 2019 & 2032
- Table 6: United States School Bus Market Revenue (Million) Forecast, by Application 2019 & 2032
- Table 7: Canada School Bus Market Revenue (Million) Forecast, by Application 2019 & 2032
- Table 8: Mexico School Bus Market Revenue (Million) Forecast, by Application 2019 & 2032
- Table 9: Rest of North America School Bus Market Revenue (Million) Forecast, by Application 2019 & 2032
- Table 10: Global School Bus Market Revenue Million Forecast, by Country 2019 & 2032
- Table 11: Germany School Bus Market Revenue (Million) Forecast, by Application 2019 & 2032
- Table 12: United Kingdom School Bus Market Revenue (Million) Forecast, by Application 2019 & 2032
- Table 13: France School Bus Market Revenue (Million) Forecast, by Application 2019 & 2032
- Table 14: Russia School Bus Market Revenue (Million) Forecast, by Application 2019 & 2032
- Table 15: Spain School Bus Market Revenue (Million) Forecast, by Application 2019 & 2032
- Table 16: Rest of Europe School Bus Market Revenue (Million) Forecast, by Application 2019 & 2032
- Table 17: Global School Bus Market Revenue Million Forecast, by Country 2019 & 2032
- Table 18: China School Bus Market Revenue (Million) Forecast, by Application 2019 & 2032
- Table 19: India School Bus Market Revenue (Million) Forecast, by Application 2019 & 2032
- Table 20: Japan School Bus Market Revenue (Million) Forecast, by Application 2019 & 2032
- Table 21: South Korea School Bus Market Revenue (Million) Forecast, by Application 2019 & 2032
- Table 22: Rest of Asia Pacific School Bus Market Revenue (Million) Forecast, by Application 2019 & 2032
- Table 23: Global School Bus Market Revenue Million Forecast, by Country 2019 & 2032
- Table 24: South America School Bus Market Revenue (Million) Forecast, by Application 2019 & 2032
- Table 25: Middle East and Africa School Bus Market Revenue (Million) Forecast, by Application 2019 & 2032
- Table 26: Global School Bus Market Revenue Million Forecast, by Propulsion Type 2019 & 2032
- Table 27: Global School Bus Market Revenue Million Forecast, by Capacity Design Type 2019 & 2032
- Table 28: Global School Bus Market Revenue Million Forecast, by Country 2019 & 2032
- Table 29: United States School Bus Market Revenue (Million) Forecast, by Application 2019 & 2032
- Table 30: Canada School Bus Market Revenue (Million) Forecast, by Application 2019 & 2032
- Table 31: Mexico School Bus Market Revenue (Million) Forecast, by Application 2019 & 2032
- Table 32: Rest of North America School Bus Market Revenue (Million) Forecast, by Application 2019 & 2032
- Table 33: Global School Bus Market Revenue Million Forecast, by Propulsion Type 2019 & 2032
- Table 34: Global School Bus Market Revenue Million Forecast, by Capacity Design Type 2019 & 2032
- Table 35: Global School Bus Market Revenue Million Forecast, by Country 2019 & 2032
- Table 36: Germany School Bus Market Revenue (Million) Forecast, by Application 2019 & 2032
- Table 37: United Kingdom School Bus Market Revenue (Million) Forecast, by Application 2019 & 2032
- Table 38: France School Bus Market Revenue (Million) Forecast, by Application 2019 & 2032
- Table 39: Russia School Bus Market Revenue (Million) Forecast, by Application 2019 & 2032
- Table 40: Spain School Bus Market Revenue (Million) Forecast, by Application 2019 & 2032
- Table 41: Rest of Europe School Bus Market Revenue (Million) Forecast, by Application 2019 & 2032
- Table 42: Global School Bus Market Revenue Million Forecast, by Propulsion Type 2019 & 2032
- Table 43: Global School Bus Market Revenue Million Forecast, by Capacity Design Type 2019 & 2032
- Table 44: Global School Bus Market Revenue Million Forecast, by Country 2019 & 2032
- Table 45: China School Bus Market Revenue (Million) Forecast, by Application 2019 & 2032
- Table 46: India School Bus Market Revenue (Million) Forecast, by Application 2019 & 2032
- Table 47: Japan School Bus Market Revenue (Million) Forecast, by Application 2019 & 2032
- Table 48: South Korea School Bus Market Revenue (Million) Forecast, by Application 2019 & 2032
- Table 49: Rest of Asia Pacific School Bus Market Revenue (Million) Forecast, by Application 2019 & 2032
- Table 50: Global School Bus Market Revenue Million Forecast, by Propulsion Type 2019 & 2032
- Table 51: Global School Bus Market Revenue Million Forecast, by Capacity Design Type 2019 & 2032
- Table 52: Global School Bus Market Revenue Million Forecast, by Country 2019 & 2032
- Table 53: South America School Bus Market Revenue (Million) Forecast, by Application 2019 & 2032
- Table 54: Middle East and Africa School Bus Market Revenue (Million) Forecast, by Application 2019 & 2032
Frequently Asked Questions
1. What is the projected Compound Annual Growth Rate (CAGR) of the School Bus Market?
The projected CAGR is approximately 5.69%.
2. Which companies are prominent players in the School Bus Market?
Key companies in the market include Blue Bird Corporation, IC Bus (Navistar International Corporation), Yutong Buses Co Ltd, JCBL Limited, Anhui Ankai Automobile, Thomas Built Buses Inc, Lion Electric Company, Collins Bus Corporation, Tata Motor.
3. What are the main segments of the School Bus Market?
The market segments include Propulsion Type, Capacity Design Type.
4. Can you provide details about the market size?
The market size is estimated to be USD 48.03 Million as of 2022.
5. What are some drivers contributing to market growth?
Government Initiatives Worldwide Supporting Education Infrastructure are Propelling Growth.
6. What are the notable trends driving market growth?
Growing Sales of Electric School Buses to Witness Growth in Coming Years.
7. Are there any restraints impacting market growth?
Stringent Regulatory Compliance Standards Related to Emissions and Safety Present Hurdles.
8. Can you provide examples of recent developments in the market?
Dec 2023: GreenPower Motor Company announced its first orders for the Type A all-electric, purpose-built, zero-emission Nano BEAST school bus for the New York market through its dealer Leonard Bus Sales.
9. What pricing options are available for accessing the report?
Pricing options include single-user, multi-user, and enterprise licenses priced at USD 4750, USD 5250, and USD 8750 respectively.
10. Is the market size provided in terms of value or volume?
The market size is provided in terms of value, measured in Million.
11. Are there any specific market keywords associated with the report?
Yes, the market keyword associated with the report is "School Bus Market," which aids in identifying and referencing the specific market segment covered.
12. How do I determine which pricing option suits my needs best?
The pricing options vary based on user requirements and access needs. Individual users may opt for single-user licenses, while businesses requiring broader access may choose multi-user or enterprise licenses for cost-effective access to the report.
13. Are there any additional resources or data provided in the School Bus Market report?
While the report offers comprehensive insights, it's advisable to review the specific contents or supplementary materials provided to ascertain if additional resources or data are available.
14. How can I stay updated on further developments or reports in the School Bus Market?
To stay informed about further developments, trends, and reports in the School Bus Market, consider subscribing to industry newsletters, following relevant companies and organizations, or regularly checking reputable industry news sources and publications.
Methodology
Step 1 - Identification of Relevant Samples Size from Population Database


Step 2 - Approaches for Defining Global Market Size (Value, Volume* & Price*)

Note*: In applicable scenarios
Step 3 - Data Sources
Primary Research
- Web Analytics
- Survey Reports
- Research Institute
- Latest Research Reports
- Opinion Leaders
Secondary Research
- Annual Reports
- White Paper
- Latest Press Release
- Industry Association
- Paid Database
- Investor Presentations

Step 4 - Data Triangulation
Involves using different sources of information in order to increase the validity of a study
These sources are likely to be stakeholders in a program - participants, other researchers, program staff, other community members, and so on.
Then we put all data in single framework & apply various statistical tools to find out the dynamic on the market.
During the analysis stage, feedback from the stakeholder groups would be compared to determine areas of agreement as well as areas of divergence
