

Key Insights
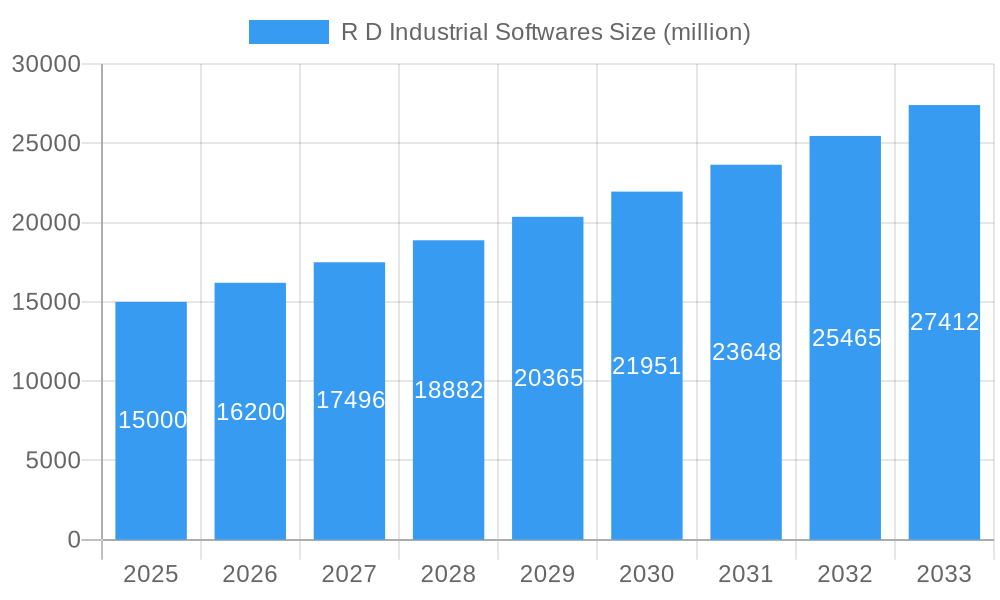
The R&D Industrial Software market is experiencing robust growth, driven by increasing adoption of digital twin technology, the rise of Industry 4.0 initiatives, and the expanding need for simulation and modeling across diverse industries like automotive, aerospace, and manufacturing. The market's substantial size, estimated at $15 billion in 2025, reflects the critical role these software solutions play in streamlining product development, optimizing processes, and reducing time-to-market. A Compound Annual Growth Rate (CAGR) of 8% is projected for the period 2025-2033, indicating sustained expansion fueled by continuous technological advancements and broader industry adoption. Key market segments include Computer-Aided Design (CAD) software, Computational Fluid Dynamics (CFD) software, and Finite Element Analysis (FEA) software, each experiencing unique growth trajectories based on specific industry demands. Leading players like Ansys, Dassault Systèmes, Siemens, and Autodesk are continuously innovating and investing in research and development to maintain their market positions. However, competitive pressures are also evident, with emerging players and specialized solution providers seeking to disrupt the market. The market's growth is tempered by factors such as the high cost of software licenses and the need for specialized expertise to effectively utilize these advanced tools. Nevertheless, the long-term outlook for R&D Industrial Software remains positive, driven by ongoing technological advancements and the increasing strategic importance of digitalization across industries.
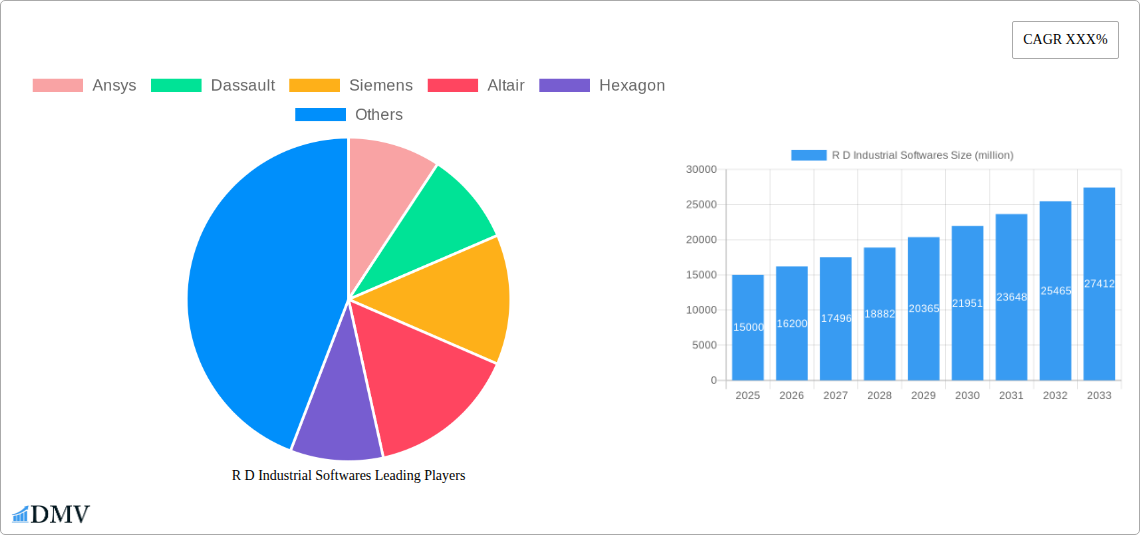
R D Industrial Softwares Market Size (In Billion)
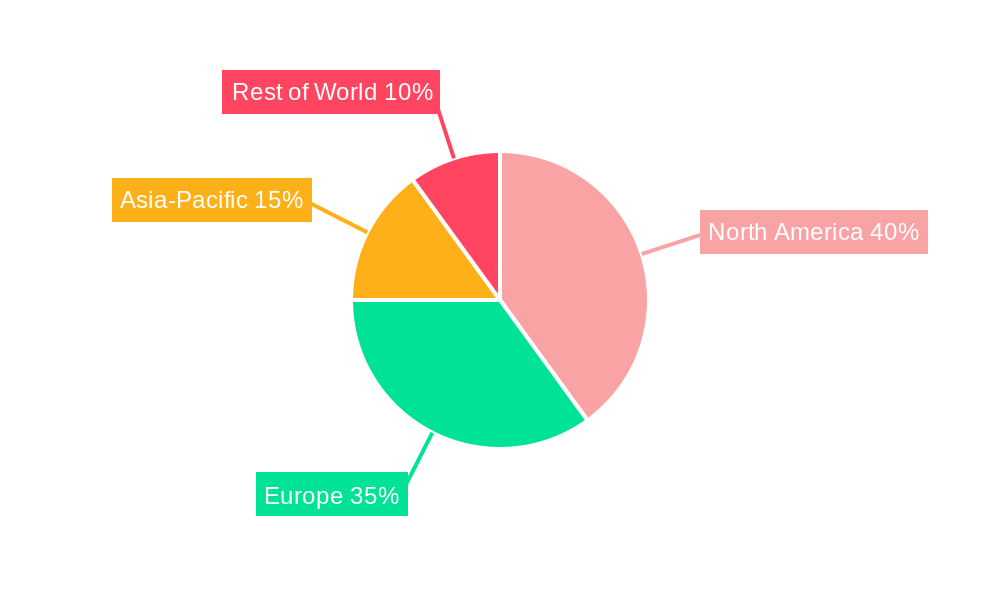
The competitive landscape is characterized by a blend of established industry giants and specialized niche players. Large companies like Ansys, Dassault Systèmes, and Siemens benefit from extensive market presence and established customer bases. However, smaller, more agile companies are capitalizing on specific market niches by offering specialized solutions or innovative technologies. The geographic distribution of the market shows a concentration in developed regions like North America and Europe, driven by high technological adoption rates and established industrial bases. However, emerging markets in Asia-Pacific and other regions are expected to experience significant growth in the coming years, driven by increasing industrialization and digital transformation efforts. The continued development of cloud-based solutions, AI-powered features, and enhanced user interfaces will further contribute to market expansion and broader accessibility of these powerful tools.
R D Industrial Softwares Company Market Share
R&D Industrial Softwares Market Report: 2019-2033 - A Comprehensive Analysis
This insightful report from R D Industrial Softwares provides a detailed analysis of the global R&D industrial software market from 2019 to 2033. The study covers market size, competitive landscape, technological advancements, and future growth prospects, offering valuable insights for stakeholders across the industry. With a base year of 2025 and a forecast period extending to 2033, this report is essential for strategic decision-making and investment planning. The market is projected to reach a value exceeding xx million by 2033, presenting significant opportunities for growth and innovation.
R&D Industrial Softwares Market Composition & Trends
This section delves into the current structure and future trends shaping the R&D industrial software market. We analyze market concentration, identifying key players like Ansys, Dassault Systèmes, Siemens, Altair, and Autodesk, and quantify their market share distribution. The report examines innovation drivers, regulatory landscapes impacting software development and deployment, and the presence of substitute products. We also profile end-users across various industries and analyze M&A activities, including deal values (estimated at xx million in total for the period 2019-2024). The analysis reveals a dynamic market with ongoing consolidation and a strong emphasis on technological advancements.
- Market Concentration: Highly concentrated, with the top 5 players holding approximately xx% of the market share in 2025.
- M&A Activity: A total of xx M&A deals were recorded between 2019 and 2024, with an aggregate value exceeding xx million.
- Innovation Catalysts: Increased demand for simulation and modeling capabilities, coupled with advancements in AI and cloud computing, are driving innovation.
- Regulatory Landscape: Varying regulations across different geographies impact software adoption and development.
- End-User Profiles: The market is segmented across various industries including aerospace, automotive, manufacturing, and energy.
R&D Industrial Softwares Industry Evolution
This section offers a comprehensive overview of the evolution of the R&D industrial software market, analyzing growth trajectories, technological advancements, and evolving consumer demands. The market exhibited a compound annual growth rate (CAGR) of xx% during the historical period (2019-2024) and is projected to maintain a CAGR of xx% during the forecast period (2025-2033). This growth is propelled by increasing adoption of simulation and modeling technologies across diverse industries. The shift towards cloud-based solutions and the integration of AI and machine learning are transforming the industry landscape. The demand for sophisticated software solutions to optimize product design, enhance manufacturing processes, and accelerate R&D cycles is a major driving factor. Specific data points, including adoption rates across various industries and detailed growth rates segmented by software type, are provided within the full report.
Leading Regions, Countries, or Segments in R&D Industrial Softwares
North America is currently the dominant region in the R&D industrial software market, driven by high R&D spending, robust technological infrastructure, and a strong presence of major software vendors. This dominance is further solidified by a supportive regulatory environment and significant investments in technological advancements within the region.
- Key Drivers for North American Dominance:
- High R&D investment in key industries.
- Strong presence of major software vendors.
- Supportive regulatory environment.
- Advanced technological infrastructure.
- High adoption rates across various industries.
The report provides a detailed regional breakdown, including analysis of key countries within each region and assessment of their growth potential. Specific market drivers and challenges for each region are identified and analyzed, leading to a comprehensive understanding of market dynamics.
R&D Industrial Softwares Product Innovations
The R&D industrial software market showcases continuous innovation, with new products offering enhanced simulation capabilities, improved user interfaces, and increased integration with other software tools. Key innovations include advancements in computational fluid dynamics (CFD), finite element analysis (FEA), and multi-physics simulation. These improvements significantly enhance design efficiency and product development processes, leading to faster time-to-market and reduced development costs. The integration of AI and machine learning is fostering the development of intelligent software solutions capable of automating complex tasks and providing valuable insights for design optimization.
Propelling Factors for R&D Industrial Softwares Growth
Several key factors are driving the growth of the R&D industrial software market. Technological advancements, such as the rise of cloud computing, AI, and machine learning are creating new opportunities for software innovation and deployment. Economic factors, such as increased R&D spending across various industries, are fueling demand for sophisticated software tools. Furthermore, supportive government regulations and policies that promote technological adoption in various sectors contribute to market growth.
Obstacles in the R&D Industrial Softwares Market
Despite significant growth potential, the R&D industrial software market faces several challenges. High software licensing costs, coupled with complex implementation requirements, can limit adoption, particularly for smaller companies. Supply chain disruptions in the IT sector can impact software availability and lead to project delays. Finally, intense competition among numerous established and emerging players can create price pressures and reduce profit margins.
Future Opportunities in R&D Industrial Softwares
Future opportunities in the R&D industrial software market are abundant. The expansion into new and emerging markets, particularly in developing economies, presents significant growth potential. The adoption of advanced technologies, such as the Internet of Things (IoT) and digital twins, will create new opportunities for software integration and data analysis. Furthermore, addressing the growing demand for sustainability and energy efficiency in various industries will drive the development of specialized software solutions.
Major Players in the R&D Industrial Softwares Ecosystem
- Ansys
- Dassault Systèmes
- Siemens
- Altair
- Hexagon
- Autodesk
- ESI Group
- LiToSim
- HAJIF
- Intesim
- Tongyuan
- NUMECA
- Ceetron
- Keysight Technologies
- COMSOL
- MathWorks
- Convergent Science
- Flow Science
- Nei Software
- SimScale GmbH
Key Developments in R&D Industrial Softwares Industry
- January 2023: Ansys launches new simulation software for electric vehicle design.
- March 2023: Dassault Systèmes acquires a smaller software company specializing in generative design.
- June 2022: Siemens announces a strategic partnership with a leading cloud provider to enhance its software offerings.
- (Further developments with year/month and impact to be added in the full report)
Strategic R&D Industrial Softwares Market Forecast
The R&D industrial software market is poised for significant growth driven by technological advancements, increasing R&D spending, and expanding adoption across various sectors. The market is expected to continue its robust expansion, driven by the rising adoption of cloud-based solutions, AI-powered tools, and the increasing demand for sophisticated simulation and modeling capabilities. The focus on digital transformation across industries and the need for efficient product development will further propel market growth in the coming years, creating lucrative opportunities for established and new players alike.
R D Industrial Softwares Segmentation
-
1. Application
- 1.1. Aerospace
- 1.2. Automotive
- 1.3. Electronic
- 1.4. Others
-
2. Type
- 2.1. 2D
- 2.2. 3D
R D Industrial Softwares Segmentation By Geography
-
1. North America
- 1.1. United States
- 1.2. Canada
- 1.3. Mexico
-
2. South America
- 2.1. Brazil
- 2.2. Argentina
- 2.3. Rest of South America
-
3. Europe
- 3.1. United Kingdom
- 3.2. Germany
- 3.3. France
- 3.4. Italy
- 3.5. Spain
- 3.6. Russia
- 3.7. Benelux
- 3.8. Nordics
- 3.9. Rest of Europe
-
4. Middle East & Africa
- 4.1. Turkey
- 4.2. Israel
- 4.3. GCC
- 4.4. North Africa
- 4.5. South Africa
- 4.6. Rest of Middle East & Africa
-
5. Asia Pacific
- 5.1. China
- 5.2. India
- 5.3. Japan
- 5.4. South Korea
- 5.5. ASEAN
- 5.6. Oceania
- 5.7. Rest of Asia Pacific
R D Industrial Softwares Regional Market Share
Geographic Coverage of R D Industrial Softwares
R D Industrial Softwares REPORT HIGHLIGHTS
| Aspects | Details |
|---|---|
| Study Period | 2020-2034 |
| Base Year | 2025 |
| Estimated Year | 2026 |
| Forecast Period | 2026-2034 |
| Historical Period | 2020-2025 |
| Growth Rate | CAGR of XXX% from 2020-2034 |
| Segmentation |
|
Table of Contents
- 1. Introduction
- 1.1. Research Scope
- 1.2. Market Segmentation
- 1.3. Research Objective
- 1.4. Definitions and Assumptions
- 2. Executive Summary
- 2.1. Market Snapshot
- 3. Market Dynamics
- 3.1. Market Drivers
- 3.2. Market Restrains
- 3.3. Market Trends
- 3.4. Market Opportunities
- 4. Market Factor Analysis
- 4.1. Porters Five Forces
- 4.1.1. Bargaining Power of Suppliers
- 4.1.2. Bargaining Power of Buyers
- 4.1.3. Threat of New Entrants
- 4.1.4. Threat of Substitutes
- 4.1.5. Competitive Rivalry
- 4.2. PESTEL analysis
- 4.3. BCG Analysis
- 4.3.1. Stars (High Growth, High Market Share)
- 4.3.2. Cash Cows (Low Growth, High Market Share)
- 4.3.3. Question Mark (High Growth, Low Market Share)
- 4.3.4. Dogs (Low Growth, Low Market Share)
- 4.4. Ansoff Matrix Analysis
- 4.5. Supply Chain Analysis
- 4.6. Regulatory Landscape
- 4.7. Current Market Potential and Opportunity Assessment (TAM–SAM–SOM Framework)
- 4.8. DMV Analyst Note
- 4.1. Porters Five Forces
- 5. Market Analysis, Insights and Forecast 2021-2033
- 5.1. Market Analysis, Insights and Forecast - by Application
- 5.1.1. Aerospace
- 5.1.2. Automotive
- 5.1.3. Electronic
- 5.1.4. Others
- 5.2. Market Analysis, Insights and Forecast - by Type
- 5.2.1. 2D
- 5.2.2. 3D
- 5.3. Market Analysis, Insights and Forecast - by Region
- 5.3.1. North America
- 5.3.2. South America
- 5.3.3. Europe
- 5.3.4. Middle East & Africa
- 5.3.5. Asia Pacific
- 5.1. Market Analysis, Insights and Forecast - by Application
- 6. Global R D Industrial Softwares Analysis, Insights and Forecast, 2021-2033
- 6.1. Market Analysis, Insights and Forecast - by Application
- 6.1.1. Aerospace
- 6.1.2. Automotive
- 6.1.3. Electronic
- 6.1.4. Others
- 6.2. Market Analysis, Insights and Forecast - by Type
- 6.2.1. 2D
- 6.2.2. 3D
- 6.1. Market Analysis, Insights and Forecast - by Application
- 7. North America R D Industrial Softwares Analysis, Insights and Forecast, 2020-2032
- 7.1. Market Analysis, Insights and Forecast - by Application
- 7.1.1. Aerospace
- 7.1.2. Automotive
- 7.1.3. Electronic
- 7.1.4. Others
- 7.2. Market Analysis, Insights and Forecast - by Type
- 7.2.1. 2D
- 7.2.2. 3D
- 7.1. Market Analysis, Insights and Forecast - by Application
- 8. South America R D Industrial Softwares Analysis, Insights and Forecast, 2020-2032
- 8.1. Market Analysis, Insights and Forecast - by Application
- 8.1.1. Aerospace
- 8.1.2. Automotive
- 8.1.3. Electronic
- 8.1.4. Others
- 8.2. Market Analysis, Insights and Forecast - by Type
- 8.2.1. 2D
- 8.2.2. 3D
- 8.1. Market Analysis, Insights and Forecast - by Application
- 9. Europe R D Industrial Softwares Analysis, Insights and Forecast, 2020-2032
- 9.1. Market Analysis, Insights and Forecast - by Application
- 9.1.1. Aerospace
- 9.1.2. Automotive
- 9.1.3. Electronic
- 9.1.4. Others
- 9.2. Market Analysis, Insights and Forecast - by Type
- 9.2.1. 2D
- 9.2.2. 3D
- 9.1. Market Analysis, Insights and Forecast - by Application
- 10. Middle East & Africa R D Industrial Softwares Analysis, Insights and Forecast, 2020-2032
- 10.1. Market Analysis, Insights and Forecast - by Application
- 10.1.1. Aerospace
- 10.1.2. Automotive
- 10.1.3. Electronic
- 10.1.4. Others
- 10.2. Market Analysis, Insights and Forecast - by Type
- 10.2.1. 2D
- 10.2.2. 3D
- 10.1. Market Analysis, Insights and Forecast - by Application
- 11. Asia Pacific R D Industrial Softwares Analysis, Insights and Forecast, 2020-2032
- 11.1. Market Analysis, Insights and Forecast - by Application
- 11.1.1. Aerospace
- 11.1.2. Automotive
- 11.1.3. Electronic
- 11.1.4. Others
- 11.2. Market Analysis, Insights and Forecast - by Type
- 11.2.1. 2D
- 11.2.2. 3D
- 11.1. Market Analysis, Insights and Forecast - by Application
- 12. Competitive Analysis
- 12.1. Company Profiles
- 12.1.1 Ansys
- 12.1.1.1. Company Overview
- 12.1.1.2. Products
- 12.1.1.3. Company Financials
- 12.1.1.4. SWOT Analysis
- 12.1.2 Dassault
- 12.1.2.1. Company Overview
- 12.1.2.2. Products
- 12.1.2.3. Company Financials
- 12.1.2.4. SWOT Analysis
- 12.1.3 Siemens
- 12.1.3.1. Company Overview
- 12.1.3.2. Products
- 12.1.3.3. Company Financials
- 12.1.3.4. SWOT Analysis
- 12.1.4 Altair
- 12.1.4.1. Company Overview
- 12.1.4.2. Products
- 12.1.4.3. Company Financials
- 12.1.4.4. SWOT Analysis
- 12.1.5 Hexagon
- 12.1.5.1. Company Overview
- 12.1.5.2. Products
- 12.1.5.3. Company Financials
- 12.1.5.4. SWOT Analysis
- 12.1.6 Autodesk
- 12.1.6.1. Company Overview
- 12.1.6.2. Products
- 12.1.6.3. Company Financials
- 12.1.6.4. SWOT Analysis
- 12.1.7 ESI
- 12.1.7.1. Company Overview
- 12.1.7.2. Products
- 12.1.7.3. Company Financials
- 12.1.7.4. SWOT Analysis
- 12.1.8 LiToSim
- 12.1.8.1. Company Overview
- 12.1.8.2. Products
- 12.1.8.3. Company Financials
- 12.1.8.4. SWOT Analysis
- 12.1.9 HAJIF
- 12.1.9.1. Company Overview
- 12.1.9.2. Products
- 12.1.9.3. Company Financials
- 12.1.9.4. SWOT Analysis
- 12.1.10 Intesim
- 12.1.10.1. Company Overview
- 12.1.10.2. Products
- 12.1.10.3. Company Financials
- 12.1.10.4. SWOT Analysis
- 12.1.11 Tongyuan
- 12.1.11.1. Company Overview
- 12.1.11.2. Products
- 12.1.11.3. Company Financials
- 12.1.11.4. SWOT Analysis
- 12.1.12 NUMECA
- 12.1.12.1. Company Overview
- 12.1.12.2. Products
- 12.1.12.3. Company Financials
- 12.1.12.4. SWOT Analysis
- 12.1.13 Ceetron
- 12.1.13.1. Company Overview
- 12.1.13.2. Products
- 12.1.13.3. Company Financials
- 12.1.13.4. SWOT Analysis
- 12.1.14 Keysight Technologies
- 12.1.14.1. Company Overview
- 12.1.14.2. Products
- 12.1.14.3. Company Financials
- 12.1.14.4. SWOT Analysis
- 12.1.15 COMSOL
- 12.1.15.1. Company Overview
- 12.1.15.2. Products
- 12.1.15.3. Company Financials
- 12.1.15.4. SWOT Analysis
- 12.1.16 MathWorks
- 12.1.16.1. Company Overview
- 12.1.16.2. Products
- 12.1.16.3. Company Financials
- 12.1.16.4. SWOT Analysis
- 12.1.17 Convergent Science
- 12.1.17.1. Company Overview
- 12.1.17.2. Products
- 12.1.17.3. Company Financials
- 12.1.17.4. SWOT Analysis
- 12.1.18 Flow Science
- 12.1.18.1. Company Overview
- 12.1.18.2. Products
- 12.1.18.3. Company Financials
- 12.1.18.4. SWOT Analysis
- 12.1.19 Nei Software
- 12.1.19.1. Company Overview
- 12.1.19.2. Products
- 12.1.19.3. Company Financials
- 12.1.19.4. SWOT Analysis
- 12.1.20 SimScale GmbH
- 12.1.20.1. Company Overview
- 12.1.20.2. Products
- 12.1.20.3. Company Financials
- 12.1.20.4. SWOT Analysis
- 12.1.1 Ansys
- 12.2. Market Entropy
- 12.2.1 Company's Key Areas Served
- 12.2.2 Recent Developments
- 12.3. Company Market Share Analysis 2025
- 12.3.1 Top 5 Companies Market Share Analysis
- 12.3.2 Top 3 Companies Market Share Analysis
- 12.4. List of Potential Customers
- 13. Research Methodology
List of Figures
- Figure 1: Global R D Industrial Softwares Revenue Breakdown (million, %) by Region 2025 & 2033
- Figure 2: North America R D Industrial Softwares Revenue (million), by Application 2025 & 2033
- Figure 3: North America R D Industrial Softwares Revenue Share (%), by Application 2025 & 2033
- Figure 4: North America R D Industrial Softwares Revenue (million), by Type 2025 & 2033
- Figure 5: North America R D Industrial Softwares Revenue Share (%), by Type 2025 & 2033
- Figure 6: North America R D Industrial Softwares Revenue (million), by Country 2025 & 2033
- Figure 7: North America R D Industrial Softwares Revenue Share (%), by Country 2025 & 2033
- Figure 8: South America R D Industrial Softwares Revenue (million), by Application 2025 & 2033
- Figure 9: South America R D Industrial Softwares Revenue Share (%), by Application 2025 & 2033
- Figure 10: South America R D Industrial Softwares Revenue (million), by Type 2025 & 2033
- Figure 11: South America R D Industrial Softwares Revenue Share (%), by Type 2025 & 2033
- Figure 12: South America R D Industrial Softwares Revenue (million), by Country 2025 & 2033
- Figure 13: South America R D Industrial Softwares Revenue Share (%), by Country 2025 & 2033
- Figure 14: Europe R D Industrial Softwares Revenue (million), by Application 2025 & 2033
- Figure 15: Europe R D Industrial Softwares Revenue Share (%), by Application 2025 & 2033
- Figure 16: Europe R D Industrial Softwares Revenue (million), by Type 2025 & 2033
- Figure 17: Europe R D Industrial Softwares Revenue Share (%), by Type 2025 & 2033
- Figure 18: Europe R D Industrial Softwares Revenue (million), by Country 2025 & 2033
- Figure 19: Europe R D Industrial Softwares Revenue Share (%), by Country 2025 & 2033
- Figure 20: Middle East & Africa R D Industrial Softwares Revenue (million), by Application 2025 & 2033
- Figure 21: Middle East & Africa R D Industrial Softwares Revenue Share (%), by Application 2025 & 2033
- Figure 22: Middle East & Africa R D Industrial Softwares Revenue (million), by Type 2025 & 2033
- Figure 23: Middle East & Africa R D Industrial Softwares Revenue Share (%), by Type 2025 & 2033
- Figure 24: Middle East & Africa R D Industrial Softwares Revenue (million), by Country 2025 & 2033
- Figure 25: Middle East & Africa R D Industrial Softwares Revenue Share (%), by Country 2025 & 2033
- Figure 26: Asia Pacific R D Industrial Softwares Revenue (million), by Application 2025 & 2033
- Figure 27: Asia Pacific R D Industrial Softwares Revenue Share (%), by Application 2025 & 2033
- Figure 28: Asia Pacific R D Industrial Softwares Revenue (million), by Type 2025 & 2033
- Figure 29: Asia Pacific R D Industrial Softwares Revenue Share (%), by Type 2025 & 2033
- Figure 30: Asia Pacific R D Industrial Softwares Revenue (million), by Country 2025 & 2033
- Figure 31: Asia Pacific R D Industrial Softwares Revenue Share (%), by Country 2025 & 2033
List of Tables
- Table 1: Global R D Industrial Softwares Revenue million Forecast, by Application 2020 & 2033
- Table 2: Global R D Industrial Softwares Revenue million Forecast, by Type 2020 & 2033
- Table 3: Global R D Industrial Softwares Revenue million Forecast, by Region 2020 & 2033
- Table 4: Global R D Industrial Softwares Revenue million Forecast, by Application 2020 & 2033
- Table 5: Global R D Industrial Softwares Revenue million Forecast, by Type 2020 & 2033
- Table 6: Global R D Industrial Softwares Revenue million Forecast, by Country 2020 & 2033
- Table 7: United States R D Industrial Softwares Revenue (million) Forecast, by Application 2020 & 2033
- Table 8: Canada R D Industrial Softwares Revenue (million) Forecast, by Application 2020 & 2033
- Table 9: Mexico R D Industrial Softwares Revenue (million) Forecast, by Application 2020 & 2033
- Table 10: Global R D Industrial Softwares Revenue million Forecast, by Application 2020 & 2033
- Table 11: Global R D Industrial Softwares Revenue million Forecast, by Type 2020 & 2033
- Table 12: Global R D Industrial Softwares Revenue million Forecast, by Country 2020 & 2033
- Table 13: Brazil R D Industrial Softwares Revenue (million) Forecast, by Application 2020 & 2033
- Table 14: Argentina R D Industrial Softwares Revenue (million) Forecast, by Application 2020 & 2033
- Table 15: Rest of South America R D Industrial Softwares Revenue (million) Forecast, by Application 2020 & 2033
- Table 16: Global R D Industrial Softwares Revenue million Forecast, by Application 2020 & 2033
- Table 17: Global R D Industrial Softwares Revenue million Forecast, by Type 2020 & 2033
- Table 18: Global R D Industrial Softwares Revenue million Forecast, by Country 2020 & 2033
- Table 19: United Kingdom R D Industrial Softwares Revenue (million) Forecast, by Application 2020 & 2033
- Table 20: Germany R D Industrial Softwares Revenue (million) Forecast, by Application 2020 & 2033
- Table 21: France R D Industrial Softwares Revenue (million) Forecast, by Application 2020 & 2033
- Table 22: Italy R D Industrial Softwares Revenue (million) Forecast, by Application 2020 & 2033
- Table 23: Spain R D Industrial Softwares Revenue (million) Forecast, by Application 2020 & 2033
- Table 24: Russia R D Industrial Softwares Revenue (million) Forecast, by Application 2020 & 2033
- Table 25: Benelux R D Industrial Softwares Revenue (million) Forecast, by Application 2020 & 2033
- Table 26: Nordics R D Industrial Softwares Revenue (million) Forecast, by Application 2020 & 2033
- Table 27: Rest of Europe R D Industrial Softwares Revenue (million) Forecast, by Application 2020 & 2033
- Table 28: Global R D Industrial Softwares Revenue million Forecast, by Application 2020 & 2033
- Table 29: Global R D Industrial Softwares Revenue million Forecast, by Type 2020 & 2033
- Table 30: Global R D Industrial Softwares Revenue million Forecast, by Country 2020 & 2033
- Table 31: Turkey R D Industrial Softwares Revenue (million) Forecast, by Application 2020 & 2033
- Table 32: Israel R D Industrial Softwares Revenue (million) Forecast, by Application 2020 & 2033
- Table 33: GCC R D Industrial Softwares Revenue (million) Forecast, by Application 2020 & 2033
- Table 34: North Africa R D Industrial Softwares Revenue (million) Forecast, by Application 2020 & 2033
- Table 35: South Africa R D Industrial Softwares Revenue (million) Forecast, by Application 2020 & 2033
- Table 36: Rest of Middle East & Africa R D Industrial Softwares Revenue (million) Forecast, by Application 2020 & 2033
- Table 37: Global R D Industrial Softwares Revenue million Forecast, by Application 2020 & 2033
- Table 38: Global R D Industrial Softwares Revenue million Forecast, by Type 2020 & 2033
- Table 39: Global R D Industrial Softwares Revenue million Forecast, by Country 2020 & 2033
- Table 40: China R D Industrial Softwares Revenue (million) Forecast, by Application 2020 & 2033
- Table 41: India R D Industrial Softwares Revenue (million) Forecast, by Application 2020 & 2033
- Table 42: Japan R D Industrial Softwares Revenue (million) Forecast, by Application 2020 & 2033
- Table 43: South Korea R D Industrial Softwares Revenue (million) Forecast, by Application 2020 & 2033
- Table 44: ASEAN R D Industrial Softwares Revenue (million) Forecast, by Application 2020 & 2033
- Table 45: Oceania R D Industrial Softwares Revenue (million) Forecast, by Application 2020 & 2033
- Table 46: Rest of Asia Pacific R D Industrial Softwares Revenue (million) Forecast, by Application 2020 & 2033
Frequently Asked Questions
1. What is the projected Compound Annual Growth Rate (CAGR) of the R D Industrial Softwares?
The projected CAGR is approximately XXX%.
2. Which companies are prominent players in the R D Industrial Softwares?
Key companies in the market include Ansys, Dassault, Siemens, Altair, Hexagon, Autodesk, ESI, LiToSim, HAJIF, Intesim, Tongyuan, NUMECA, Ceetron, Keysight Technologies, COMSOL, MathWorks, Convergent Science, Flow Science, Nei Software, SimScale GmbH.
3. What are the main segments of the R D Industrial Softwares?
The market segments include Application, Type.
4. Can you provide details about the market size?
The market size is estimated to be USD XXX million as of 2022.
5. What are some drivers contributing to market growth?
N/A
6. What are the notable trends driving market growth?
N/A
7. Are there any restraints impacting market growth?
N/A
8. Can you provide examples of recent developments in the market?
N/A
9. What pricing options are available for accessing the report?
Pricing options include single-user, multi-user, and enterprise licenses priced at USD 3950.00, USD 5925.00, and USD 7900.00 respectively.
10. Is the market size provided in terms of value or volume?
The market size is provided in terms of value, measured in million.
11. Are there any specific market keywords associated with the report?
Yes, the market keyword associated with the report is "R D Industrial Softwares," which aids in identifying and referencing the specific market segment covered.
12. How do I determine which pricing option suits my needs best?
The pricing options vary based on user requirements and access needs. Individual users may opt for single-user licenses, while businesses requiring broader access may choose multi-user or enterprise licenses for cost-effective access to the report.
13. Are there any additional resources or data provided in the R D Industrial Softwares report?
While the report offers comprehensive insights, it's advisable to review the specific contents or supplementary materials provided to ascertain if additional resources or data are available.
14. How can I stay updated on further developments or reports in the R D Industrial Softwares?
To stay informed about further developments, trends, and reports in the R D Industrial Softwares, consider subscribing to industry newsletters, following relevant companies and organizations, or regularly checking reputable industry news sources and publications.
Methodology
Step 1 - Identification of Relevant Samples Size from Population Database


Step 2 - Approaches for Defining Global Market Size (Value, Volume* & Price*)

Note*: In applicable scenarios
Step 3 - Data Sources
Primary Research
- Web Analytics
- Survey Reports
- Research Institute
- Latest Research Reports
- Opinion Leaders
Secondary Research
- Annual Reports
- White Paper
- Latest Press Release
- Industry Association
- Paid Database
- Investor Presentations

Step 4 - Data Triangulation
Involves using different sources of information in order to increase the validity of a study
These sources are likely to be stakeholders in a program - participants, other researchers, program staff, other community members, and so on.
Then we put all data in single framework & apply various statistical tools to find out the dynamic on the market.
During the analysis stage, feedback from the stakeholder groups would be compared to determine areas of agreement as well as areas of divergence