

Key Insights
The Operational Technology (OT) Security market is poised for substantial growth, projected to reach a significant valuation in 2023 and expand at an impressive Compound Annual Growth Rate (CAGR) of 23.9% through 2033. This rapid expansion is primarily driven by the increasing interconnectedness of industrial control systems (ICS) and supervisory control and data acquisition (SCADA) systems within critical infrastructure and manufacturing sectors. As these OT environments become more digitized and integrated with IT networks, they present a larger attack surface for cyber threats. Consequently, organizations are prioritizing robust OT security solutions to protect against operational disruptions, intellectual property theft, and potential safety hazards. Key applications of OT security encompass both hardware and software solutions, with a growing emphasis on consulting and managed security services to address the unique complexities and specialized expertise required for securing these sensitive environments.
The market is characterized by several defining trends, including the rising adoption of AI and machine learning for threat detection and anomaly identification in OT networks, the increasing demand for industrial cybersecurity standards and compliance frameworks, and the growing need for specialized OT security platforms that can monitor and protect legacy systems alongside modern ones. However, the market also faces restraints such as the high cost of implementing comprehensive OT security solutions, a persistent shortage of skilled cybersecurity professionals with OT expertise, and the inherent challenges in integrating new security technologies into existing, often long-lived, operational environments without causing disruptions. The competitive landscape is populated by a mix of established IT security giants and specialized OT security firms, all vying to provide comprehensive protection for the industrial world.
This in-depth report provides an indispensable analysis of the Operational Technology (OT) security market, a critical domain protecting industrial control systems (ICS) and critical infrastructure. With escalating cyber threats targeting the physical world, understanding the evolving landscape of OT security solutions, services, and market dynamics is paramount for businesses across all sectors. This study, covering the Study Period of 2019–2033, with a Base Year of 2025 and a Forecast Period of 2025–2033, offers unparalleled insights for stakeholders seeking to fortify their operational environments and mitigate significant risks.
Operational Technology Security Market Composition & Trends
The Operational Technology Security market exhibits a dynamic composition influenced by a confluence of technological advancements, stringent regulatory mandates, and an ever-increasing threat surface. Market concentration is gradually shifting as specialized OT security vendors, alongside established cybersecurity players, vie for market share. Innovation catalysts are primarily driven by the convergence of IT and OT, the rise of Industrial IoT (IIoT), and the growing sophistication of nation-state and criminal cyberattacks targeting critical infrastructure. The regulatory landscape, with initiatives like NIS2 Directive and numerous national cybersecurity frameworks, is a significant force compelling organizations to invest heavily in robust OT security solutions. Substitute products are evolving, moving beyond traditional network segmentation to encompass AI-driven anomaly detection and predictive threat intelligence. End-user profiles are broadening, extending beyond traditional manufacturing and energy sectors to include transportation, utilities, and smart cities. M&A activities are on the rise, with significant deal values as larger cybersecurity firms acquire specialized OT security expertise to expand their portfolios. For instance, numerous acquisitions in the range of $500 million to $1 billion have reshaped the competitive landscape. Key M&A activities in the past three years (2021-2023) have been valued at an estimated $2.5 billion, reflecting the strategic importance of OT security.
- Market Share Distribution: Leading vendors are projected to hold approximately 60% of the market share by 2033, with specialized OT security providers demonstrating significant growth.
- M&A Deal Values: The average deal value for OT security acquisitions is expected to reach $800 million by 2027.
- Innovation Focus: Key areas of innovation include threat intelligence sharing, zero-trust architectures for OT, and cloud-based OT security management.
Operational Technology Security Industry Evolution
The Operational Technology Security industry has undergone a profound evolution, transitioning from a niche concern to a strategic imperative for global operational resilience. Over the Historical Period of 2019–2024, the market witnessed a substantial increase in awareness and investment, spurred by high-profile attacks that demonstrated the devastating potential of compromising industrial systems. Growth trajectories have been consistently upward, with an average annual growth rate (AAGR) of 15% observed during this period. Technological advancements have been central to this evolution, with the integration of Artificial Intelligence (AI) and Machine Learning (ML) revolutionizing threat detection and response capabilities. These technologies enable proactive identification of anomalies and sophisticated attack patterns that traditional signature-based methods often miss. Shifting consumer demands, in this context referring to the expectations of operational continuity and data integrity from industrial clients, have further fueled the adoption of advanced security measures. The proliferation of IIoT devices, while offering immense operational benefits, also introduced new vulnerabilities, necessitating robust security solutions designed for the unique constraints of OT environments. The Study Period of 2019–2033 forecasts a continued acceleration in market growth, driven by digital transformation initiatives, the expansion of 5G networks into industrial settings, and an increasing regulatory push for cybersecurity compliance in critical infrastructure. The adoption rate of dedicated OT security platforms is projected to exceed 70% of enterprises in key industrial sectors by 2030. The Estimated Year of 2025 sees the global OT security market valued at approximately $25 billion, with projections for the Forecast Period of 2025–2033 indicating a CAGR of 18.5%, potentially reaching over $100 billion by 2033. This sustained high growth reflects the persistent and evolving nature of threats and the critical role OT security plays in safeguarding national security and economic stability.
Leading Regions, Countries, or Segments in Operational Technology Security
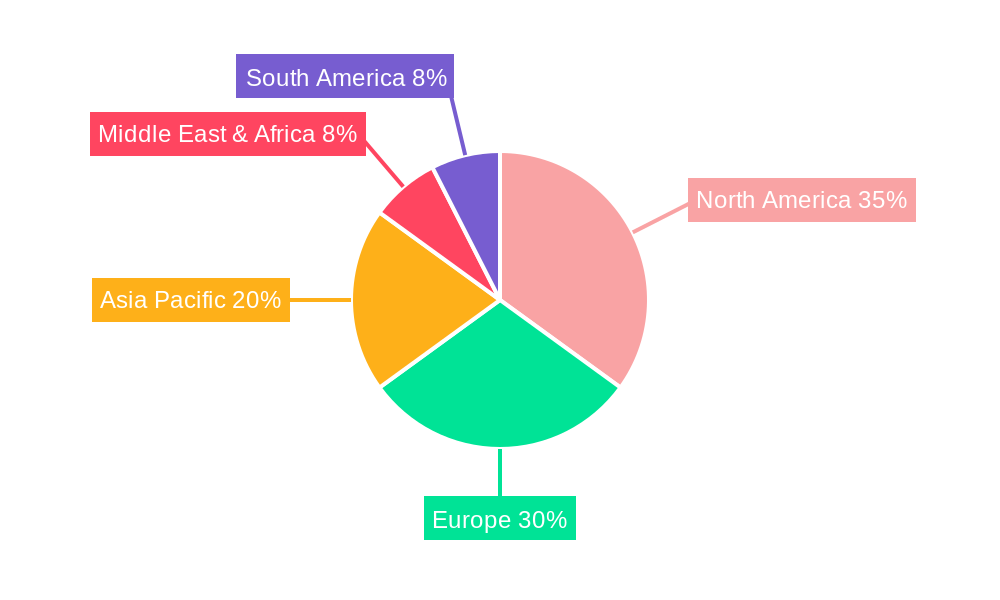
North America currently stands as the dominant region in the Operational Technology Security market, driven by a combination of factors including a highly industrialized economy, stringent regulatory frameworks, and significant investment in advanced cybersecurity technologies. The United States, in particular, leads due to substantial government initiatives and a high concentration of critical infrastructure sectors such as energy, manufacturing, and transportation, all of which are prime targets for cyber threats. The Application segment of Software is experiencing accelerated growth, fueled by the increasing adoption of cloud-based OT security platforms and advanced analytics solutions. Within the Type segment, Managed Security Services (MSS) are gaining substantial traction as organizations increasingly outsource their OT security monitoring and management to specialized providers who possess the expertise and resources to handle complex industrial environments. Investment trends in North America are robust, with projected annual investments in OT security solutions and services reaching $10 billion by 2026. Regulatory support is a key driver, with agencies like CISA actively promoting cybersecurity best practices and issuing guidelines for critical infrastructure protection.
- Dominant Application Segment: Software solutions, including endpoint detection and response (EDR) for OT, security information and event management (SIEM) tailored for industrial protocols, and vulnerability management platforms, are outpacing hardware solutions in terms of market penetration and growth rate, projected to capture 55% of the software segment by 2027.
- Dominant Type Segment: Managed Security Services (MSS) for OT are projected to grow at a CAGR of 20% during the forecast period, driven by the shortage of skilled OT cybersecurity professionals and the desire for continuous monitoring and rapid incident response capabilities. The MSS market in North America alone is estimated to reach $8 billion by 2028.
- Key Driver: Regulatory Support: The U.S. government's focus on securing critical infrastructure, exemplified by programs and mandates, has created a fertile ground for OT security investments, leading to an estimated 30% increase in spending by critical infrastructure entities in the last two years.
- Investment Trends: Private equity investment in OT security startups in North America has surged, with deals totaling over $1.5 billion in the past three years, indicating strong investor confidence in the sector's future.
Operational Technology Security Product Innovations
Product innovations in Operational Technology Security are rapidly evolving to address the unique challenges of industrial environments. Key advancements include the development of OT-native anomaly detection engines capable of understanding industrial protocols and discerning legitimate operational fluctuations from malicious activities. Next-generation firewalls and intrusion prevention systems are being designed with specialized firmware and hardware to withstand harsh industrial conditions and provide deep packet inspection for OT traffic. Furthermore, OT endpoint protection solutions are emerging, offering agent-based or agentless security for embedded systems and legacy devices that were not designed with security in mind. These innovations are crucial for industries relying on the stability and integrity of their operational systems. The application of AI and ML in these solutions enhances their ability to provide real-time threat intelligence and proactive risk mitigation, moving beyond reactive defense.
Propelling Factors for Operational Technology Security Growth
Several key factors are propelling the growth of the Operational Technology Security market. The escalating frequency and sophistication of cyberattacks targeting critical infrastructure and industrial control systems (ICS) are the primary drivers, forcing organizations to prioritize robust security measures. The rapid adoption of Industrial Internet of Things (IIoT) and the convergence of Information Technology (IT) and Operational Technology (OT) have expanded the attack surface, creating new vulnerabilities that require specialized security solutions. Furthermore, increasingly stringent government regulations and compliance mandates across various industries are compelling businesses to invest in OT security to avoid penalties and ensure operational continuity. The economic impact of a successful OT cyberattack, often measured in millions of dollars in downtime and reputational damage, further underscores the critical need for comprehensive OT security.
Obstacles in the Operational Technology Security Market
Despite robust growth, the Operational Technology Security market faces significant obstacles. One primary barrier is the inherent complexity of legacy OT systems, which were often designed without security in mind and are difficult to update or patch without disrupting operations. The shortage of skilled OT cybersecurity professionals is another major challenge, making it difficult for organizations to implement and manage effective security strategies. Supply chain disruptions, exacerbated by geopolitical events, can impact the availability and cost of specialized OT security hardware and software. Furthermore, the perceived high cost of implementing comprehensive OT security solutions can be a deterrent for some organizations, especially small and medium-sized enterprises. Competitive pressures from both established cybersecurity vendors and new specialized players can also lead to market fragmentation and price wars, impacting profitability for some.
Future Opportunities in Operational Technology Security
Emerging opportunities in Operational Technology Security are vast and driven by ongoing technological shifts and evolving threat landscapes. The expansion of 5G networks into industrial settings presents significant opportunities for real-time monitoring and control security solutions. The increasing demand for cloud-based OT security platforms, offering scalability and centralized management, is a major growth area. Furthermore, the growing focus on cybersecurity resilience and business continuity in the wake of major incidents is creating demand for advanced incident response and recovery services. The development of secure-by-design principles for new industrial equipment and the integration of OT security into the entire lifecycle of industrial assets represent significant long-term opportunities for innovation and market penetration. The growth of smart manufacturing and the digitization of critical infrastructure will continue to fuel demand for advanced OT security.
Major Players in the Operational Technology Security Ecosystem
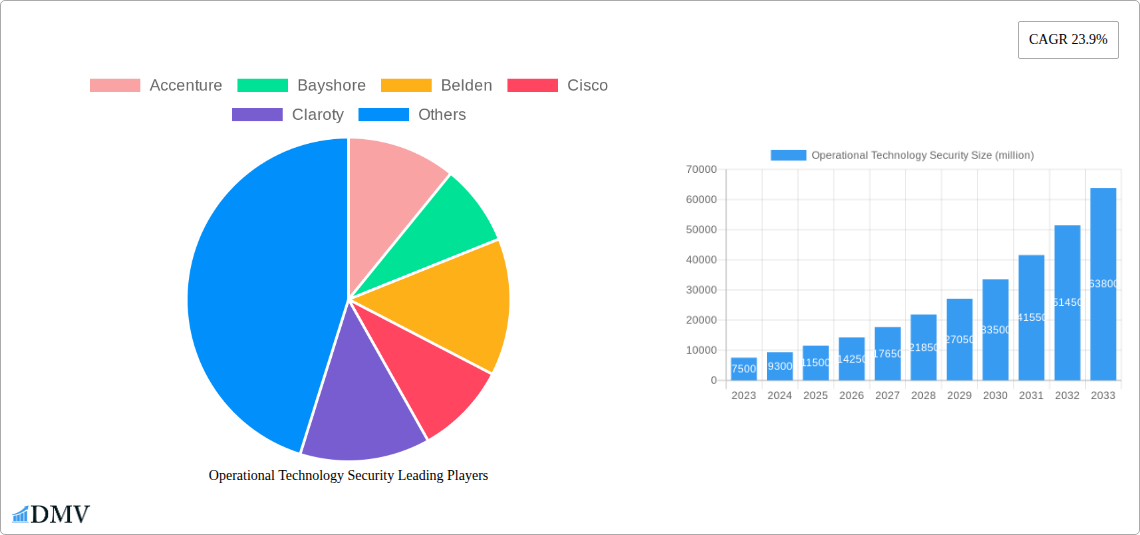
- Accenture
- Bayshore
- Belden
- Cisco
- Claroty
- CyberX
- Cyberbit
- Darktrace
- Deloitte
- Dragos
- GE (Wurldtech)
- Honeywell-Nextnine
- Icon Labs
- Indegy
- IOActive
- Kaspersky Lab
- Leidos
- NCC Group
Key Developments in Operational Technology Security Industry
- 2019, October: Claroty raises $60 million in Series B funding to expand its OT security platform.
- 2020, March: Dragos announces $110 million in Series C funding, further solidifying its position in OT threat intelligence.
- 2021, July: Cisco announces the acquisition of Kenna Security and the integration of its platform into Cisco's cybersecurity offerings, enhancing its vulnerability management capabilities which are crucial for OT environments.
- 2022, April: Darktrace launches its new "Industrial Immune System" capabilities, leveraging AI to detect and respond to threats in OT networks with unprecedented speed.
- 2023, September: Belden acquires Gridiron Cyber, a provider of OT cybersecurity solutions for the utility sector, expanding its reach in critical infrastructure protection.
- 2024, February: Accenture launches a new dedicated OT cybersecurity practice, signaling its strategic commitment to serving industrial clients.
- 2024, May: Honeywell announces a partnership with Microsoft to enhance cloud-based OT security for industrial operations.
Strategic Operational Technology Security Market Forecast
The Operational Technology Security market is poised for significant expansion, driven by a confluence of accelerating digital transformation in industrial sectors and the relentless evolution of cyber threats. The increasing interconnectivity of OT systems, coupled with the proliferation of IIoT devices, presents a widening attack surface that necessitates advanced and specialized security solutions. Regulatory mandates and a heightened awareness of the catastrophic consequences of OT breaches are compelling organizations to prioritize investment in robust cybersecurity frameworks. Key growth catalysts include the adoption of AI and machine learning for predictive threat detection, the demand for integrated IT/OT security platforms, and the expansion of managed security services tailored for industrial environments. The market is projected to witness a compound annual growth rate (CAGR) of approximately 18.5% from 2025 to 2033, signifying immense future opportunities for innovation and market leadership.
Operational Technology Security Segmentation
-
1. Application
- 1.1. Hardware
- 1.2. Software
-
2. Type
- 2.1. Consulting
- 2.2. Managed Security Services
Operational Technology Security Segmentation By Geography
-
1. North America
- 1.1. United States
- 1.2. Canada
- 1.3. Mexico
-
2. South America
- 2.1. Brazil
- 2.2. Argentina
- 2.3. Rest of South America
-
3. Europe
- 3.1. United Kingdom
- 3.2. Germany
- 3.3. France
- 3.4. Italy
- 3.5. Spain
- 3.6. Russia
- 3.7. Benelux
- 3.8. Nordics
- 3.9. Rest of Europe
-
4. Middle East & Africa
- 4.1. Turkey
- 4.2. Israel
- 4.3. GCC
- 4.4. North Africa
- 4.5. South Africa
- 4.6. Rest of Middle East & Africa
-
5. Asia Pacific
- 5.1. China
- 5.2. India
- 5.3. Japan
- 5.4. South Korea
- 5.5. ASEAN
- 5.6. Oceania
- 5.7. Rest of Asia Pacific
Operational Technology Security REPORT HIGHLIGHTS
| Aspects | Details |
|---|---|
| Study Period | 2019-2033 |
| Base Year | 2024 |
| Estimated Year | 2025 |
| Forecast Period | 2025-2033 |
| Historical Period | 2019-2024 |
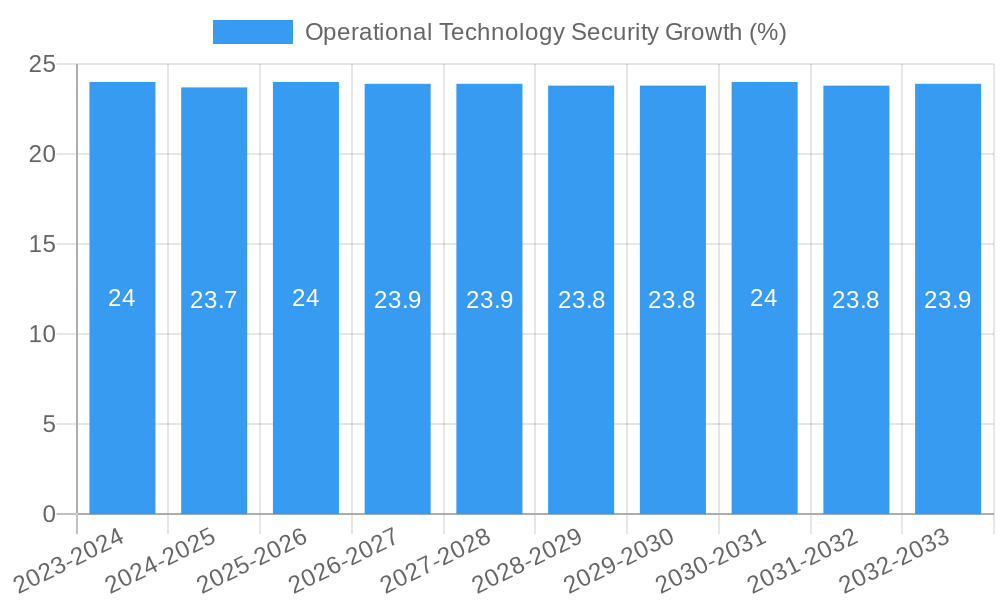
| Growth Rate | CAGR of 23.9% from 2019-2033 |
| Segmentation |
|
Table of Contents
- 1. Introduction
- 1.1. Research Scope
- 1.2. Market Segmentation
- 1.3. Research Methodology
- 1.4. Definitions and Assumptions
- 2. Executive Summary
- 2.1. Introduction
- 3. Market Dynamics
- 3.1. Introduction
- 3.2. Market Drivers
- 3.3. Market Restrains
- 3.4. Market Trends
- 4. Market Factor Analysis
- 4.1. Porters Five Forces
- 4.2. Supply/Value Chain
- 4.3. PESTEL analysis
- 4.4. Market Entropy
- 4.5. Patent/Trademark Analysis
- 5. Global Operational Technology Security Analysis, Insights and Forecast, 2019-2031
- 5.1. Market Analysis, Insights and Forecast - by Application
- 5.1.1. Hardware
- 5.1.2. Software
- 5.2. Market Analysis, Insights and Forecast - by Type
- 5.2.1. Consulting
- 5.2.2. Managed Security Services
- 5.3. Market Analysis, Insights and Forecast - by Region
- 5.3.1. North America
- 5.3.2. South America
- 5.3.3. Europe
- 5.3.4. Middle East & Africa
- 5.3.5. Asia Pacific
- 5.1. Market Analysis, Insights and Forecast - by Application
- 6. North America Operational Technology Security Analysis, Insights and Forecast, 2019-2031
- 6.1. Market Analysis, Insights and Forecast - by Application
- 6.1.1. Hardware
- 6.1.2. Software
- 6.2. Market Analysis, Insights and Forecast - by Type
- 6.2.1. Consulting
- 6.2.2. Managed Security Services
- 6.1. Market Analysis, Insights and Forecast - by Application
- 7. South America Operational Technology Security Analysis, Insights and Forecast, 2019-2031
- 7.1. Market Analysis, Insights and Forecast - by Application
- 7.1.1. Hardware
- 7.1.2. Software
- 7.2. Market Analysis, Insights and Forecast - by Type
- 7.2.1. Consulting
- 7.2.2. Managed Security Services
- 7.1. Market Analysis, Insights and Forecast - by Application
- 8. Europe Operational Technology Security Analysis, Insights and Forecast, 2019-2031
- 8.1. Market Analysis, Insights and Forecast - by Application
- 8.1.1. Hardware
- 8.1.2. Software
- 8.2. Market Analysis, Insights and Forecast - by Type
- 8.2.1. Consulting
- 8.2.2. Managed Security Services
- 8.1. Market Analysis, Insights and Forecast - by Application
- 9. Middle East & Africa Operational Technology Security Analysis, Insights and Forecast, 2019-2031
- 9.1. Market Analysis, Insights and Forecast - by Application
- 9.1.1. Hardware
- 9.1.2. Software
- 9.2. Market Analysis, Insights and Forecast - by Type
- 9.2.1. Consulting
- 9.2.2. Managed Security Services
- 9.1. Market Analysis, Insights and Forecast - by Application
- 10. Asia Pacific Operational Technology Security Analysis, Insights and Forecast, 2019-2031
- 10.1. Market Analysis, Insights and Forecast - by Application
- 10.1.1. Hardware
- 10.1.2. Software
- 10.2. Market Analysis, Insights and Forecast - by Type
- 10.2.1. Consulting
- 10.2.2. Managed Security Services
- 10.1. Market Analysis, Insights and Forecast - by Application
- 11. Competitive Analysis
- 11.1. Global Market Share Analysis 2024
- 11.2. Company Profiles
- 11.2.1 Accenture
- 11.2.1.1. Overview
- 11.2.1.2. Products
- 11.2.1.3. SWOT Analysis
- 11.2.1.4. Recent Developments
- 11.2.1.5. Financials (Based on Availability)
- 11.2.2 Bayshore
- 11.2.2.1. Overview
- 11.2.2.2. Products
- 11.2.2.3. SWOT Analysis
- 11.2.2.4. Recent Developments
- 11.2.2.5. Financials (Based on Availability)
- 11.2.3 Belden
- 11.2.3.1. Overview
- 11.2.3.2. Products
- 11.2.3.3. SWOT Analysis
- 11.2.3.4. Recent Developments
- 11.2.3.5. Financials (Based on Availability)
- 11.2.4 Cisco
- 11.2.4.1. Overview
- 11.2.4.2. Products
- 11.2.4.3. SWOT Analysis
- 11.2.4.4. Recent Developments
- 11.2.4.5. Financials (Based on Availability)
- 11.2.5 Claroty
- 11.2.5.1. Overview
- 11.2.5.2. Products
- 11.2.5.3. SWOT Analysis
- 11.2.5.4. Recent Developments
- 11.2.5.5. Financials (Based on Availability)
- 11.2.6 CyberX
- 11.2.6.1. Overview
- 11.2.6.2. Products
- 11.2.6.3. SWOT Analysis
- 11.2.6.4. Recent Developments
- 11.2.6.5. Financials (Based on Availability)
- 11.2.7 Cyberbit
- 11.2.7.1. Overview
- 11.2.7.2. Products
- 11.2.7.3. SWOT Analysis
- 11.2.7.4. Recent Developments
- 11.2.7.5. Financials (Based on Availability)
- 11.2.8 Darktrace
- 11.2.8.1. Overview
- 11.2.8.2. Products
- 11.2.8.3. SWOT Analysis
- 11.2.8.4. Recent Developments
- 11.2.8.5. Financials (Based on Availability)
- 11.2.9 Deloitte
- 11.2.9.1. Overview
- 11.2.9.2. Products
- 11.2.9.3. SWOT Analysis
- 11.2.9.4. Recent Developments
- 11.2.9.5. Financials (Based on Availability)
- 11.2.10 Dragos
- 11.2.10.1. Overview
- 11.2.10.2. Products
- 11.2.10.3. SWOT Analysis
- 11.2.10.4. Recent Developments
- 11.2.10.5. Financials (Based on Availability)
- 11.2.11 GE (Wurldtech)
- 11.2.11.1. Overview
- 11.2.11.2. Products
- 11.2.11.3. SWOT Analysis
- 11.2.11.4. Recent Developments
- 11.2.11.5. Financials (Based on Availability)
- 11.2.12 Honeywell-Nextnine
- 11.2.12.1. Overview
- 11.2.12.2. Products
- 11.2.12.3. SWOT Analysis
- 11.2.12.4. Recent Developments
- 11.2.12.5. Financials (Based on Availability)
- 11.2.13 Icon Labs
- 11.2.13.1. Overview
- 11.2.13.2. Products
- 11.2.13.3. SWOT Analysis
- 11.2.13.4. Recent Developments
- 11.2.13.5. Financials (Based on Availability)
- 11.2.14 Indegy
- 11.2.14.1. Overview
- 11.2.14.2. Products
- 11.2.14.3. SWOT Analysis
- 11.2.14.4. Recent Developments
- 11.2.14.5. Financials (Based on Availability)
- 11.2.15 IOActive
- 11.2.15.1. Overview
- 11.2.15.2. Products
- 11.2.15.3. SWOT Analysis
- 11.2.15.4. Recent Developments
- 11.2.15.5. Financials (Based on Availability)
- 11.2.16 Kaspersky Lab
- 11.2.16.1. Overview
- 11.2.16.2. Products
- 11.2.16.3. SWOT Analysis
- 11.2.16.4. Recent Developments
- 11.2.16.5. Financials (Based on Availability)
- 11.2.17 Leidos
- 11.2.17.1. Overview
- 11.2.17.2. Products
- 11.2.17.3. SWOT Analysis
- 11.2.17.4. Recent Developments
- 11.2.17.5. Financials (Based on Availability)
- 11.2.18 NCC Group
- 11.2.18.1. Overview
- 11.2.18.2. Products
- 11.2.18.3. SWOT Analysis
- 11.2.18.4. Recent Developments
- 11.2.18.5. Financials (Based on Availability)
- 11.2.1 Accenture
List of Figures
- Figure 1: Global Operational Technology Security Revenue Breakdown (million, %) by Region 2024 & 2032
- Figure 2: North America Operational Technology Security Revenue (million), by Application 2024 & 2032
- Figure 3: North America Operational Technology Security Revenue Share (%), by Application 2024 & 2032
- Figure 4: North America Operational Technology Security Revenue (million), by Type 2024 & 2032
- Figure 5: North America Operational Technology Security Revenue Share (%), by Type 2024 & 2032
- Figure 6: North America Operational Technology Security Revenue (million), by Country 2024 & 2032
- Figure 7: North America Operational Technology Security Revenue Share (%), by Country 2024 & 2032
- Figure 8: South America Operational Technology Security Revenue (million), by Application 2024 & 2032
- Figure 9: South America Operational Technology Security Revenue Share (%), by Application 2024 & 2032
- Figure 10: South America Operational Technology Security Revenue (million), by Type 2024 & 2032
- Figure 11: South America Operational Technology Security Revenue Share (%), by Type 2024 & 2032
- Figure 12: South America Operational Technology Security Revenue (million), by Country 2024 & 2032
- Figure 13: South America Operational Technology Security Revenue Share (%), by Country 2024 & 2032
- Figure 14: Europe Operational Technology Security Revenue (million), by Application 2024 & 2032
- Figure 15: Europe Operational Technology Security Revenue Share (%), by Application 2024 & 2032
- Figure 16: Europe Operational Technology Security Revenue (million), by Type 2024 & 2032
- Figure 17: Europe Operational Technology Security Revenue Share (%), by Type 2024 & 2032
- Figure 18: Europe Operational Technology Security Revenue (million), by Country 2024 & 2032
- Figure 19: Europe Operational Technology Security Revenue Share (%), by Country 2024 & 2032
- Figure 20: Middle East & Africa Operational Technology Security Revenue (million), by Application 2024 & 2032
- Figure 21: Middle East & Africa Operational Technology Security Revenue Share (%), by Application 2024 & 2032
- Figure 22: Middle East & Africa Operational Technology Security Revenue (million), by Type 2024 & 2032
- Figure 23: Middle East & Africa Operational Technology Security Revenue Share (%), by Type 2024 & 2032
- Figure 24: Middle East & Africa Operational Technology Security Revenue (million), by Country 2024 & 2032
- Figure 25: Middle East & Africa Operational Technology Security Revenue Share (%), by Country 2024 & 2032
- Figure 26: Asia Pacific Operational Technology Security Revenue (million), by Application 2024 & 2032
- Figure 27: Asia Pacific Operational Technology Security Revenue Share (%), by Application 2024 & 2032
- Figure 28: Asia Pacific Operational Technology Security Revenue (million), by Type 2024 & 2032
- Figure 29: Asia Pacific Operational Technology Security Revenue Share (%), by Type 2024 & 2032
- Figure 30: Asia Pacific Operational Technology Security Revenue (million), by Country 2024 & 2032
- Figure 31: Asia Pacific Operational Technology Security Revenue Share (%), by Country 2024 & 2032
List of Tables
- Table 1: Global Operational Technology Security Revenue million Forecast, by Region 2019 & 2032
- Table 2: Global Operational Technology Security Revenue million Forecast, by Application 2019 & 2032
- Table 3: Global Operational Technology Security Revenue million Forecast, by Type 2019 & 2032
- Table 4: Global Operational Technology Security Revenue million Forecast, by Region 2019 & 2032
- Table 5: Global Operational Technology Security Revenue million Forecast, by Application 2019 & 2032
- Table 6: Global Operational Technology Security Revenue million Forecast, by Type 2019 & 2032
- Table 7: Global Operational Technology Security Revenue million Forecast, by Country 2019 & 2032
- Table 8: United States Operational Technology Security Revenue (million) Forecast, by Application 2019 & 2032
- Table 9: Canada Operational Technology Security Revenue (million) Forecast, by Application 2019 & 2032
- Table 10: Mexico Operational Technology Security Revenue (million) Forecast, by Application 2019 & 2032
- Table 11: Global Operational Technology Security Revenue million Forecast, by Application 2019 & 2032
- Table 12: Global Operational Technology Security Revenue million Forecast, by Type 2019 & 2032
- Table 13: Global Operational Technology Security Revenue million Forecast, by Country 2019 & 2032
- Table 14: Brazil Operational Technology Security Revenue (million) Forecast, by Application 2019 & 2032
- Table 15: Argentina Operational Technology Security Revenue (million) Forecast, by Application 2019 & 2032
- Table 16: Rest of South America Operational Technology Security Revenue (million) Forecast, by Application 2019 & 2032
- Table 17: Global Operational Technology Security Revenue million Forecast, by Application 2019 & 2032
- Table 18: Global Operational Technology Security Revenue million Forecast, by Type 2019 & 2032
- Table 19: Global Operational Technology Security Revenue million Forecast, by Country 2019 & 2032
- Table 20: United Kingdom Operational Technology Security Revenue (million) Forecast, by Application 2019 & 2032
- Table 21: Germany Operational Technology Security Revenue (million) Forecast, by Application 2019 & 2032
- Table 22: France Operational Technology Security Revenue (million) Forecast, by Application 2019 & 2032
- Table 23: Italy Operational Technology Security Revenue (million) Forecast, by Application 2019 & 2032
- Table 24: Spain Operational Technology Security Revenue (million) Forecast, by Application 2019 & 2032
- Table 25: Russia Operational Technology Security Revenue (million) Forecast, by Application 2019 & 2032
- Table 26: Benelux Operational Technology Security Revenue (million) Forecast, by Application 2019 & 2032
- Table 27: Nordics Operational Technology Security Revenue (million) Forecast, by Application 2019 & 2032
- Table 28: Rest of Europe Operational Technology Security Revenue (million) Forecast, by Application 2019 & 2032
- Table 29: Global Operational Technology Security Revenue million Forecast, by Application 2019 & 2032
- Table 30: Global Operational Technology Security Revenue million Forecast, by Type 2019 & 2032
- Table 31: Global Operational Technology Security Revenue million Forecast, by Country 2019 & 2032
- Table 32: Turkey Operational Technology Security Revenue (million) Forecast, by Application 2019 & 2032
- Table 33: Israel Operational Technology Security Revenue (million) Forecast, by Application 2019 & 2032
- Table 34: GCC Operational Technology Security Revenue (million) Forecast, by Application 2019 & 2032
- Table 35: North Africa Operational Technology Security Revenue (million) Forecast, by Application 2019 & 2032
- Table 36: South Africa Operational Technology Security Revenue (million) Forecast, by Application 2019 & 2032
- Table 37: Rest of Middle East & Africa Operational Technology Security Revenue (million) Forecast, by Application 2019 & 2032
- Table 38: Global Operational Technology Security Revenue million Forecast, by Application 2019 & 2032
- Table 39: Global Operational Technology Security Revenue million Forecast, by Type 2019 & 2032
- Table 40: Global Operational Technology Security Revenue million Forecast, by Country 2019 & 2032
- Table 41: China Operational Technology Security Revenue (million) Forecast, by Application 2019 & 2032
- Table 42: India Operational Technology Security Revenue (million) Forecast, by Application 2019 & 2032
- Table 43: Japan Operational Technology Security Revenue (million) Forecast, by Application 2019 & 2032
- Table 44: South Korea Operational Technology Security Revenue (million) Forecast, by Application 2019 & 2032
- Table 45: ASEAN Operational Technology Security Revenue (million) Forecast, by Application 2019 & 2032
- Table 46: Oceania Operational Technology Security Revenue (million) Forecast, by Application 2019 & 2032
- Table 47: Rest of Asia Pacific Operational Technology Security Revenue (million) Forecast, by Application 2019 & 2032
Frequently Asked Questions
1. What is the projected Compound Annual Growth Rate (CAGR) of the Operational Technology Security?
The projected CAGR is approximately 23.9%.
2. Which companies are prominent players in the Operational Technology Security?
Key companies in the market include Accenture, Bayshore, Belden, Cisco, Claroty, CyberX, Cyberbit, Darktrace, Deloitte, Dragos, GE (Wurldtech), Honeywell-Nextnine, Icon Labs, Indegy, IOActive, Kaspersky Lab, Leidos, NCC Group.
3. What are the main segments of the Operational Technology Security?
The market segments include Application, Type.
4. Can you provide details about the market size?
The market size is estimated to be USD 2023 million as of 2022.
5. What are some drivers contributing to market growth?
N/A
6. What are the notable trends driving market growth?
N/A
7. Are there any restraints impacting market growth?
N/A
8. Can you provide examples of recent developments in the market?
N/A
9. What pricing options are available for accessing the report?
Pricing options include single-user, multi-user, and enterprise licenses priced at USD 4250.00, USD 6375.00, and USD 8500.00 respectively.
10. Is the market size provided in terms of value or volume?
The market size is provided in terms of value, measured in million.
11. Are there any specific market keywords associated with the report?
Yes, the market keyword associated with the report is "Operational Technology Security," which aids in identifying and referencing the specific market segment covered.
12. How do I determine which pricing option suits my needs best?
The pricing options vary based on user requirements and access needs. Individual users may opt for single-user licenses, while businesses requiring broader access may choose multi-user or enterprise licenses for cost-effective access to the report.
13. Are there any additional resources or data provided in the Operational Technology Security report?
While the report offers comprehensive insights, it's advisable to review the specific contents or supplementary materials provided to ascertain if additional resources or data are available.
14. How can I stay updated on further developments or reports in the Operational Technology Security?
To stay informed about further developments, trends, and reports in the Operational Technology Security, consider subscribing to industry newsletters, following relevant companies and organizations, or regularly checking reputable industry news sources and publications.
Methodology
Step 1 - Identification of Relevant Samples Size from Population Database


Step 2 - Approaches for Defining Global Market Size (Value, Volume* & Price*)

Note*: In applicable scenarios
Step 3 - Data Sources
Primary Research
- Web Analytics
- Survey Reports
- Research Institute
- Latest Research Reports
- Opinion Leaders
Secondary Research
- Annual Reports
- White Paper
- Latest Press Release
- Industry Association
- Paid Database
- Investor Presentations

Step 4 - Data Triangulation
Involves using different sources of information in order to increase the validity of a study
These sources are likely to be stakeholders in a program - participants, other researchers, program staff, other community members, and so on.
Then we put all data in single framework & apply various statistical tools to find out the dynamic on the market.
During the analysis stage, feedback from the stakeholder groups would be compared to determine areas of agreement as well as areas of divergence
