

Key Insights
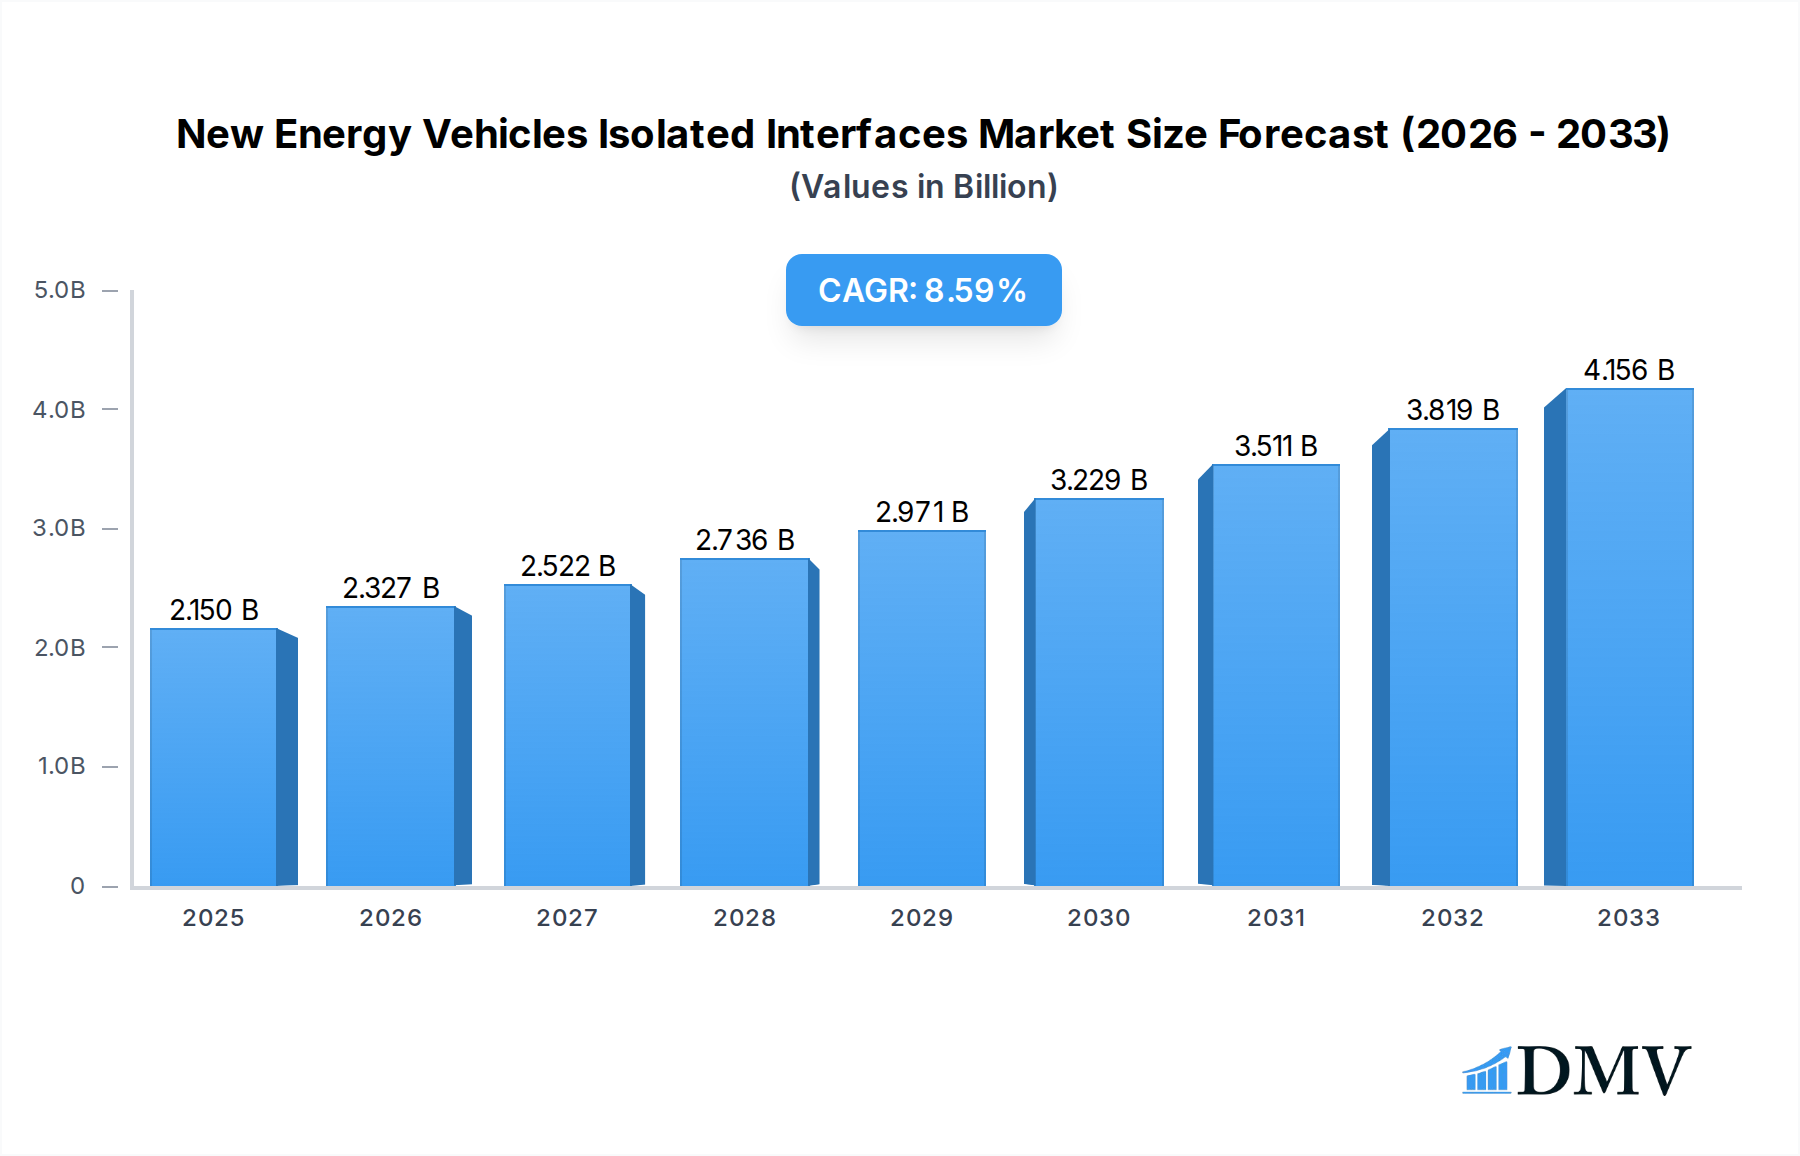
The New Energy Vehicles (NEVs) Isolated Interfaces market is poised for significant expansion, driven by the accelerating global transition towards sustainable transportation. Valued at an estimated $2.15 billion in 2025, the market is projected to witness robust growth at a Compound Annual Growth Rate (CAGR) of 8.2% throughout the forecast period extending to 2033. This impressive trajectory is primarily fueled by the increasing demand for enhanced safety, reliability, and electromagnetic compatibility (EMC) in electric and hybrid vehicles. As battery voltages rise and the complexity of automotive electronic systems grows, the need for effective galvanic isolation between different circuits becomes paramount. This isolation is critical for protecting sensitive control units from high voltages, preventing ground loops, and ensuring the seamless communication of data across various vehicle subsystems, including powertrains, battery management systems (BMS), and infotainment. The growing adoption of advanced driver-assistance systems (ADAS) and the increasing integration of connectivity features further amplify the demand for reliable isolated interfaces.

New Energy Vehicles Isolated Interfaces Market Size (In Billion)
The market's growth is further propelled by advancements in semiconductor technology, leading to the development of more compact, efficient, and cost-effective isolated interface solutions. Key drivers include stringent automotive safety regulations, the continuous innovation in electric vehicle architecture, and the expanding production volumes of NEVs worldwide. The market is segmented across various applications, with Commercial Vehicles and Passenger Vehicles representing the dominant segments due to their substantial market share in the automotive industry. On the technology front, Isolated RS-485 Transceiver and Isolated CAN Transceiver segments are expected to see substantial uptake, aligning with the communication protocols prevalent in automotive networks. Companies like ADI, Texas Instruments, and Infineon Technologies AG are at the forefront, investing heavily in research and development to capture this burgeoning market. Emerging economies, particularly in the Asia Pacific region, are anticipated to be significant growth hubs, supported by government initiatives promoting EV adoption and substantial investments in local manufacturing capabilities.
New Energy Vehicles Isolated Interfaces Company Market Share
New Energy Vehicles Isolated Interfaces Market: A Comprehensive Analysis
This in-depth report provides a crucial understanding of the New Energy Vehicles (NEV) Isolated Interfaces market, offering unparalleled insights for stakeholders, investors, and industry professionals. Spanning a study period from 2019 to 2033, with a base and estimated year of 2025 and a forecast period from 2025 to 2033, this analysis delves into the intricate composition, evolution, and future trajectory of this vital sector. We meticulously examine market drivers, challenges, innovations, and the competitive landscape, leveraging billions in predicted market values to illustrate the scale and potential of this burgeoning industry.
New Energy Vehicles Isolated Interfaces Market Composition & Trends
The New Energy Vehicles Isolated Interfaces market exhibits a dynamic and evolving composition, driven by the rapid expansion of the electric vehicle sector and the increasing demand for robust and reliable in-vehicle communication systems. Market concentration is notably influenced by the strategic investments and product portfolios of key players such as ADI, Texas Instruments, Infineon Technologies AG, NXP Semiconductors, Shanghai Chipanalog Microelectronics, NOVOSENSE, Renesas, NVE, 2Pai Semiconductor, Silicon Internet of Things Technology, Guangzhou Zhiyuan Electronics, and UOTEK. Innovation catalysts are primarily centered around enhanced electromagnetic compatibility (EMC), higher integration levels, and improved thermal management for isolated interfaces. The regulatory landscape, driven by stringent safety and emissions standards for NEVs globally, is a significant factor shaping product development and market entry. Substitute products, while emerging in some niche areas, are yet to pose a substantial threat to the established isolated interface solutions, particularly for critical safety systems. End-user profiles are diverse, encompassing both passenger vehicles and commercial vehicles, each with distinct performance and reliability requirements. Mergers and acquisitions (M&A) activities are on the rise, with reported deal values in the billions, indicating a consolidation trend as companies seek to expand their technological capabilities and market reach.
- Market Share Distribution: Dominated by a few key players with significant R&D investments.
- Innovation Focus: High-speed data transfer, miniaturization, and power efficiency.
- Regulatory Impact: Increasing emphasis on functional safety (ISO 26262) compliance.
- End-User Segmentation: Growing demand from both premium and mass-market NEV segments.
- M&A Trends: Strategic acquisitions to gain access to patented technologies and customer bases, with estimated deal values in the billions.
New Energy Vehicles Isolated Interfaces Industry Evolution
The New Energy Vehicles Isolated Interfaces industry has undergone a profound evolution, mirroring the transformative shift in the automotive sector towards electrification. From 2019 to the present, we have witnessed a consistent and accelerating market growth trajectory, fueled by government incentives, declining battery costs, and growing consumer awareness of environmental concerns. Technological advancements have been relentless, with the introduction of more sophisticated isolation technologies, including capacitive and magnetic isolation, offering improved performance in terms of speed, power consumption, and noise immunity. Consumer demands have also played a pivotal role, with a rising preference for advanced features, enhanced safety, and seamless connectivity within vehicles, all of which necessitate reliable and robust isolated interfaces for critical systems like battery management systems (BMS), powertrain control, and infotainment. Adoption metrics for NEVs have soared, directly translating into a proportional increase in the demand for these specialized components. The market has seen a CAGR of approximately 15% over the historical period, driven by the exponential growth in NEV sales. As NEV penetration continues to rise, projected to reach over 50% of new vehicle sales by 2033, the demand for isolated interfaces is expected to maintain a strong growth momentum, with an estimated compound annual growth rate (CAGR) of 18% projected for the forecast period. This growth is intrinsically linked to the increasing complexity of NEV architectures, the proliferation of sensors and control units, and the paramount importance of electrical isolation for preventing ground loops, mitigating noise, and ensuring the safety and reliability of high-voltage systems. The industry is moving towards higher levels of integration, with companies developing mixed-signal ICs that incorporate isolation as a core function, thereby reducing component count, saving space, and lowering overall system costs. Furthermore, the development of smaller form factors and improved thermal performance of isolated interfaces is crucial for their integration into increasingly compact and power-dense NEV designs. The sustained focus on research and development by leading semiconductor manufacturers, including ADI, Texas Instruments, Infineon Technologies AG, and NXP Semiconductors, has been instrumental in driving this evolution, introducing innovative solutions that meet the stringent requirements of the automotive industry.
Leading Regions, Countries, or Segments in New Energy Vehicles Isolated Interfaces
The New Energy Vehicles Isolated Interfaces market's dominance is intricately linked to the global leadership in New Energy Vehicle production and adoption. Asia-Pacific, particularly China, has emerged as the leading region, driven by aggressive government policies, substantial domestic demand, and a robust manufacturing ecosystem for both electric vehicles and their components. This dominance is further solidified by the presence of key Chinese players like Shanghai Chipanalog Microelectronics and NOVOSENSE, alongside significant operations of global manufacturers catering to the vast local market. The Passenger Vehicles segment commands the largest share within the application domain, reflecting the higher volume of NEV sales in this category. Within the product type, Isolated CAN Transceivers have historically been, and continue to be, a dominant force, owing to the widespread adoption of the CAN bus protocol in automotive communication for its robustness and reliability. However, the increasing complexity of NEV powertrains and battery management systems is driving significant growth in Isolated I2C and other specialized isolated interfaces.
- Regional Dominance: Asia-Pacific (China) leads due to high NEV production and policy support.
- Key Drivers: Government subsidies, favorable regulations, and a vast consumer base.
- Investment Trends: Billions invested in local NEV manufacturing and component supply chains.
- Country-Specific Strength: China's unparalleled NEV market size directly translates to the highest demand for isolated interfaces, with an estimated market size in the billions.
- Application Segments:
- Passenger Vehicles: Account for the majority of demand due to higher sales volumes.
- Commercial Vehicles: Growing segment with increasing electrification, demanding highly robust solutions.
- Product Type Dominance:
- Isolated CAN Transceivers: Continue to be a cornerstone due to established automotive networks.
- Isolated I2C: Experiencing rapid growth, essential for battery management and sensor interfacing.
- Isolated RS-485 Transceiver: Finding applications in specific sub-systems requiring robust serial communication.
- Others: Encompasses emerging specialized interfaces for advanced powertrains and thermal management systems.
New Energy Vehicles Isolated Interfaces Product Innovations
Product innovations in New Energy Vehicles Isolated Interfaces are fundamentally enhancing the performance and reliability of NEV systems. Manufacturers are focusing on developing smaller, more integrated isolation solutions that offer higher bandwidth, lower power consumption, and superior electromagnetic interference (EMI) suppression. Key advancements include the integration of galvanic isolation directly within microcontrollers and sensors, reducing component count and board space. Novel magnetic and capacitive isolation technologies are enabling higher voltage isolation and faster data rates, crucial for advanced powertrain and battery management applications. Performance metrics such as increased common-mode transient immunity (CMTI) and reduced propagation delay are paramount for ensuring the safe and efficient operation of critical NEV functions, with products offering up to 150 Mbps data rates and 25 kV/µs CMTI.
Propelling Factors for New Energy Vehicles Isolated Interfaces Growth
The growth of the New Energy Vehicles Isolated Interfaces market is propelled by a confluence of powerful factors. The relentless expansion of the NEV market, driven by environmental concerns and government mandates, is the primary catalyst. Technological advancements in isolation techniques, leading to improved performance and cost-effectiveness, are making these components more accessible. Stringent automotive safety standards, particularly those related to functional safety and high-voltage isolation, necessitate the adoption of these specialized interfaces. Furthermore, the increasing complexity of NEV electrical architectures, with a proliferation of sensors, ECUs, and power electronics, creates a fundamental need for robust electrical isolation to prevent noise interference and ensure system integrity.
- NEV Market Expansion: Billions of dollars in investments are pouring into the EV sector.
- Technological Advancements: Improved isolation performance and integration reducing system costs.
- Regulatory Mandates: Growing emphasis on safety and reliability in automotive electronics.
- System Complexity: Increased number of ECUs and sensors in NEVs demand sophisticated isolation.
Obstacles in the New Energy Vehicles Isolated Interfaces Market
Despite the robust growth, the New Energy Vehicles Isolated Interfaces market faces several obstacles. Regulatory hurdles, particularly the varying and evolving safety standards across different regions, can create complexity for global manufacturers. Supply chain disruptions, exacerbated by geopolitical events and raw material shortages, can impact production timelines and costs, with potential impact in the billions of dollars annually. Intense competitive pressures among established players and emerging entrants drive down profit margins. Furthermore, the high cost of some advanced isolation technologies can be a deterrent for cost-sensitive applications. The need for rigorous qualification and validation processes in the automotive industry also adds to the development cycle and cost.
- Regulatory Fragmentation: Divergent safety standards across major automotive markets.
- Supply Chain Volatility: Potential for disruptions affecting component availability and pricing.
- Price Sensitivity: Balancing advanced features with cost-effectiveness for mass-market NEVs.
- Long Qualification Cycles: Extended timeframes for automotive component approval.
Future Opportunities in New Energy Vehicles Isolated Interfaces
The future for New Energy Vehicles Isolated Interfaces is brimming with opportunities. The increasing adoption of autonomous driving features and advanced driver-assistance systems (ADAS) will demand even more sophisticated and reliable isolated communication pathways for sensor data fusion and control. The electrification of heavy-duty vehicles and specialized industrial equipment presents new market frontiers. The development of next-generation battery technologies and advanced charging infrastructure will also require innovative isolation solutions. Furthermore, the integration of vehicle-to-everything (V2X) communication technologies will open up new avenues for robust and secure data transmission, where isolated interfaces will play a crucial role, potentially unlocking market opportunities valued in the billions.
- Autonomous Driving Integration: Enhanced isolation for safety-critical sensor networks.
- Electrification of New Segments: Expanding applications in heavy-duty and specialized vehicles.
- Advanced Battery & Charging Systems: Requirement for high-voltage and high-speed isolation.
- V2X Communication: Enabling secure and reliable external data exchange.
Major Players in the New Energy Vehicles Isolated Interfaces Ecosystem
- ADI
- Texas Instruments
- Infineon Technologies AG
- NXP Semiconductors
- Shanghai Chipanalog Microelectronics
- NOVOSENSE
- Renesas
- NVE
- 2Pai Semiconductor
- Silicon Internet of Things Technology
- Guangzhou Zhiyuan Electronics
- UOTEK
Key Developments in New Energy Vehicles Isolated Interfaces Industry
- 2023/05: Infineon Technologies AG launches a new family of high-performance isolated CAN transceivers with enhanced EMC capabilities for automotive applications.
- 2023/09: NXP Semiconductors announces the expansion of its S32K microcontroller platform, integrating advanced isolation features for NEV powertrain control.
- 2024/01: ADI introduces a next-generation isolated gate driver for SiC and GaN power devices, enabling higher efficiency and power density in NEV inverters.
- 2024/03: Shanghai Chipanalog Microelectronics showcases a new series of isolated I2C devices designed for robust battery management systems.
- 2024/06: Texas Instruments announces strategic partnerships to accelerate the development of integrated isolated interfaces for next-generation NEV architectures.
- 2025/01 (Estimated): NOVOSENSE is expected to release a novel multi-channel isolated interface solution targeting charging infrastructure.
Strategic New Energy Vehicles Isolated Interfaces Market Forecast
The strategic forecast for the New Energy Vehicles Isolated Interfaces market is exceptionally promising, driven by sustained global NEV adoption and continuous technological innovation. Future growth catalysts include the increasing demand for higher levels of autonomy, the electrification of commercial fleets, and the development of advanced vehicle-to-grid (V2G) capabilities. The market potential is further amplified by the ongoing pursuit of miniaturization and integration, leading to more cost-effective and space-saving solutions. With substantial investments projected in the coming years, estimated in the billions, the market is poised for significant expansion, presenting lucrative opportunities for stakeholders willing to invest in cutting-edge technologies and strategic market positioning.
New Energy Vehicles Isolated Interfaces Segmentation
-
1. Application
- 1.1. Commercial Vehicles
- 1.2. Passenger Vehicles
-
2. Type
- 2.1. Isolated I2C
- 2.2. Isolated RS-485 Transceiver
- 2.3. Isolated CAN Transceiver
- 2.4. Others
New Energy Vehicles Isolated Interfaces Segmentation By Geography
-
1. North America
- 1.1. United States
- 1.2. Canada
- 1.3. Mexico
-
2. South America
- 2.1. Brazil
- 2.2. Argentina
- 2.3. Rest of South America
-
3. Europe
- 3.1. United Kingdom
- 3.2. Germany
- 3.3. France
- 3.4. Italy
- 3.5. Spain
- 3.6. Russia
- 3.7. Benelux
- 3.8. Nordics
- 3.9. Rest of Europe
-
4. Middle East & Africa
- 4.1. Turkey
- 4.2. Israel
- 4.3. GCC
- 4.4. North Africa
- 4.5. South Africa
- 4.6. Rest of Middle East & Africa
-
5. Asia Pacific
- 5.1. China
- 5.2. India
- 5.3. Japan
- 5.4. South Korea
- 5.5. ASEAN
- 5.6. Oceania
- 5.7. Rest of Asia Pacific
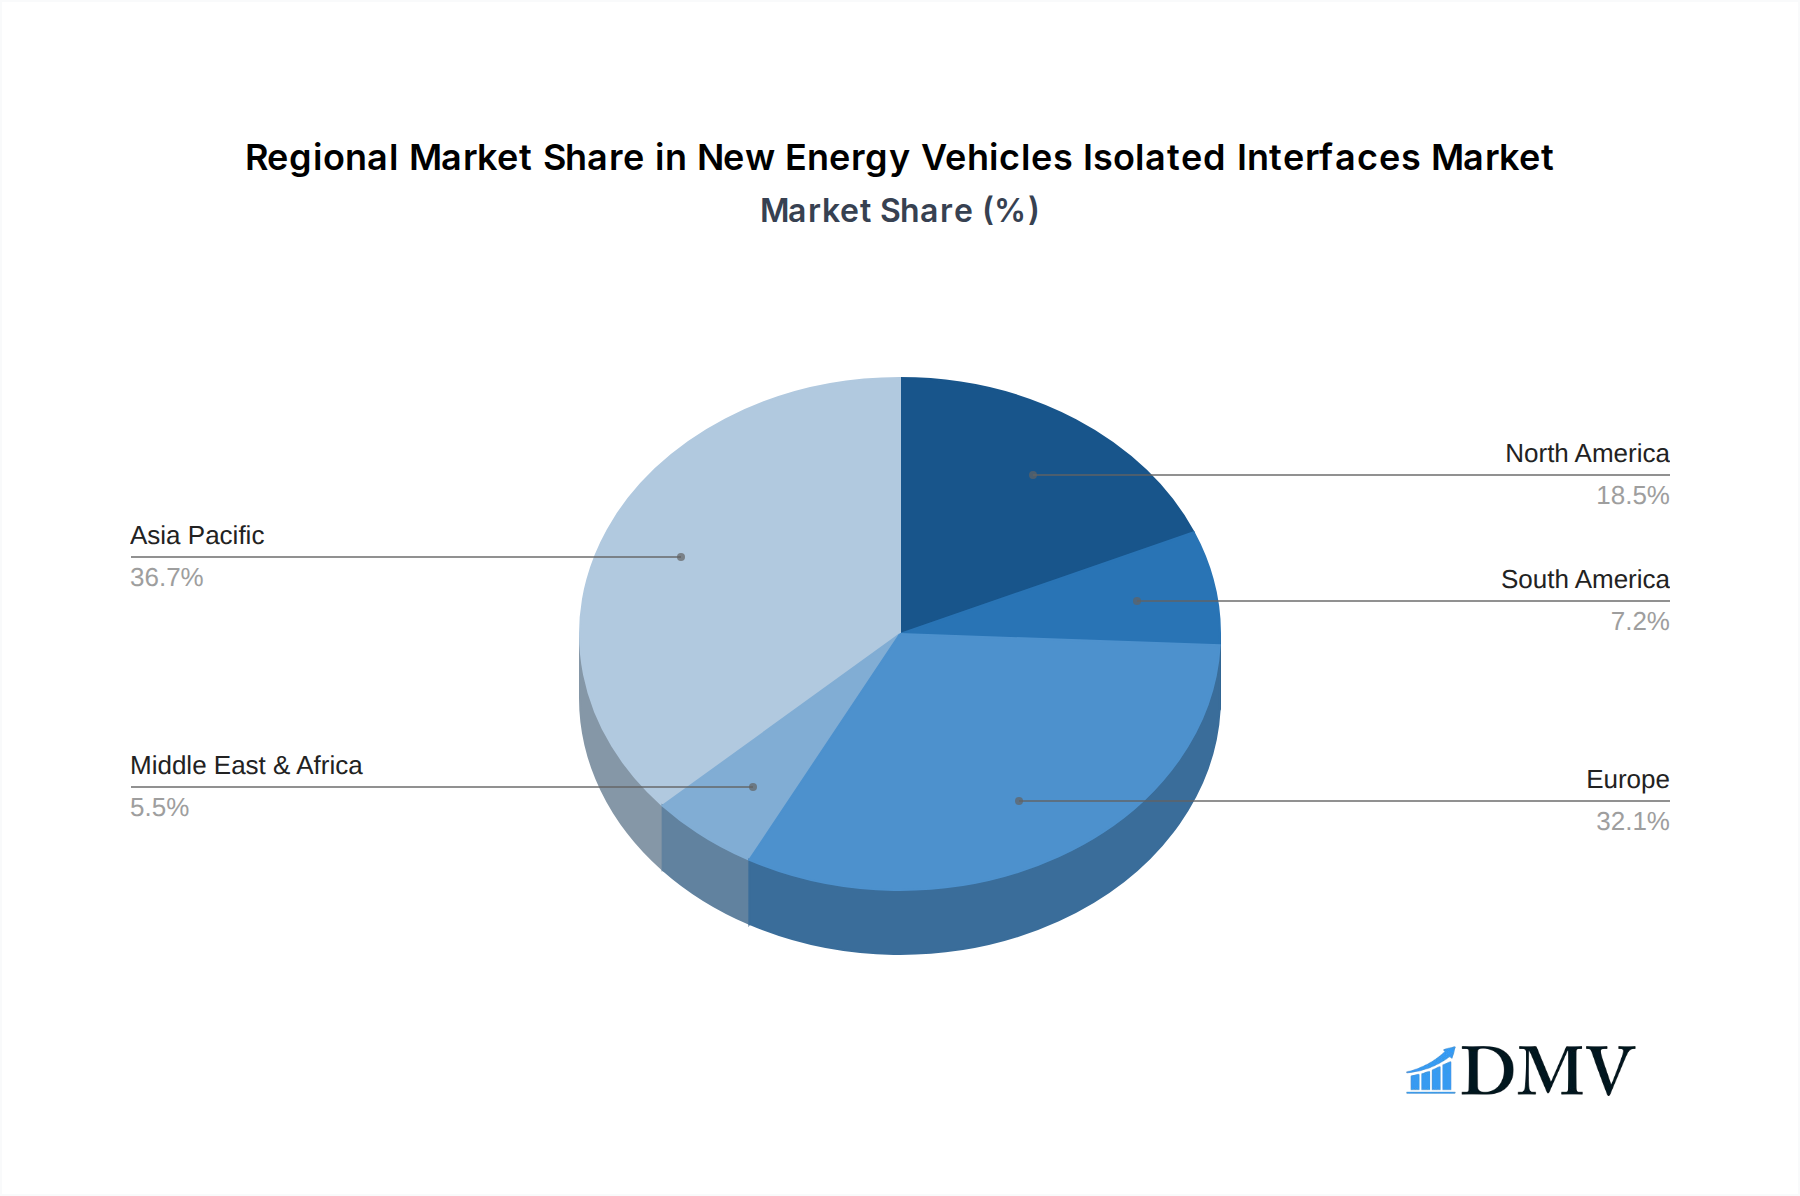
New Energy Vehicles Isolated Interfaces Regional Market Share
Geographic Coverage of New Energy Vehicles Isolated Interfaces
New Energy Vehicles Isolated Interfaces REPORT HIGHLIGHTS
| Aspects | Details |
|---|---|
| Study Period | 2020-2034 |
| Base Year | 2025 |
| Estimated Year | 2026 |
| Forecast Period | 2026-2034 |
| Historical Period | 2020-2025 |
| Growth Rate | CAGR of 8.2% from 2020-2034 |
| Segmentation |
|
Table of Contents
- 1. Introduction
- 1.1. Research Scope
- 1.2. Market Segmentation
- 1.3. Research Objective
- 1.4. Definitions and Assumptions
- 2. Executive Summary
- 2.1. Market Snapshot
- 3. Market Dynamics
- 3.1. Market Drivers
- 3.2. Market Restrains
- 3.3. Market Trends
- 3.4. Market Opportunities
- 4. Market Factor Analysis
- 4.1. Porters Five Forces
- 4.1.1. Bargaining Power of Suppliers
- 4.1.2. Bargaining Power of Buyers
- 4.1.3. Threat of New Entrants
- 4.1.4. Threat of Substitutes
- 4.1.5. Competitive Rivalry
- 4.2. PESTEL analysis
- 4.3. BCG Analysis
- 4.3.1. Stars (High Growth, High Market Share)
- 4.3.2. Cash Cows (Low Growth, High Market Share)
- 4.3.3. Question Mark (High Growth, Low Market Share)
- 4.3.4. Dogs (Low Growth, Low Market Share)
- 4.4. Ansoff Matrix Analysis
- 4.5. Supply Chain Analysis
- 4.6. Regulatory Landscape
- 4.7. Current Market Potential and Opportunity Assessment (TAM–SAM–SOM Framework)
- 4.8. DMV Analyst Note
- 4.1. Porters Five Forces
- 5. Market Analysis, Insights and Forecast 2021-2033
- 5.1. Market Analysis, Insights and Forecast - by Application
- 5.1.1. Commercial Vehicles
- 5.1.2. Passenger Vehicles
- 5.2. Market Analysis, Insights and Forecast - by Type
- 5.2.1. Isolated I2C
- 5.2.2. Isolated RS-485 Transceiver
- 5.2.3. Isolated CAN Transceiver
- 5.2.4. Others
- 5.3. Market Analysis, Insights and Forecast - by Region
- 5.3.1. North America
- 5.3.2. South America
- 5.3.3. Europe
- 5.3.4. Middle East & Africa
- 5.3.5. Asia Pacific
- 5.1. Market Analysis, Insights and Forecast - by Application
- 6. Global New Energy Vehicles Isolated Interfaces Analysis, Insights and Forecast, 2021-2033
- 6.1. Market Analysis, Insights and Forecast - by Application
- 6.1.1. Commercial Vehicles
- 6.1.2. Passenger Vehicles
- 6.2. Market Analysis, Insights and Forecast - by Type
- 6.2.1. Isolated I2C
- 6.2.2. Isolated RS-485 Transceiver
- 6.2.3. Isolated CAN Transceiver
- 6.2.4. Others
- 6.1. Market Analysis, Insights and Forecast - by Application
- 7. North America New Energy Vehicles Isolated Interfaces Analysis, Insights and Forecast, 2020-2032
- 7.1. Market Analysis, Insights and Forecast - by Application
- 7.1.1. Commercial Vehicles
- 7.1.2. Passenger Vehicles
- 7.2. Market Analysis, Insights and Forecast - by Type
- 7.2.1. Isolated I2C
- 7.2.2. Isolated RS-485 Transceiver
- 7.2.3. Isolated CAN Transceiver
- 7.2.4. Others
- 7.1. Market Analysis, Insights and Forecast - by Application
- 8. South America New Energy Vehicles Isolated Interfaces Analysis, Insights and Forecast, 2020-2032
- 8.1. Market Analysis, Insights and Forecast - by Application
- 8.1.1. Commercial Vehicles
- 8.1.2. Passenger Vehicles
- 8.2. Market Analysis, Insights and Forecast - by Type
- 8.2.1. Isolated I2C
- 8.2.2. Isolated RS-485 Transceiver
- 8.2.3. Isolated CAN Transceiver
- 8.2.4. Others
- 8.1. Market Analysis, Insights and Forecast - by Application
- 9. Europe New Energy Vehicles Isolated Interfaces Analysis, Insights and Forecast, 2020-2032
- 9.1. Market Analysis, Insights and Forecast - by Application
- 9.1.1. Commercial Vehicles
- 9.1.2. Passenger Vehicles
- 9.2. Market Analysis, Insights and Forecast - by Type
- 9.2.1. Isolated I2C
- 9.2.2. Isolated RS-485 Transceiver
- 9.2.3. Isolated CAN Transceiver
- 9.2.4. Others
- 9.1. Market Analysis, Insights and Forecast - by Application
- 10. Middle East & Africa New Energy Vehicles Isolated Interfaces Analysis, Insights and Forecast, 2020-2032
- 10.1. Market Analysis, Insights and Forecast - by Application
- 10.1.1. Commercial Vehicles
- 10.1.2. Passenger Vehicles
- 10.2. Market Analysis, Insights and Forecast - by Type
- 10.2.1. Isolated I2C
- 10.2.2. Isolated RS-485 Transceiver
- 10.2.3. Isolated CAN Transceiver
- 10.2.4. Others
- 10.1. Market Analysis, Insights and Forecast - by Application
- 11. Asia Pacific New Energy Vehicles Isolated Interfaces Analysis, Insights and Forecast, 2020-2032
- 11.1. Market Analysis, Insights and Forecast - by Application
- 11.1.1. Commercial Vehicles
- 11.1.2. Passenger Vehicles
- 11.2. Market Analysis, Insights and Forecast - by Type
- 11.2.1. Isolated I2C
- 11.2.2. Isolated RS-485 Transceiver
- 11.2.3. Isolated CAN Transceiver
- 11.2.4. Others
- 11.1. Market Analysis, Insights and Forecast - by Application
- 12. Competitive Analysis
- 12.1. Company Profiles
- 12.1.1 ADI
- 12.1.1.1. Company Overview
- 12.1.1.2. Products
- 12.1.1.3. Company Financials
- 12.1.1.4. SWOT Analysis
- 12.1.2 Texas Instruments
- 12.1.2.1. Company Overview
- 12.1.2.2. Products
- 12.1.2.3. Company Financials
- 12.1.2.4. SWOT Analysis
- 12.1.3 Infineon Technologies AG
- 12.1.3.1. Company Overview
- 12.1.3.2. Products
- 12.1.3.3. Company Financials
- 12.1.3.4. SWOT Analysis
- 12.1.4 NXP Semiconductors
- 12.1.4.1. Company Overview
- 12.1.4.2. Products
- 12.1.4.3. Company Financials
- 12.1.4.4. SWOT Analysis
- 12.1.5 Shanghai Chipanalog Microelectronics
- 12.1.5.1. Company Overview
- 12.1.5.2. Products
- 12.1.5.3. Company Financials
- 12.1.5.4. SWOT Analysis
- 12.1.6 NOVOSENSE
- 12.1.6.1. Company Overview
- 12.1.6.2. Products
- 12.1.6.3. Company Financials
- 12.1.6.4. SWOT Analysis
- 12.1.7 Renesas
- 12.1.7.1. Company Overview
- 12.1.7.2. Products
- 12.1.7.3. Company Financials
- 12.1.7.4. SWOT Analysis
- 12.1.8 NVE
- 12.1.8.1. Company Overview
- 12.1.8.2. Products
- 12.1.8.3. Company Financials
- 12.1.8.4. SWOT Analysis
- 12.1.9 2Pai Semiconductor
- 12.1.9.1. Company Overview
- 12.1.9.2. Products
- 12.1.9.3. Company Financials
- 12.1.9.4. SWOT Analysis
- 12.1.10 Silicon Internet of Things Technology
- 12.1.10.1. Company Overview
- 12.1.10.2. Products
- 12.1.10.3. Company Financials
- 12.1.10.4. SWOT Analysis
- 12.1.11 Guangzhou Zhiyuan Electronics
- 12.1.11.1. Company Overview
- 12.1.11.2. Products
- 12.1.11.3. Company Financials
- 12.1.11.4. SWOT Analysis
- 12.1.12 UOTEK
- 12.1.12.1. Company Overview
- 12.1.12.2. Products
- 12.1.12.3. Company Financials
- 12.1.12.4. SWOT Analysis
- 12.1.1 ADI
- 12.2. Market Entropy
- 12.2.1 Company's Key Areas Served
- 12.2.2 Recent Developments
- 12.3. Company Market Share Analysis 2025
- 12.3.1 Top 5 Companies Market Share Analysis
- 12.3.2 Top 3 Companies Market Share Analysis
- 12.4. List of Potential Customers
- 13. Research Methodology
List of Figures
- Figure 1: Global New Energy Vehicles Isolated Interfaces Revenue Breakdown (undefined, %) by Region 2025 & 2033
- Figure 2: North America New Energy Vehicles Isolated Interfaces Revenue (undefined), by Application 2025 & 2033
- Figure 3: North America New Energy Vehicles Isolated Interfaces Revenue Share (%), by Application 2025 & 2033
- Figure 4: North America New Energy Vehicles Isolated Interfaces Revenue (undefined), by Type 2025 & 2033
- Figure 5: North America New Energy Vehicles Isolated Interfaces Revenue Share (%), by Type 2025 & 2033
- Figure 6: North America New Energy Vehicles Isolated Interfaces Revenue (undefined), by Country 2025 & 2033
- Figure 7: North America New Energy Vehicles Isolated Interfaces Revenue Share (%), by Country 2025 & 2033
- Figure 8: South America New Energy Vehicles Isolated Interfaces Revenue (undefined), by Application 2025 & 2033
- Figure 9: South America New Energy Vehicles Isolated Interfaces Revenue Share (%), by Application 2025 & 2033
- Figure 10: South America New Energy Vehicles Isolated Interfaces Revenue (undefined), by Type 2025 & 2033
- Figure 11: South America New Energy Vehicles Isolated Interfaces Revenue Share (%), by Type 2025 & 2033
- Figure 12: South America New Energy Vehicles Isolated Interfaces Revenue (undefined), by Country 2025 & 2033
- Figure 13: South America New Energy Vehicles Isolated Interfaces Revenue Share (%), by Country 2025 & 2033
- Figure 14: Europe New Energy Vehicles Isolated Interfaces Revenue (undefined), by Application 2025 & 2033
- Figure 15: Europe New Energy Vehicles Isolated Interfaces Revenue Share (%), by Application 2025 & 2033
- Figure 16: Europe New Energy Vehicles Isolated Interfaces Revenue (undefined), by Type 2025 & 2033
- Figure 17: Europe New Energy Vehicles Isolated Interfaces Revenue Share (%), by Type 2025 & 2033
- Figure 18: Europe New Energy Vehicles Isolated Interfaces Revenue (undefined), by Country 2025 & 2033
- Figure 19: Europe New Energy Vehicles Isolated Interfaces Revenue Share (%), by Country 2025 & 2033
- Figure 20: Middle East & Africa New Energy Vehicles Isolated Interfaces Revenue (undefined), by Application 2025 & 2033
- Figure 21: Middle East & Africa New Energy Vehicles Isolated Interfaces Revenue Share (%), by Application 2025 & 2033
- Figure 22: Middle East & Africa New Energy Vehicles Isolated Interfaces Revenue (undefined), by Type 2025 & 2033
- Figure 23: Middle East & Africa New Energy Vehicles Isolated Interfaces Revenue Share (%), by Type 2025 & 2033
- Figure 24: Middle East & Africa New Energy Vehicles Isolated Interfaces Revenue (undefined), by Country 2025 & 2033
- Figure 25: Middle East & Africa New Energy Vehicles Isolated Interfaces Revenue Share (%), by Country 2025 & 2033
- Figure 26: Asia Pacific New Energy Vehicles Isolated Interfaces Revenue (undefined), by Application 2025 & 2033
- Figure 27: Asia Pacific New Energy Vehicles Isolated Interfaces Revenue Share (%), by Application 2025 & 2033
- Figure 28: Asia Pacific New Energy Vehicles Isolated Interfaces Revenue (undefined), by Type 2025 & 2033
- Figure 29: Asia Pacific New Energy Vehicles Isolated Interfaces Revenue Share (%), by Type 2025 & 2033
- Figure 30: Asia Pacific New Energy Vehicles Isolated Interfaces Revenue (undefined), by Country 2025 & 2033
- Figure 31: Asia Pacific New Energy Vehicles Isolated Interfaces Revenue Share (%), by Country 2025 & 2033
List of Tables
- Table 1: Global New Energy Vehicles Isolated Interfaces Revenue undefined Forecast, by Application 2020 & 2033
- Table 2: Global New Energy Vehicles Isolated Interfaces Revenue undefined Forecast, by Type 2020 & 2033
- Table 3: Global New Energy Vehicles Isolated Interfaces Revenue undefined Forecast, by Region 2020 & 2033
- Table 4: Global New Energy Vehicles Isolated Interfaces Revenue undefined Forecast, by Application 2020 & 2033
- Table 5: Global New Energy Vehicles Isolated Interfaces Revenue undefined Forecast, by Type 2020 & 2033
- Table 6: Global New Energy Vehicles Isolated Interfaces Revenue undefined Forecast, by Country 2020 & 2033
- Table 7: United States New Energy Vehicles Isolated Interfaces Revenue (undefined) Forecast, by Application 2020 & 2033
- Table 8: Canada New Energy Vehicles Isolated Interfaces Revenue (undefined) Forecast, by Application 2020 & 2033
- Table 9: Mexico New Energy Vehicles Isolated Interfaces Revenue (undefined) Forecast, by Application 2020 & 2033
- Table 10: Global New Energy Vehicles Isolated Interfaces Revenue undefined Forecast, by Application 2020 & 2033
- Table 11: Global New Energy Vehicles Isolated Interfaces Revenue undefined Forecast, by Type 2020 & 2033
- Table 12: Global New Energy Vehicles Isolated Interfaces Revenue undefined Forecast, by Country 2020 & 2033
- Table 13: Brazil New Energy Vehicles Isolated Interfaces Revenue (undefined) Forecast, by Application 2020 & 2033
- Table 14: Argentina New Energy Vehicles Isolated Interfaces Revenue (undefined) Forecast, by Application 2020 & 2033
- Table 15: Rest of South America New Energy Vehicles Isolated Interfaces Revenue (undefined) Forecast, by Application 2020 & 2033
- Table 16: Global New Energy Vehicles Isolated Interfaces Revenue undefined Forecast, by Application 2020 & 2033
- Table 17: Global New Energy Vehicles Isolated Interfaces Revenue undefined Forecast, by Type 2020 & 2033
- Table 18: Global New Energy Vehicles Isolated Interfaces Revenue undefined Forecast, by Country 2020 & 2033
- Table 19: United Kingdom New Energy Vehicles Isolated Interfaces Revenue (undefined) Forecast, by Application 2020 & 2033
- Table 20: Germany New Energy Vehicles Isolated Interfaces Revenue (undefined) Forecast, by Application 2020 & 2033
- Table 21: France New Energy Vehicles Isolated Interfaces Revenue (undefined) Forecast, by Application 2020 & 2033
- Table 22: Italy New Energy Vehicles Isolated Interfaces Revenue (undefined) Forecast, by Application 2020 & 2033
- Table 23: Spain New Energy Vehicles Isolated Interfaces Revenue (undefined) Forecast, by Application 2020 & 2033
- Table 24: Russia New Energy Vehicles Isolated Interfaces Revenue (undefined) Forecast, by Application 2020 & 2033
- Table 25: Benelux New Energy Vehicles Isolated Interfaces Revenue (undefined) Forecast, by Application 2020 & 2033
- Table 26: Nordics New Energy Vehicles Isolated Interfaces Revenue (undefined) Forecast, by Application 2020 & 2033
- Table 27: Rest of Europe New Energy Vehicles Isolated Interfaces Revenue (undefined) Forecast, by Application 2020 & 2033
- Table 28: Global New Energy Vehicles Isolated Interfaces Revenue undefined Forecast, by Application 2020 & 2033
- Table 29: Global New Energy Vehicles Isolated Interfaces Revenue undefined Forecast, by Type 2020 & 2033
- Table 30: Global New Energy Vehicles Isolated Interfaces Revenue undefined Forecast, by Country 2020 & 2033
- Table 31: Turkey New Energy Vehicles Isolated Interfaces Revenue (undefined) Forecast, by Application 2020 & 2033
- Table 32: Israel New Energy Vehicles Isolated Interfaces Revenue (undefined) Forecast, by Application 2020 & 2033
- Table 33: GCC New Energy Vehicles Isolated Interfaces Revenue (undefined) Forecast, by Application 2020 & 2033
- Table 34: North Africa New Energy Vehicles Isolated Interfaces Revenue (undefined) Forecast, by Application 2020 & 2033
- Table 35: South Africa New Energy Vehicles Isolated Interfaces Revenue (undefined) Forecast, by Application 2020 & 2033
- Table 36: Rest of Middle East & Africa New Energy Vehicles Isolated Interfaces Revenue (undefined) Forecast, by Application 2020 & 2033
- Table 37: Global New Energy Vehicles Isolated Interfaces Revenue undefined Forecast, by Application 2020 & 2033
- Table 38: Global New Energy Vehicles Isolated Interfaces Revenue undefined Forecast, by Type 2020 & 2033
- Table 39: Global New Energy Vehicles Isolated Interfaces Revenue undefined Forecast, by Country 2020 & 2033
- Table 40: China New Energy Vehicles Isolated Interfaces Revenue (undefined) Forecast, by Application 2020 & 2033
- Table 41: India New Energy Vehicles Isolated Interfaces Revenue (undefined) Forecast, by Application 2020 & 2033
- Table 42: Japan New Energy Vehicles Isolated Interfaces Revenue (undefined) Forecast, by Application 2020 & 2033
- Table 43: South Korea New Energy Vehicles Isolated Interfaces Revenue (undefined) Forecast, by Application 2020 & 2033
- Table 44: ASEAN New Energy Vehicles Isolated Interfaces Revenue (undefined) Forecast, by Application 2020 & 2033
- Table 45: Oceania New Energy Vehicles Isolated Interfaces Revenue (undefined) Forecast, by Application 2020 & 2033
- Table 46: Rest of Asia Pacific New Energy Vehicles Isolated Interfaces Revenue (undefined) Forecast, by Application 2020 & 2033
Frequently Asked Questions
1. What is the projected Compound Annual Growth Rate (CAGR) of the New Energy Vehicles Isolated Interfaces?
The projected CAGR is approximately 8.2%.
2. Which companies are prominent players in the New Energy Vehicles Isolated Interfaces?
Key companies in the market include ADI, Texas Instruments, Infineon Technologies AG, NXP Semiconductors, Shanghai Chipanalog Microelectronics, NOVOSENSE, Renesas, NVE, 2Pai Semiconductor, Silicon Internet of Things Technology, Guangzhou Zhiyuan Electronics, UOTEK.
3. What are the main segments of the New Energy Vehicles Isolated Interfaces?
The market segments include Application, Type.
4. Can you provide details about the market size?
The market size is estimated to be USD XXX N/A as of 2022.
5. What are some drivers contributing to market growth?
N/A
6. What are the notable trends driving market growth?
N/A
7. Are there any restraints impacting market growth?
N/A
8. Can you provide examples of recent developments in the market?
N/A
9. What pricing options are available for accessing the report?
Pricing options include single-user, multi-user, and enterprise licenses priced at USD 4250.00, USD 6375.00, and USD 8500.00 respectively.
10. Is the market size provided in terms of value or volume?
The market size is provided in terms of value, measured in N/A.
11. Are there any specific market keywords associated with the report?
Yes, the market keyword associated with the report is "New Energy Vehicles Isolated Interfaces," which aids in identifying and referencing the specific market segment covered.
12. How do I determine which pricing option suits my needs best?
The pricing options vary based on user requirements and access needs. Individual users may opt for single-user licenses, while businesses requiring broader access may choose multi-user or enterprise licenses for cost-effective access to the report.
13. Are there any additional resources or data provided in the New Energy Vehicles Isolated Interfaces report?
While the report offers comprehensive insights, it's advisable to review the specific contents or supplementary materials provided to ascertain if additional resources or data are available.
14. How can I stay updated on further developments or reports in the New Energy Vehicles Isolated Interfaces?
To stay informed about further developments, trends, and reports in the New Energy Vehicles Isolated Interfaces, consider subscribing to industry newsletters, following relevant companies and organizations, or regularly checking reputable industry news sources and publications.
Methodology
Step 1 - Identification of Relevant Samples Size from Population Database


Step 2 - Approaches for Defining Global Market Size (Value, Volume* & Price*)

Note*: In applicable scenarios
Step 3 - Data Sources
Primary Research
- Web Analytics
- Survey Reports
- Research Institute
- Latest Research Reports
- Opinion Leaders
Secondary Research
- Annual Reports
- White Paper
- Latest Press Release
- Industry Association
- Paid Database
- Investor Presentations

Step 4 - Data Triangulation
Involves using different sources of information in order to increase the validity of a study
These sources are likely to be stakeholders in a program - participants, other researchers, program staff, other community members, and so on.
Then we put all data in single framework & apply various statistical tools to find out the dynamic on the market.
During the analysis stage, feedback from the stakeholder groups would be compared to determine areas of agreement as well as areas of divergence