

Key Insights
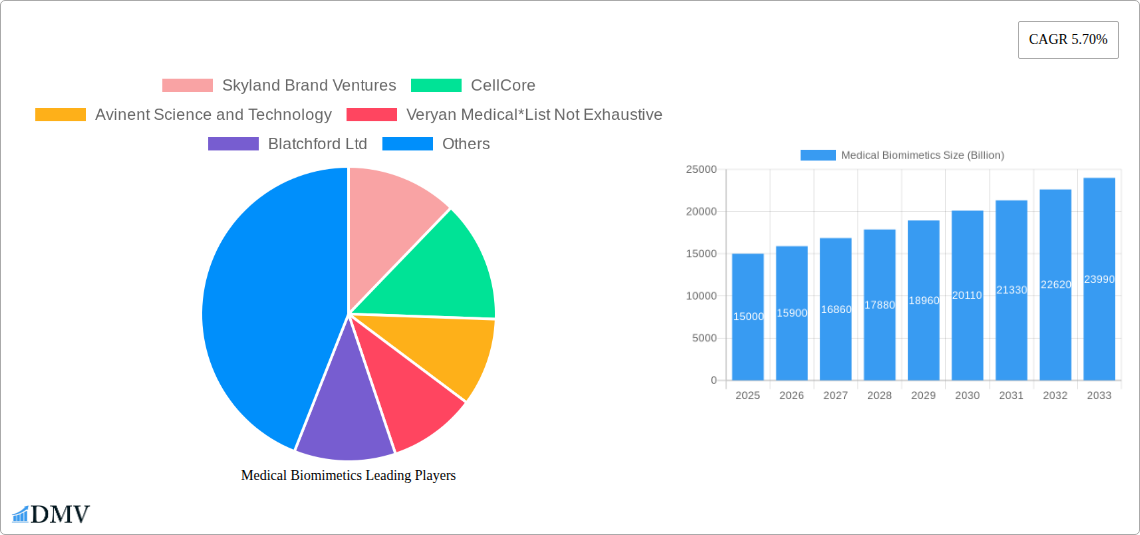
The global medical biomimetics market is experiencing robust growth, projected to reach a substantial size driven by several key factors. The 5.70% CAGR indicates a consistent upward trajectory, fueled by increasing demand for innovative and effective medical solutions. Advancements in biomaterials science and tissue engineering are creating sophisticated biomimetic implants and devices that offer superior performance compared to traditional methods. The orthopedic segment, a significant portion of the market, benefits from the development of biomimetic joint replacements offering enhanced biocompatibility and reduced risk of rejection. Ophthalmology and dental applications are also witnessing substantial growth due to the development of biomimetic lenses and dental implants that closely mimic natural tissues, improving patient outcomes and reducing recovery times. The rising prevalence of chronic diseases, such as osteoarthritis and age-related macular degeneration, further contributes to market expansion. Moreover, the increasing adoption of minimally invasive surgical procedures and the growing focus on personalized medicine are creating lucrative opportunities for medical biomimetics companies.
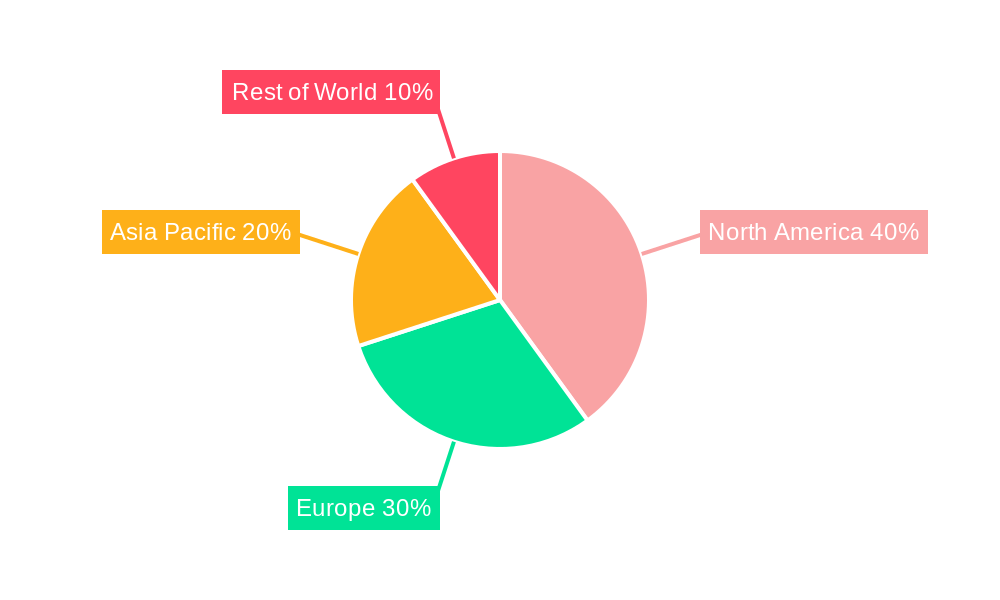
However, certain restraints affect market growth. The high cost associated with the development and manufacturing of biomimetic products can limit market penetration, particularly in developing countries. Stringent regulatory approvals and the need for extensive clinical trials before commercialization can also create challenges. Furthermore, the complexities involved in replicating the intricate functionalities of natural tissues and organs remain a key technical hurdle. Despite these challenges, the long-term outlook for the medical biomimetics market remains positive, driven by continuous technological advancements, increasing research and development investments, and the rising demand for improved patient care. The market is segmented by product type (orthopedic, ophthalmology, dental, others) and application (plastic surgery, wound healing, tissue engineering, others), offering diverse opportunities for players across various niches. North America and Europe currently hold the largest market shares due to well-established healthcare infrastructure and higher adoption rates of advanced medical technologies, while the Asia-Pacific region is anticipated to witness significant growth in the coming years driven by a rapidly expanding healthcare sector and rising disposable incomes.
Medical Biomimetics Market Report: A Billion-Dollar Growth Forecast (2019-2033)
This comprehensive report provides a detailed analysis of the global medical biomimetics market, projecting a multi-billion-dollar valuation by 2033. The study period covers 2019-2033, with 2025 as the base and estimated year. The forecast period spans 2025-2033, and the historical period encompasses 2019-2024. This in-depth analysis offers invaluable insights for stakeholders, investors, and industry players seeking to capitalize on the burgeoning opportunities within this transformative field.
Medical Biomimetics Market Composition & Trends
The global medical biomimetics market exhibits a moderately concentrated landscape, with key players such as Abbott, Blatchford Ltd, and Avinent Science and Technology holding significant market share. However, numerous smaller companies and research institutions, including CellCore, Veryan Medical, Applied Biomimetic, Biomimetic Solutions, SynTouch Inc, and Forschungszentrum Jülich, contribute significantly to innovation. The market share distribution in 2025 is estimated at approximately 40% for the top 5 players, with the remaining 60% dispersed among numerous smaller companies and emerging ventures. The market is driven by continuous technological advancements, particularly in materials science and nanotechnology. Regulatory landscapes vary across geographies, impacting market entry and product approvals. The substitution of traditional medical devices and materials with biomimetic alternatives is a key trend, further accelerated by the increasing demand for minimally invasive procedures and personalized medicine. Significant M&A activity is observed, with total deal value exceeding $xx billion in the historical period (2019-2024). Key acquisition targets include companies with strong intellectual property portfolios in novel biomaterials and advanced manufacturing techniques.
- Market Concentration: Moderately concentrated, with a significant presence of both large corporations and smaller innovative companies.
- Innovation Catalysts: Advancements in nanotechnology, materials science, and 3D printing.
- Regulatory Landscape: Varies geographically; impacting product approvals and market access.
- Substitute Products: Traditional medical devices and materials face increasing competition.
- End-User Profiles: Hospitals, clinics, research institutions, and individual surgeons.
- M&A Activity: Significant activity observed, with total deal value exceeding $xx billion (2019-2024).
Medical Biomimetics Industry Evolution
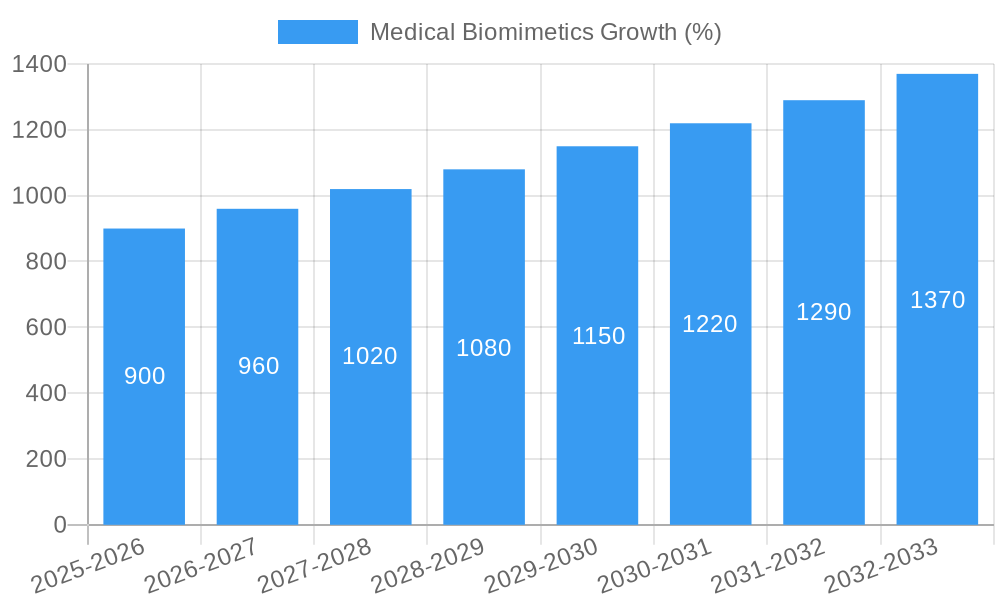
The medical biomimetics industry has witnessed exponential growth driven by the convergence of several key factors. Technological advancements, especially in biomaterial design and additive manufacturing, have enabled the creation of highly sophisticated and effective biomimetic implants, prosthetics, and tissue scaffolds. Consumer demand for improved outcomes, reduced recovery times, and enhanced patient comfort is fueling the adoption of biomimetic solutions. The market is expanding at a CAGR of xx% during the forecast period (2025-2033), reaching a projected valuation of $xx billion by 2033. This robust growth is further underpinned by increasing investments in research and development and favorable regulatory support in key regions. Adoption rates are particularly high in segments such as orthopedics and ophthalmology, driven by the success of biomimetic implants and regenerative medicine approaches. The increased prevalence of chronic diseases and the aging global population further contribute to the rising demand for biomimetic solutions.
Leading Regions, Countries, or Segments in Medical Biomimetics
The North American market currently dominates the global medical biomimetics landscape, driven by high levels of technological innovation, robust healthcare infrastructure, and substantial R&D investments. Europe follows as a significant market, with strong government support for medical technology development. The Asia-Pacific region exhibits substantial growth potential, spurred by rising disposable incomes and the increasing prevalence of chronic diseases.
Key Drivers:
- North America: High R&D investment, advanced healthcare infrastructure, favorable regulatory environment.
- Europe: Strong government support for medical technology, significant presence of research institutions.
- Asia-Pacific: Rising disposable incomes, increasing prevalence of chronic diseases, expanding healthcare sector.
Dominant Segments:
- Product Type: The orthopedic segment currently holds the largest market share, owing to the high success rates of biomimetic implants in joint replacements and fracture healing.
- Application: Tissue engineering applications are experiencing rapid growth, driven by the potential of biomimetic scaffolds to facilitate tissue regeneration.
Medical Biomimetics Product Innovations
Recent breakthroughs in medical biomimetics include the development of biocompatible and biodegradable materials that mimic the mechanical properties and biological functions of natural tissues. These innovations enable the creation of sophisticated implants, prosthetics, and tissue engineering scaffolds that offer superior performance and integration with the host body, thereby minimizing adverse reactions and maximizing clinical outcomes. Examples include self-healing biomaterials that regenerate naturally. The unique selling proposition of these products lies in their superior biocompatibility, enhanced functionality, and reduced invasiveness. These improvements translate to improved patient outcomes, reduced recovery times, and enhanced quality of life.
Propelling Factors for Medical Biomimetics Growth
Technological advancements in materials science, nanotechnology, and 3D printing are pivotal drivers. Economic factors such as rising healthcare expenditure and insurance coverage further boost the market. Favorable regulatory policies supporting innovation and faster approvals also play a crucial role. The increasing prevalence of chronic diseases like arthritis and the aging global population are important demographic drivers.
Obstacles in the Medical Biomimetics Market
Regulatory hurdles and stringent approval processes can delay product launches and increase development costs. Supply chain disruptions can impact the availability of specialized materials and components. High manufacturing costs can limit market accessibility, especially in developing regions. Intense competition from established medical device manufacturers can pose significant challenges.
Future Opportunities in Medical Biomimetics
Emerging opportunities include the development of personalized biomimetic implants, leveraging advanced imaging and AI for customized design and manufacturing. Expanding into new therapeutic areas, such as cardiovascular and neurological applications, presents significant growth potential. The development of smart biomaterials with integrated sensors for monitoring and drug delivery promises to revolutionize treatment modalities.
Major Players in the Medical Biomimetics Ecosystem
- Skyland Brand Ventures
- CellCore
- Avinent Science and Technology
- Veryan Medical
- Blatchford Ltd
- Applied Biomimetic
- Biomimetic Solutions
- SynTouch Inc
- Abbott
- Forschungszentrum Jülich
Key Developments in Medical Biomimetics Industry
- January 2023: Veryan Medical announced the successful completion of a clinical trial for its biomimetic heart valve.
- March 2022: Abbott launched a new line of biomimetic orthopedic implants.
- October 2021: Avinent Science and Technology acquired a company specializing in biomimetic dental materials.
- (Further significant developments will be detailed in the full report).
Strategic Medical Biomimetics Market Forecast
The medical biomimetics market is poised for sustained growth driven by the convergence of technological advancements, favorable regulatory policies, and increasing healthcare expenditure. New applications in personalized medicine and regenerative therapies will open up significant opportunities. The market is expected to experience robust expansion across all segments, with biomimetic implants and tissue engineering applications leading the way. The continued investment in R&D and the emergence of innovative materials will further propel market growth in the coming years.
Medical Biomimetics Segmentation
-
1. Product Type
- 1.1. Orthopedic
- 1.2. Ophthalmology
- 1.3. Dental
- 1.4. Others
-
2. Application
- 2.1. Plastic Surgery
- 2.2. Wound Healing
- 2.3. Tissue Engineering
- 2.4. Others
Medical Biomimetics Segmentation By Geography
-
1. North America
- 1.1. United States
- 1.2. Canada
- 1.3. Mexico
-
2. Europe
- 2.1. Germany
- 2.2. United Kingdom
- 2.3. France
- 2.4. Italy
- 2.5. Spain
- 2.6. Rest of Europe
-
3. Asia Pacific
- 3.1. China
- 3.2. Japan
- 3.3. India
- 3.4. Australia
- 3.5. South Korea
- 3.6. Rest of Asia Pacific
- 4. Rest of the World
Medical Biomimetics REPORT HIGHLIGHTS
| Aspects | Details |
|---|---|
| Study Period | 2019-2033 |
| Base Year | 2024 |
| Estimated Year | 2025 |
| Forecast Period | 2025-2033 |
| Historical Period | 2019-2024 |
| Growth Rate | CAGR of 5.70% from 2019-2033 |
| Segmentation |
|
Table of Contents
- 1. Introduction
- 1.1. Research Scope
- 1.2. Market Segmentation
- 1.3. Research Methodology
- 1.4. Definitions and Assumptions
- 2. Executive Summary
- 2.1. Introduction
- 3. Market Dynamics
- 3.1. Introduction
- 3.2. Market Drivers
- 3.2.1. ; Growing Advancement in Nanotechnology; Growing Tissue Engineering Market
- 3.3. Market Restrains
- 3.3.1. Stringent Regulatory Framework
- 3.4. Market Trends
- 3.4.1. Orthopaedic is Expected to Exhibit a Significant Growth Over the Forecast Period
- 4. Market Factor Analysis
- 4.1. Porters Five Forces
- 4.2. Supply/Value Chain
- 4.3. PESTEL analysis
- 4.4. Market Entropy
- 4.5. Patent/Trademark Analysis
- 5. Global Medical Biomimetics Analysis, Insights and Forecast, 2019-2031
- 5.1. Market Analysis, Insights and Forecast - by Product Type
- 5.1.1. Orthopedic
- 5.1.2. Ophthalmology
- 5.1.3. Dental
- 5.1.4. Others
- 5.2. Market Analysis, Insights and Forecast - by Application
- 5.2.1. Plastic Surgery
- 5.2.2. Wound Healing
- 5.2.3. Tissue Engineering
- 5.2.4. Others
- 5.3. Market Analysis, Insights and Forecast - by Region
- 5.3.1. North America
- 5.3.2. Europe
- 5.3.3. Asia Pacific
- 5.3.4. Rest of the World
- 5.1. Market Analysis, Insights and Forecast - by Product Type
- 6. North America Medical Biomimetics Analysis, Insights and Forecast, 2019-2031
- 6.1. Market Analysis, Insights and Forecast - by Product Type
- 6.1.1. Orthopedic
- 6.1.2. Ophthalmology
- 6.1.3. Dental
- 6.1.4. Others
- 6.2. Market Analysis, Insights and Forecast - by Application
- 6.2.1. Plastic Surgery
- 6.2.2. Wound Healing
- 6.2.3. Tissue Engineering
- 6.2.4. Others
- 6.1. Market Analysis, Insights and Forecast - by Product Type
- 7. Europe Medical Biomimetics Analysis, Insights and Forecast, 2019-2031
- 7.1. Market Analysis, Insights and Forecast - by Product Type
- 7.1.1. Orthopedic
- 7.1.2. Ophthalmology
- 7.1.3. Dental
- 7.1.4. Others
- 7.2. Market Analysis, Insights and Forecast - by Application
- 7.2.1. Plastic Surgery
- 7.2.2. Wound Healing
- 7.2.3. Tissue Engineering
- 7.2.4. Others
- 7.1. Market Analysis, Insights and Forecast - by Product Type
- 8. Asia Pacific Medical Biomimetics Analysis, Insights and Forecast, 2019-2031
- 8.1. Market Analysis, Insights and Forecast - by Product Type
- 8.1.1. Orthopedic
- 8.1.2. Ophthalmology
- 8.1.3. Dental
- 8.1.4. Others
- 8.2. Market Analysis, Insights and Forecast - by Application
- 8.2.1. Plastic Surgery
- 8.2.2. Wound Healing
- 8.2.3. Tissue Engineering
- 8.2.4. Others
- 8.1. Market Analysis, Insights and Forecast - by Product Type
- 9. Rest of the World Medical Biomimetics Analysis, Insights and Forecast, 2019-2031
- 9.1. Market Analysis, Insights and Forecast - by Product Type
- 9.1.1. Orthopedic
- 9.1.2. Ophthalmology
- 9.1.3. Dental
- 9.1.4. Others
- 9.2. Market Analysis, Insights and Forecast - by Application
- 9.2.1. Plastic Surgery
- 9.2.2. Wound Healing
- 9.2.3. Tissue Engineering
- 9.2.4. Others
- 9.1. Market Analysis, Insights and Forecast - by Product Type
- 10. North America Medical Biomimetics Analysis, Insights and Forecast, 2019-2031
- 10.1. Market Analysis, Insights and Forecast - By Country/Sub-region
- 10.1.1 United States
- 10.1.2 Canada
- 10.1.3 Mexico
- 11. South America Medical Biomimetics Analysis, Insights and Forecast, 2019-2031
- 11.1. Market Analysis, Insights and Forecast - By Country/Sub-region
- 11.1.1 Brazil
- 11.1.2 Mexico
- 11.1.3 Rest of South America
- 12. Europe Medical Biomimetics Analysis, Insights and Forecast, 2019-2031
- 12.1. Market Analysis, Insights and Forecast - By Country/Sub-region
- 12.1.1 Germany
- 12.1.2 United Kingdom
- 12.1.3 France
- 12.1.4 Italy
- 12.1.5 Spain
- 12.1.6 Rest of Europe
- 13. Asia Pacific Medical Biomimetics Analysis, Insights and Forecast, 2019-2031
- 13.1. Market Analysis, Insights and Forecast - By Country/Sub-region
- 13.1.1 China
- 13.1.2 Japan
- 13.1.3 India
- 13.1.4 South Korea
- 13.1.5 Taiwan
- 13.1.6 Australia
- 13.1.7 Rest of Asia-Pacific
- 14. MEA Medical Biomimetics Analysis, Insights and Forecast, 2019-2031
- 14.1. Market Analysis, Insights and Forecast - By Country/Sub-region
- 14.1.1 Middle East
- 14.1.2 Africa
- 15. Competitive Analysis
- 15.1. Global Market Share Analysis 2024
- 15.2. Company Profiles
- 15.2.1 Skyland Brand Ventures
- 15.2.1.1. Overview
- 15.2.1.2. Products
- 15.2.1.3. SWOT Analysis
- 15.2.1.4. Recent Developments
- 15.2.1.5. Financials (Based on Availability)
- 15.2.2 CellCore
- 15.2.2.1. Overview
- 15.2.2.2. Products
- 15.2.2.3. SWOT Analysis
- 15.2.2.4. Recent Developments
- 15.2.2.5. Financials (Based on Availability)
- 15.2.3 Avinent Science and Technology
- 15.2.3.1. Overview
- 15.2.3.2. Products
- 15.2.3.3. SWOT Analysis
- 15.2.3.4. Recent Developments
- 15.2.3.5. Financials (Based on Availability)
- 15.2.4 Veryan Medical*List Not Exhaustive
- 15.2.4.1. Overview
- 15.2.4.2. Products
- 15.2.4.3. SWOT Analysis
- 15.2.4.4. Recent Developments
- 15.2.4.5. Financials (Based on Availability)
- 15.2.5 Blatchford Ltd
- 15.2.5.1. Overview
- 15.2.5.2. Products
- 15.2.5.3. SWOT Analysis
- 15.2.5.4. Recent Developments
- 15.2.5.5. Financials (Based on Availability)
- 15.2.6 Applied Biomimetic
- 15.2.6.1. Overview
- 15.2.6.2. Products
- 15.2.6.3. SWOT Analysis
- 15.2.6.4. Recent Developments
- 15.2.6.5. Financials (Based on Availability)
- 15.2.7 Biomimetic Solutions
- 15.2.7.1. Overview
- 15.2.7.2. Products
- 15.2.7.3. SWOT Analysis
- 15.2.7.4. Recent Developments
- 15.2.7.5. Financials (Based on Availability)
- 15.2.8 SynTouch Inc
- 15.2.8.1. Overview
- 15.2.8.2. Products
- 15.2.8.3. SWOT Analysis
- 15.2.8.4. Recent Developments
- 15.2.8.5. Financials (Based on Availability)
- 15.2.9 Abbott
- 15.2.9.1. Overview
- 15.2.9.2. Products
- 15.2.9.3. SWOT Analysis
- 15.2.9.4. Recent Developments
- 15.2.9.5. Financials (Based on Availability)
- 15.2.10 Forschungszentrum Jlich
- 15.2.10.1. Overview
- 15.2.10.2. Products
- 15.2.10.3. SWOT Analysis
- 15.2.10.4. Recent Developments
- 15.2.10.5. Financials (Based on Availability)
- 15.2.1 Skyland Brand Ventures
List of Figures
- Figure 1: Global Medical Biomimetics Revenue Breakdown (Billion, %) by Region 2024 & 2032
- Figure 2: North America Medical Biomimetics Revenue (Billion), by Country 2024 & 2032
- Figure 3: North America Medical Biomimetics Revenue Share (%), by Country 2024 & 2032
- Figure 4: South America Medical Biomimetics Revenue (Billion), by Country 2024 & 2032
- Figure 5: South America Medical Biomimetics Revenue Share (%), by Country 2024 & 2032
- Figure 6: Europe Medical Biomimetics Revenue (Billion), by Country 2024 & 2032
- Figure 7: Europe Medical Biomimetics Revenue Share (%), by Country 2024 & 2032
- Figure 8: Asia Pacific Medical Biomimetics Revenue (Billion), by Country 2024 & 2032
- Figure 9: Asia Pacific Medical Biomimetics Revenue Share (%), by Country 2024 & 2032
- Figure 10: MEA Medical Biomimetics Revenue (Billion), by Country 2024 & 2032
- Figure 11: MEA Medical Biomimetics Revenue Share (%), by Country 2024 & 2032
- Figure 12: North America Medical Biomimetics Revenue (Billion), by Product Type 2024 & 2032
- Figure 13: North America Medical Biomimetics Revenue Share (%), by Product Type 2024 & 2032
- Figure 14: North America Medical Biomimetics Revenue (Billion), by Application 2024 & 2032
- Figure 15: North America Medical Biomimetics Revenue Share (%), by Application 2024 & 2032
- Figure 16: North America Medical Biomimetics Revenue (Billion), by Country 2024 & 2032
- Figure 17: North America Medical Biomimetics Revenue Share (%), by Country 2024 & 2032
- Figure 18: Europe Medical Biomimetics Revenue (Billion), by Product Type 2024 & 2032
- Figure 19: Europe Medical Biomimetics Revenue Share (%), by Product Type 2024 & 2032
- Figure 20: Europe Medical Biomimetics Revenue (Billion), by Application 2024 & 2032
- Figure 21: Europe Medical Biomimetics Revenue Share (%), by Application 2024 & 2032
- Figure 22: Europe Medical Biomimetics Revenue (Billion), by Country 2024 & 2032
- Figure 23: Europe Medical Biomimetics Revenue Share (%), by Country 2024 & 2032
- Figure 24: Asia Pacific Medical Biomimetics Revenue (Billion), by Product Type 2024 & 2032
- Figure 25: Asia Pacific Medical Biomimetics Revenue Share (%), by Product Type 2024 & 2032
- Figure 26: Asia Pacific Medical Biomimetics Revenue (Billion), by Application 2024 & 2032
- Figure 27: Asia Pacific Medical Biomimetics Revenue Share (%), by Application 2024 & 2032
- Figure 28: Asia Pacific Medical Biomimetics Revenue (Billion), by Country 2024 & 2032
- Figure 29: Asia Pacific Medical Biomimetics Revenue Share (%), by Country 2024 & 2032
- Figure 30: Rest of the World Medical Biomimetics Revenue (Billion), by Product Type 2024 & 2032
- Figure 31: Rest of the World Medical Biomimetics Revenue Share (%), by Product Type 2024 & 2032
- Figure 32: Rest of the World Medical Biomimetics Revenue (Billion), by Application 2024 & 2032
- Figure 33: Rest of the World Medical Biomimetics Revenue Share (%), by Application 2024 & 2032
- Figure 34: Rest of the World Medical Biomimetics Revenue (Billion), by Country 2024 & 2032
- Figure 35: Rest of the World Medical Biomimetics Revenue Share (%), by Country 2024 & 2032
List of Tables
- Table 1: Global Medical Biomimetics Revenue Billion Forecast, by Region 2019 & 2032
- Table 2: Global Medical Biomimetics Revenue Billion Forecast, by Product Type 2019 & 2032
- Table 3: Global Medical Biomimetics Revenue Billion Forecast, by Application 2019 & 2032
- Table 4: Global Medical Biomimetics Revenue Billion Forecast, by Region 2019 & 2032
- Table 5: Global Medical Biomimetics Revenue Billion Forecast, by Country 2019 & 2032
- Table 6: United States Medical Biomimetics Revenue (Billion) Forecast, by Application 2019 & 2032
- Table 7: Canada Medical Biomimetics Revenue (Billion) Forecast, by Application 2019 & 2032
- Table 8: Mexico Medical Biomimetics Revenue (Billion) Forecast, by Application 2019 & 2032
- Table 9: Global Medical Biomimetics Revenue Billion Forecast, by Country 2019 & 2032
- Table 10: Brazil Medical Biomimetics Revenue (Billion) Forecast, by Application 2019 & 2032
- Table 11: Mexico Medical Biomimetics Revenue (Billion) Forecast, by Application 2019 & 2032
- Table 12: Rest of South America Medical Biomimetics Revenue (Billion) Forecast, by Application 2019 & 2032
- Table 13: Global Medical Biomimetics Revenue Billion Forecast, by Country 2019 & 2032
- Table 14: Germany Medical Biomimetics Revenue (Billion) Forecast, by Application 2019 & 2032
- Table 15: United Kingdom Medical Biomimetics Revenue (Billion) Forecast, by Application 2019 & 2032
- Table 16: France Medical Biomimetics Revenue (Billion) Forecast, by Application 2019 & 2032
- Table 17: Italy Medical Biomimetics Revenue (Billion) Forecast, by Application 2019 & 2032
- Table 18: Spain Medical Biomimetics Revenue (Billion) Forecast, by Application 2019 & 2032
- Table 19: Rest of Europe Medical Biomimetics Revenue (Billion) Forecast, by Application 2019 & 2032
- Table 20: Global Medical Biomimetics Revenue Billion Forecast, by Country 2019 & 2032
- Table 21: China Medical Biomimetics Revenue (Billion) Forecast, by Application 2019 & 2032
- Table 22: Japan Medical Biomimetics Revenue (Billion) Forecast, by Application 2019 & 2032
- Table 23: India Medical Biomimetics Revenue (Billion) Forecast, by Application 2019 & 2032
- Table 24: South Korea Medical Biomimetics Revenue (Billion) Forecast, by Application 2019 & 2032
- Table 25: Taiwan Medical Biomimetics Revenue (Billion) Forecast, by Application 2019 & 2032
- Table 26: Australia Medical Biomimetics Revenue (Billion) Forecast, by Application 2019 & 2032
- Table 27: Rest of Asia-Pacific Medical Biomimetics Revenue (Billion) Forecast, by Application 2019 & 2032
- Table 28: Global Medical Biomimetics Revenue Billion Forecast, by Country 2019 & 2032
- Table 29: Middle East Medical Biomimetics Revenue (Billion) Forecast, by Application 2019 & 2032
- Table 30: Africa Medical Biomimetics Revenue (Billion) Forecast, by Application 2019 & 2032
- Table 31: Global Medical Biomimetics Revenue Billion Forecast, by Product Type 2019 & 2032
- Table 32: Global Medical Biomimetics Revenue Billion Forecast, by Application 2019 & 2032
- Table 33: Global Medical Biomimetics Revenue Billion Forecast, by Country 2019 & 2032
- Table 34: United States Medical Biomimetics Revenue (Billion) Forecast, by Application 2019 & 2032
- Table 35: Canada Medical Biomimetics Revenue (Billion) Forecast, by Application 2019 & 2032
- Table 36: Mexico Medical Biomimetics Revenue (Billion) Forecast, by Application 2019 & 2032
- Table 37: Global Medical Biomimetics Revenue Billion Forecast, by Product Type 2019 & 2032
- Table 38: Global Medical Biomimetics Revenue Billion Forecast, by Application 2019 & 2032
- Table 39: Global Medical Biomimetics Revenue Billion Forecast, by Country 2019 & 2032
- Table 40: Germany Medical Biomimetics Revenue (Billion) Forecast, by Application 2019 & 2032
- Table 41: United Kingdom Medical Biomimetics Revenue (Billion) Forecast, by Application 2019 & 2032
- Table 42: France Medical Biomimetics Revenue (Billion) Forecast, by Application 2019 & 2032
- Table 43: Italy Medical Biomimetics Revenue (Billion) Forecast, by Application 2019 & 2032
- Table 44: Spain Medical Biomimetics Revenue (Billion) Forecast, by Application 2019 & 2032
- Table 45: Rest of Europe Medical Biomimetics Revenue (Billion) Forecast, by Application 2019 & 2032
- Table 46: Global Medical Biomimetics Revenue Billion Forecast, by Product Type 2019 & 2032
- Table 47: Global Medical Biomimetics Revenue Billion Forecast, by Application 2019 & 2032
- Table 48: Global Medical Biomimetics Revenue Billion Forecast, by Country 2019 & 2032
- Table 49: China Medical Biomimetics Revenue (Billion) Forecast, by Application 2019 & 2032
- Table 50: Japan Medical Biomimetics Revenue (Billion) Forecast, by Application 2019 & 2032
- Table 51: India Medical Biomimetics Revenue (Billion) Forecast, by Application 2019 & 2032
- Table 52: Australia Medical Biomimetics Revenue (Billion) Forecast, by Application 2019 & 2032
- Table 53: South Korea Medical Biomimetics Revenue (Billion) Forecast, by Application 2019 & 2032
- Table 54: Rest of Asia Pacific Medical Biomimetics Revenue (Billion) Forecast, by Application 2019 & 2032
- Table 55: Global Medical Biomimetics Revenue Billion Forecast, by Product Type 2019 & 2032
- Table 56: Global Medical Biomimetics Revenue Billion Forecast, by Application 2019 & 2032
- Table 57: Global Medical Biomimetics Revenue Billion Forecast, by Country 2019 & 2032
Frequently Asked Questions
1. What is the projected Compound Annual Growth Rate (CAGR) of the Medical Biomimetics?
The projected CAGR is approximately 5.70%.
2. Which companies are prominent players in the Medical Biomimetics?
Key companies in the market include Skyland Brand Ventures, CellCore, Avinent Science and Technology, Veryan Medical*List Not Exhaustive, Blatchford Ltd, Applied Biomimetic, Biomimetic Solutions, SynTouch Inc, Abbott, Forschungszentrum Jlich.
3. What are the main segments of the Medical Biomimetics?
The market segments include Product Type, Application.
4. Can you provide details about the market size?
The market size is estimated to be USD XX Billion as of 2022.
5. What are some drivers contributing to market growth?
; Growing Advancement in Nanotechnology; Growing Tissue Engineering Market.
6. What are the notable trends driving market growth?
Orthopaedic is Expected to Exhibit a Significant Growth Over the Forecast Period.
7. Are there any restraints impacting market growth?
Stringent Regulatory Framework.
8. Can you provide examples of recent developments in the market?
N/A
9. What pricing options are available for accessing the report?
Pricing options include single-user, multi-user, and enterprise licenses priced at USD 4750, USD 5250, and USD 8750 respectively.
10. Is the market size provided in terms of value or volume?
The market size is provided in terms of value, measured in Billion.
11. Are there any specific market keywords associated with the report?
Yes, the market keyword associated with the report is "Medical Biomimetics," which aids in identifying and referencing the specific market segment covered.
12. How do I determine which pricing option suits my needs best?
The pricing options vary based on user requirements and access needs. Individual users may opt for single-user licenses, while businesses requiring broader access may choose multi-user or enterprise licenses for cost-effective access to the report.
13. Are there any additional resources or data provided in the Medical Biomimetics report?
While the report offers comprehensive insights, it's advisable to review the specific contents or supplementary materials provided to ascertain if additional resources or data are available.
14. How can I stay updated on further developments or reports in the Medical Biomimetics?
To stay informed about further developments, trends, and reports in the Medical Biomimetics, consider subscribing to industry newsletters, following relevant companies and organizations, or regularly checking reputable industry news sources and publications.
Methodology
Step 1 - Identification of Relevant Samples Size from Population Database


Step 2 - Approaches for Defining Global Market Size (Value, Volume* & Price*)

Note*: In applicable scenarios
Step 3 - Data Sources
Primary Research
- Web Analytics
- Survey Reports
- Research Institute
- Latest Research Reports
- Opinion Leaders
Secondary Research
- Annual Reports
- White Paper
- Latest Press Release
- Industry Association
- Paid Database
- Investor Presentations

Step 4 - Data Triangulation
Involves using different sources of information in order to increase the validity of a study
These sources are likely to be stakeholders in a program - participants, other researchers, program staff, other community members, and so on.
Then we put all data in single framework & apply various statistical tools to find out the dynamic on the market.
During the analysis stage, feedback from the stakeholder groups would be compared to determine areas of agreement as well as areas of divergence
