

Key Insights
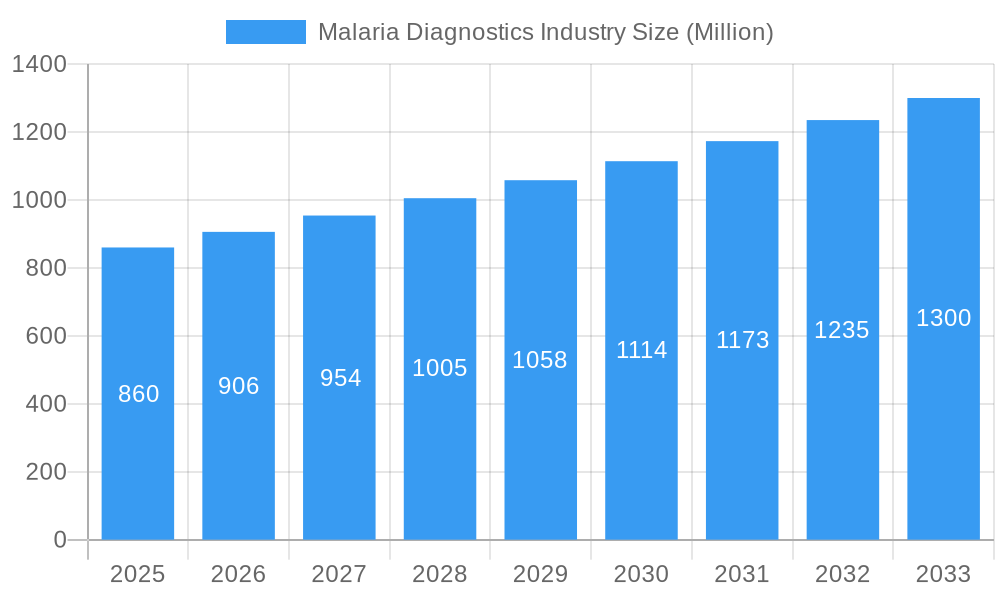
The global malaria diagnostics market, valued at $0.86 billion in 2025, is projected to experience robust growth, driven by increasing malaria prevalence in endemic regions, rising government initiatives for disease control, and advancements in diagnostic technologies. The market's Compound Annual Growth Rate (CAGR) of 5.23% from 2025 to 2033 signifies a consistent expansion, fueled by a greater demand for accurate and rapid diagnostic tools. Technological advancements, particularly in molecular diagnostics (like PCR) and rapid diagnostic tests (RDTs), are key drivers. RDTs offer point-of-care testing, crucial in resource-limited settings, while molecular diagnostics provide higher sensitivity and specificity, aiding in early detection and effective treatment. However, challenges remain, including the need for improved infrastructure in some regions, inconsistent healthcare access, and the emergence of drug-resistant malaria strains. These factors act as restraints, albeit not enough to significantly impede the overall market growth. The market segmentation shows strong growth across all technologies, with molecular diagnostics and RDTs leading the charge due to their advantages in accuracy and ease of use respectively. Geographically, the market is expected to witness significant growth in the Asia-Pacific region due to high malaria burden and increasing investments in healthcare infrastructure. North America and Europe also contribute substantially due to advanced healthcare systems and research & development activities.
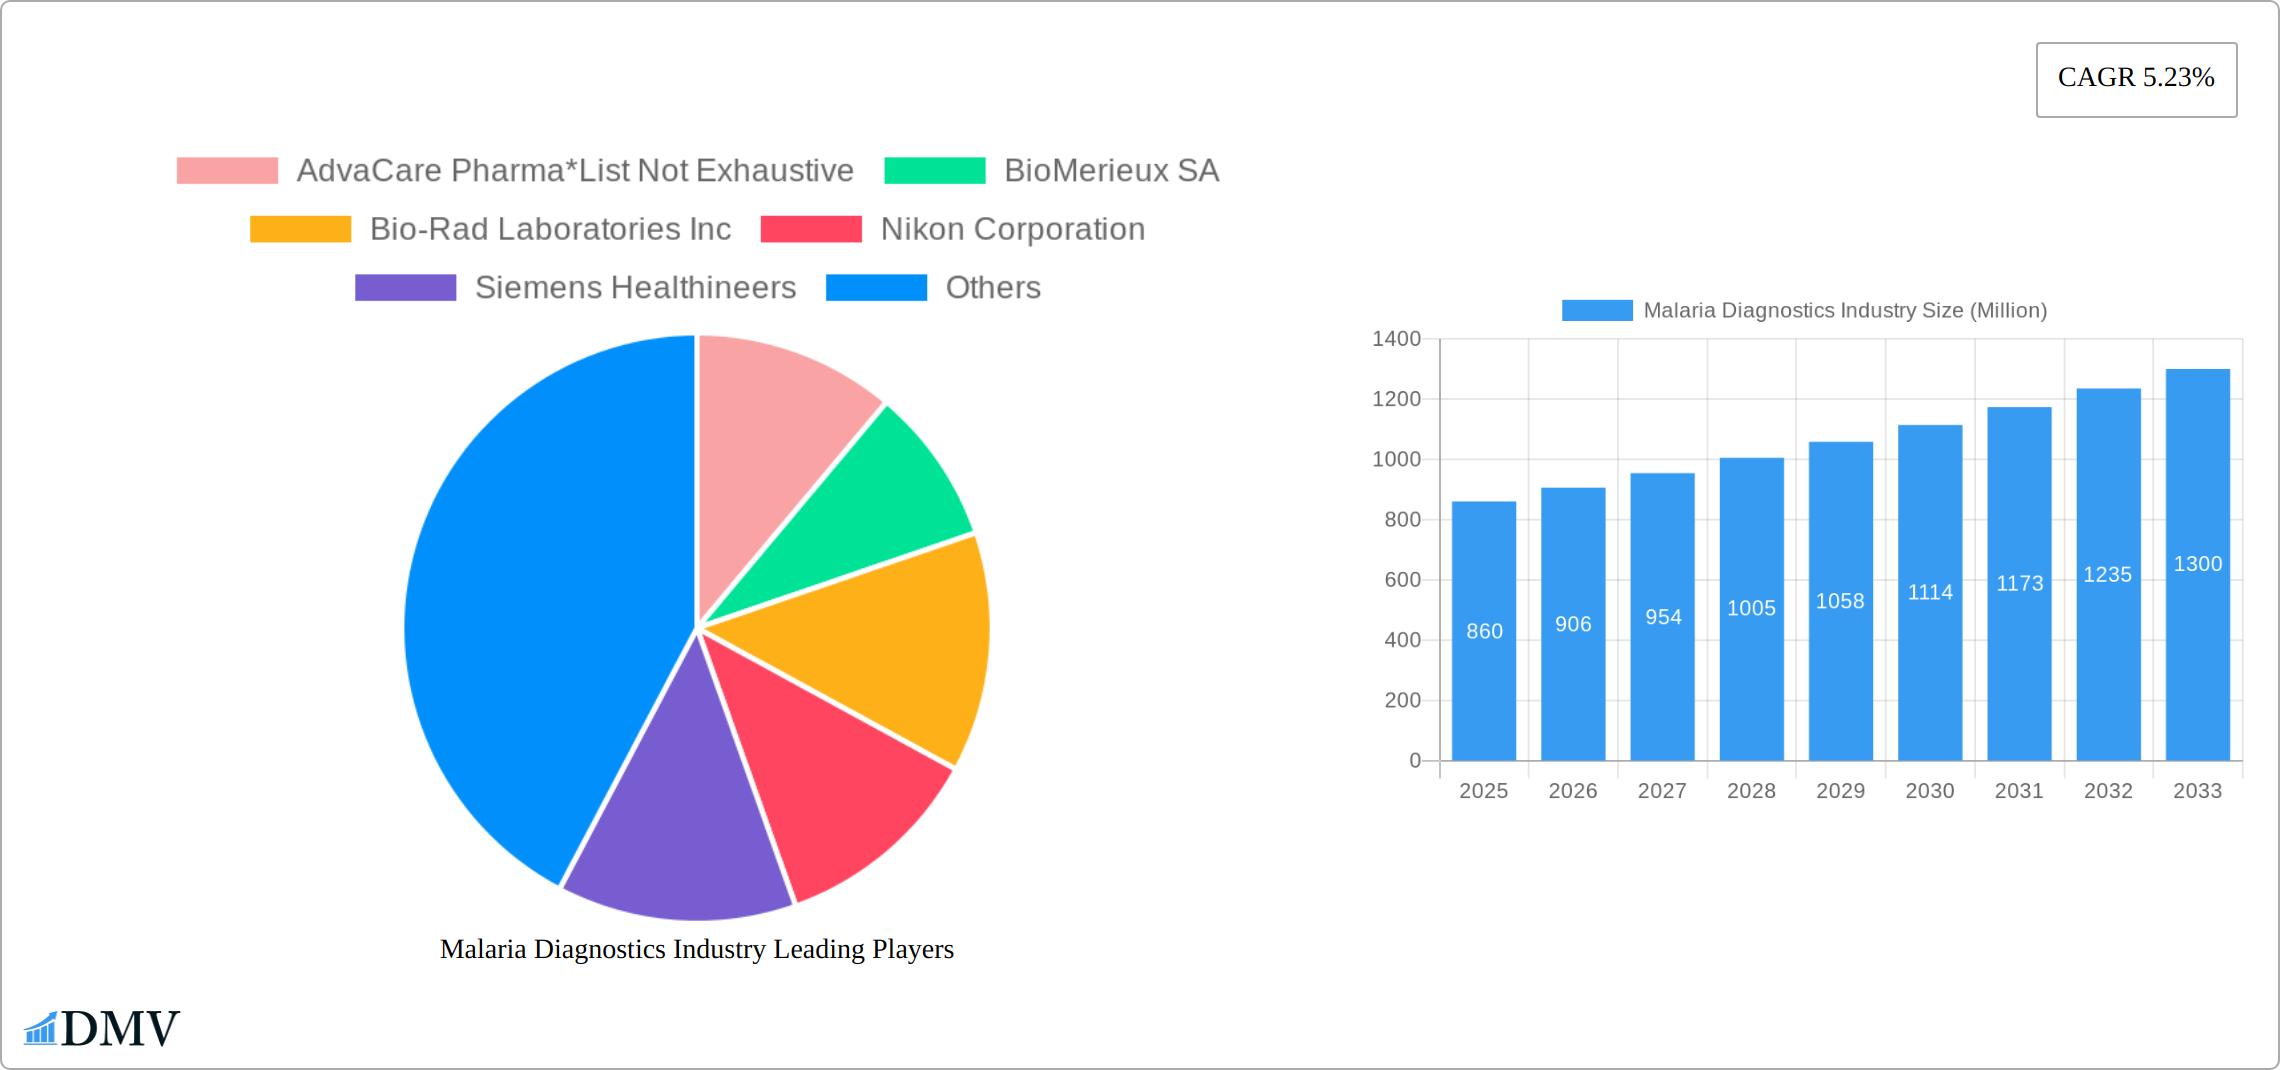
Malaria Diagnostics Industry Market Size (In Million)
The competitive landscape is characterized by a mix of large multinational corporations and smaller specialized companies. Key players, including Abbott Laboratories, BioMerieux SA, Bio-Rad Laboratories, and Thermo Fisher Scientific, leverage their technological expertise and established distribution networks to cater to the growing market demand. The ongoing research and development efforts focused on improving diagnostic accuracy, reducing costs, and developing user-friendly devices will further shape the market landscape in the coming years. The focus on integrating new technologies, such as artificial intelligence and machine learning, into diagnostic platforms holds significant potential to improve the efficiency and effectiveness of malaria diagnosis. This integrated approach will contribute significantly to the market's anticipated growth trajectory.
Malaria Diagnostics Industry Company Market Share
Malaria Diagnostics Industry: A Comprehensive Market Report (2019-2033)
This insightful report provides a detailed analysis of the Malaria Diagnostics Industry, encompassing market trends, technological advancements, key players, and future growth projections from 2019 to 2033. The study period covers historical data (2019-2024), a base year of 2025, and a forecast period extending to 2033. This comprehensive assessment is essential for stakeholders seeking to understand the dynamics of this vital sector and make informed strategic decisions. The market is projected to reach xx Million by 2033.
Malaria Diagnostics Industry Market Composition & Trends
This section meticulously examines the Malaria Diagnostics market's competitive landscape, encompassing market concentration, innovation drivers, regulatory frameworks, substitute products, end-user profiles, and merger & acquisition (M&A) activities.
Market Concentration: The market exhibits a moderately concentrated structure, with key players like Abbott Laboratories, BioMérieux SA, and Thermo Fisher Scientific holding significant market share. Precise market share distribution will vary depending on the specific segment, however we estimate the top 5 players control approximately xx% of the global market. Smaller players, such as AdvaCare Pharma and Premier Medical Corporation Pvt Ltd, cater to niche segments.
Innovation Catalysts: Continuous advancements in molecular diagnostics, particularly PCR-based tests, and rapid diagnostic tests (RDTs) are driving market innovation. The push for point-of-care diagnostics and user-friendly devices fuels further innovation.
Regulatory Landscape: Stringent regulatory approvals and guidelines, varying across different regions, influence market dynamics. Compliance with international standards and local regulations is crucial for market access.
Substitute Products: While no perfect substitutes exist, alternative diagnostic methods and disease management strategies indirectly compete, potentially impacting market growth.
End-User Profiles: The primary end-users include hospitals, clinics, public health organizations, and research institutions. Growing awareness and proactive disease management strategies among end-users are driving demand.
M&A Activities: The industry has witnessed several mergers and acquisitions, with deal values ranging from xx Million to xx Million in recent years, primarily aimed at expanding product portfolios and geographical reach. These acquisitions help consolidate market share and enhance technological capabilities.
Malaria Diagnostics Industry Evolution
This section delves into the evolutionary journey of the Malaria Diagnostics market, charting growth trajectories, technological leaps, and evolving consumer preferences. The market experienced a Compound Annual Growth Rate (CAGR) of xx% during the historical period (2019-2024), fueled by increasing prevalence of malaria and a growing need for rapid and accurate diagnosis. Technological advancements, such as the development of more sensitive and specific diagnostic tools, have significantly impacted the industry's growth trajectory. The shift towards point-of-care testing, driven by the demand for faster diagnosis and reduced reliance on centralized labs, represents a major consumer demand shift. The market is projected to maintain a healthy CAGR of xx% during the forecast period (2025-2033). Adoption rates for molecular diagnostics are expected to increase significantly, exceeding xx% by 2033.
Leading Regions, Countries, or Segments in Malaria Diagnostics Industry
The Sub-Saharan African region remains the dominant force in the malaria diagnostics market, fueled by the high prevalence of malaria and escalating investments in healthcare infrastructure. This leadership is further solidified by substantial international aid and extensive public health initiatives focused on malaria eradication. However, significant growth potential exists in other endemic regions.
Key Drivers in Sub-Saharan Africa:
- High Malaria Burden: The exceptionally high prevalence of malaria necessitates widespread diagnostic capabilities.
- Increased Funding: Significant funding from international organizations like The Global Fund and other governmental bodies directly supports the expansion of diagnostic services.
- Government Initiatives: National health programs focused on improving healthcare access and disease control are crucial drivers of market growth.
- Rapid Diagnostic Test (RDT) Adoption: The ease of use, affordability, and point-of-care capabilities of RDTs have led to widespread adoption.
- Improved Healthcare Infrastructure: Investments in infrastructure are improving the accessibility and reliability of diagnostic testing.
Segment Dominance and Future Growth: Rapid Diagnostic Tests (RDTs) currently command the largest market share due to their ease of use, portability, and cost-effectiveness. However, the molecular diagnostics segment is poised for the most rapid growth, driven by its superior accuracy, ability to detect diverse malaria species, and potential for automation.
Growth in Other Regions: While Sub-Saharan Africa holds the largest share, South Asia and South America present significant untapped markets. Similar factors—rising disease prevalence, increasing healthcare spending, and growing awareness of the importance of early diagnosis—are driving market expansion in these regions.
Emerging Markets: The expansion into underserved regions within existing endemic areas represents a considerable opportunity. These areas often lack access to reliable diagnostic tools, creating a substantial unmet need.
Malaria Diagnostics Industry Product Innovations
The malaria diagnostics landscape is constantly evolving, with significant advancements in both RDTs and molecular diagnostics. Highly sensitive and specific molecular diagnostic tests can now detect even low parasite densities and differentiate between various malaria species, enabling more precise diagnosis and treatment. Simultaneously, RDT technology continues to improve, featuring longer shelf lives, enhanced sensitivity, and the incorporation of multiplexing capabilities—meaning more tests can be performed on a single sample. These advancements result in faster turnaround times, improved accuracy, and reduced reliance on complex equipment and trained personnel.
Propelling Factors for Malaria Diagnostics Industry Growth
Several factors are propelling the growth of the malaria diagnostics industry. Increased funding for malaria control programs from organizations like the Global Fund is a major driver. Technological advancements, including the development of more accurate and affordable diagnostic tools, are contributing significantly. Stringent regulatory frameworks promoting diagnostic quality and safety are also positively impacting market expansion. Finally, the growing awareness and proactive disease management strategies within healthcare systems globally further fuel market growth.
Obstacles in the Malaria Diagnostics Industry Market
Despite substantial market potential, several challenges hinder growth. Supply chain vulnerabilities, especially concerning raw materials and reagents, create periodic disruptions. The high cost of certain technologies, such as advanced molecular diagnostics, limits accessibility in resource-constrained settings. Furthermore, intense competition among numerous market players can pressure pricing and profitability. Regulatory hurdles and the need for robust quality control systems also present obstacles.
Future Opportunities in Malaria Diagnostics Industry
The future of malaria diagnostics is bright, with numerous opportunities for expansion and innovation. Addressing the unmet diagnostic needs in underserved regions remains a primary growth driver. The integration of artificial intelligence (AI) and machine learning for image analysis offers improved diagnostic accuracy and automation potential. Furthermore, the integration of diagnostics into comprehensive malaria control programs ensures broader impact and sustainable growth. The development of user-friendly, low-cost, and high-performance point-of-care diagnostic devices will also be critical in achieving widespread access.
Major Players in the Malaria Diagnostics Industry Ecosystem
- AdvaCare Pharma
- BioMérieux SA
- Bio-Rad Laboratories Inc
- Nikon Corporation
- Siemens Healthineers
- Abbott Laboratories
- Ortho Clinical Diagnostics
- Premier Medical Corporation Pvt Ltd
- Advy Chemical Pvt Ltd
- Zephyr Biomedicals
- Access Bio Inc
- Thermo Fisher Scientific
Key Developments in Malaria Diagnostics Industry Industry
- June 2022: SC Johnson and the Global Fund partnered to eradicate malaria. The Global Fund's commitment of over USD 16 Billion highlights the significant investment in malaria control.
- February 2022: Kenya Medical Research Institute (KEMRI) launched the Plasmochek diagnostic kit, expanding diagnostic options in Kenya and potentially serving as a model for other regions.
Strategic Malaria Diagnostics Industry Market Forecast
The malaria diagnostics market is poised for substantial growth over the forecast period, driven by continued technological advancements, increasing funding for malaria control programs, and a growing focus on early and accurate diagnosis in endemic regions. The market is expected to witness a significant expansion in both developed and developing countries, presenting lucrative opportunities for industry players. The projected market size reflects a strong demand for accurate, affordable, and accessible diagnostic tools.
Malaria Diagnostics Industry Segmentation
-
1. Technology
- 1.1. Clinical Diagnostics
- 1.2. Microscopic Diagnostics
- 1.3. Rapid Diagnostic Tests (RDTs)
- 1.4. Molecular Diagnostics
- 1.5. Other Technologies
Malaria Diagnostics Industry Segmentation By Geography
-
1. Americas
- 1.1. Venezuela
- 1.2. Brazil
- 1.3. Colombia
- 1.4. Rest of the Americas
-
2. Europe
- 2.1. Germany
- 2.2. United Kingdom
- 2.3. France
- 2.4. Turkey
- 2.5. Spain
- 2.6. Rest of Europe
- 3. Asia Pacific
-
4. India
- 4.1. Myanmar
- 4.2. Indonesia
- 4.3. Pakistan
- 4.4. China
- 4.5. Papua New Guinea
- 4.6. Cambodia
- 4.7. Rest of Asia Pacific
-
5. Africa
- 5.1. Democratic Republic of Congo
- 5.2. Nigeria
- 5.3. Uganda
- 5.4. Rest of Africa
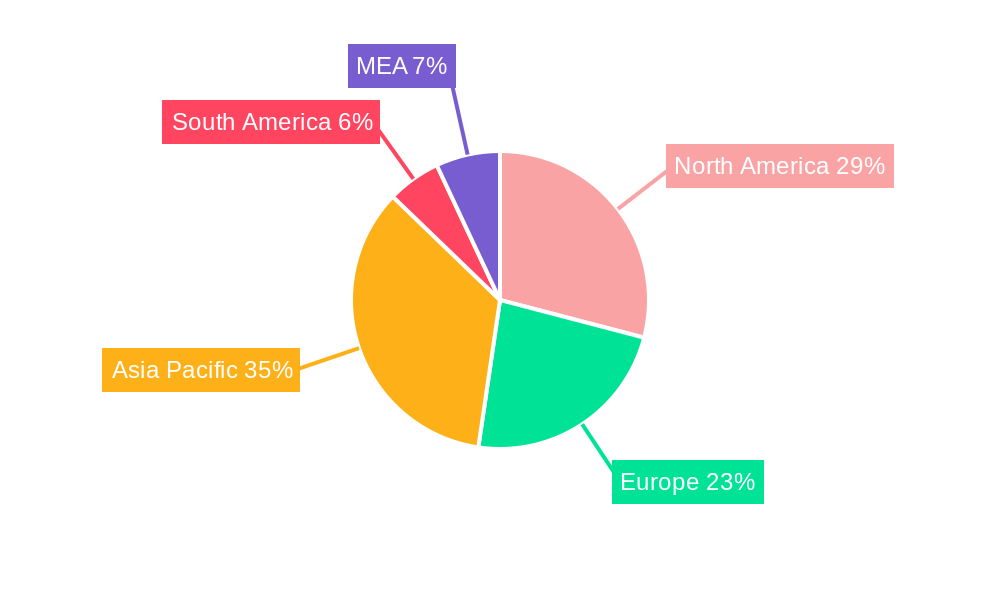
Malaria Diagnostics Industry Regional Market Share
Geographic Coverage of Malaria Diagnostics Industry
Malaria Diagnostics Industry REPORT HIGHLIGHTS
| Aspects | Details |
|---|---|
| Study Period | 2020-2034 |
| Base Year | 2025 |
| Estimated Year | 2026 |
| Forecast Period | 2026-2034 |
| Historical Period | 2020-2025 |
| Growth Rate | CAGR of 5.23% from 2020-2034 |
| Segmentation |
|
Table of Contents
- 1. Introduction
- 1.1. Research Scope
- 1.2. Market Segmentation
- 1.3. Research Objective
- 1.4. Definitions and Assumptions
- 2. Executive Summary
- 2.1. Market Snapshot
- 3. Market Dynamics
- 3.1. Market Drivers
- 3.2. Market Restrains
- 3.3. Market Trends
- 3.4. Market Opportunities
- 4. Market Factor Analysis
- 4.1. Porters Five Forces
- 4.1.1. Bargaining Power of Suppliers
- 4.1.2. Bargaining Power of Buyers
- 4.1.3. Threat of New Entrants
- 4.1.4. Threat of Substitutes
- 4.1.5. Competitive Rivalry
- 4.2. PESTEL analysis
- 4.3. BCG Analysis
- 4.3.1. Stars (High Growth, High Market Share)
- 4.3.2. Cash Cows (Low Growth, High Market Share)
- 4.3.3. Question Mark (High Growth, Low Market Share)
- 4.3.4. Dogs (Low Growth, Low Market Share)
- 4.4. Ansoff Matrix Analysis
- 4.5. Supply Chain Analysis
- 4.6. Regulatory Landscape
- 4.7. Current Market Potential and Opportunity Assessment (TAM–SAM–SOM Framework)
- 4.8. DMV Analyst Note
- 4.1. Porters Five Forces
- 5. Market Analysis, Insights and Forecast 2021-2033
- 5.1. Market Analysis, Insights and Forecast - by Technology
- 5.1.1. Clinical Diagnostics
- 5.1.2. Microscopic Diagnostics
- 5.1.3. Rapid Diagnostic Tests (RDTs)
- 5.1.4. Molecular Diagnostics
- 5.1.5. Other Technologies
- 5.2. Market Analysis, Insights and Forecast - by Region
- 5.2.1. Americas
- 5.2.2. Europe
- 5.2.3. Asia Pacific
- 5.2.4. India
- 5.2.5. Africa
- 5.1. Market Analysis, Insights and Forecast - by Technology
- 6. Global Malaria Diagnostics Industry Analysis, Insights and Forecast, 2021-2033
- 6.1. Market Analysis, Insights and Forecast - by Technology
- 6.1.1. Clinical Diagnostics
- 6.1.2. Microscopic Diagnostics
- 6.1.3. Rapid Diagnostic Tests (RDTs)
- 6.1.4. Molecular Diagnostics
- 6.1.5. Other Technologies
- 6.1. Market Analysis, Insights and Forecast - by Technology
- 7. Americas Malaria Diagnostics Industry Analysis, Insights and Forecast, 2020-2032
- 7.1. Market Analysis, Insights and Forecast - by Technology
- 7.1.1. Clinical Diagnostics
- 7.1.2. Microscopic Diagnostics
- 7.1.3. Rapid Diagnostic Tests (RDTs)
- 7.1.4. Molecular Diagnostics
- 7.1.5. Other Technologies
- 7.1. Market Analysis, Insights and Forecast - by Technology
- 8. Europe Malaria Diagnostics Industry Analysis, Insights and Forecast, 2020-2032
- 8.1. Market Analysis, Insights and Forecast - by Technology
- 8.1.1. Clinical Diagnostics
- 8.1.2. Microscopic Diagnostics
- 8.1.3. Rapid Diagnostic Tests (RDTs)
- 8.1.4. Molecular Diagnostics
- 8.1.5. Other Technologies
- 8.1. Market Analysis, Insights and Forecast - by Technology
- 9. Asia Pacific Malaria Diagnostics Industry Analysis, Insights and Forecast, 2020-2032
- 9.1. Market Analysis, Insights and Forecast - by Technology
- 9.1.1. Clinical Diagnostics
- 9.1.2. Microscopic Diagnostics
- 9.1.3. Rapid Diagnostic Tests (RDTs)
- 9.1.4. Molecular Diagnostics
- 9.1.5. Other Technologies
- 9.1. Market Analysis, Insights and Forecast - by Technology
- 10. India Malaria Diagnostics Industry Analysis, Insights and Forecast, 2020-2032
- 10.1. Market Analysis, Insights and Forecast - by Technology
- 10.1.1. Clinical Diagnostics
- 10.1.2. Microscopic Diagnostics
- 10.1.3. Rapid Diagnostic Tests (RDTs)
- 10.1.4. Molecular Diagnostics
- 10.1.5. Other Technologies
- 10.1. Market Analysis, Insights and Forecast - by Technology
- 11. Africa Malaria Diagnostics Industry Analysis, Insights and Forecast, 2020-2032
- 11.1. Market Analysis, Insights and Forecast - by Technology
- 11.1.1. Clinical Diagnostics
- 11.1.2. Microscopic Diagnostics
- 11.1.3. Rapid Diagnostic Tests (RDTs)
- 11.1.4. Molecular Diagnostics
- 11.1.5. Other Technologies
- 11.1. Market Analysis, Insights and Forecast - by Technology
- 12. Competitive Analysis
- 12.1. Company Profiles
- 12.1.1 AdvaCare Pharma*List Not Exhaustive
- 12.1.1.1. Company Overview
- 12.1.1.2. Products
- 12.1.1.3. Company Financials
- 12.1.1.4. SWOT Analysis
- 12.1.2 BioMerieux SA
- 12.1.2.1. Company Overview
- 12.1.2.2. Products
- 12.1.2.3. Company Financials
- 12.1.2.4. SWOT Analysis
- 12.1.3 Bio-Rad Laboratories Inc
- 12.1.3.1. Company Overview
- 12.1.3.2. Products
- 12.1.3.3. Company Financials
- 12.1.3.4. SWOT Analysis
- 12.1.4 Nikon Corporation
- 12.1.4.1. Company Overview
- 12.1.4.2. Products
- 12.1.4.3. Company Financials
- 12.1.4.4. SWOT Analysis
- 12.1.5 Siemens Healthineers
- 12.1.5.1. Company Overview
- 12.1.5.2. Products
- 12.1.5.3. Company Financials
- 12.1.5.4. SWOT Analysis
- 12.1.6 Abbott Laboratories
- 12.1.6.1. Company Overview
- 12.1.6.2. Products
- 12.1.6.3. Company Financials
- 12.1.6.4. SWOT Analysis
- 12.1.7 Ortho Clinical Diagnostics
- 12.1.7.1. Company Overview
- 12.1.7.2. Products
- 12.1.7.3. Company Financials
- 12.1.7.4. SWOT Analysis
- 12.1.8 Premier Medical Corporation Pvt Ltd
- 12.1.8.1. Company Overview
- 12.1.8.2. Products
- 12.1.8.3. Company Financials
- 12.1.8.4. SWOT Analysis
- 12.1.9 Advy Chemical Pvt Ltd
- 12.1.9.1. Company Overview
- 12.1.9.2. Products
- 12.1.9.3. Company Financials
- 12.1.9.4. SWOT Analysis
- 12.1.10 Zephyr Biomedicals
- 12.1.10.1. Company Overview
- 12.1.10.2. Products
- 12.1.10.3. Company Financials
- 12.1.10.4. SWOT Analysis
- 12.1.11 Access Bio Inc
- 12.1.11.1. Company Overview
- 12.1.11.2. Products
- 12.1.11.3. Company Financials
- 12.1.11.4. SWOT Analysis
- 12.1.12 Thermo Fisher Scientific
- 12.1.12.1. Company Overview
- 12.1.12.2. Products
- 12.1.12.3. Company Financials
- 12.1.12.4. SWOT Analysis
- 12.1.1 AdvaCare Pharma*List Not Exhaustive
- 12.2. Market Entropy
- 12.2.1 Company's Key Areas Served
- 12.2.2 Recent Developments
- 12.3. Company Market Share Analysis 2025
- 12.3.1 Top 5 Companies Market Share Analysis
- 12.3.2 Top 3 Companies Market Share Analysis
- 12.4. List of Potential Customers
- 13. Research Methodology
List of Figures
- Figure 1: Global Malaria Diagnostics Industry Revenue Breakdown (Million, %) by Region 2025 & 2033
- Figure 2: Americas Malaria Diagnostics Industry Revenue (Million), by Technology 2025 & 2033
- Figure 3: Americas Malaria Diagnostics Industry Revenue Share (%), by Technology 2025 & 2033
- Figure 4: Americas Malaria Diagnostics Industry Revenue (Million), by Country 2025 & 2033
- Figure 5: Americas Malaria Diagnostics Industry Revenue Share (%), by Country 2025 & 2033
- Figure 6: Europe Malaria Diagnostics Industry Revenue (Million), by Technology 2025 & 2033
- Figure 7: Europe Malaria Diagnostics Industry Revenue Share (%), by Technology 2025 & 2033
- Figure 8: Europe Malaria Diagnostics Industry Revenue (Million), by Country 2025 & 2033
- Figure 9: Europe Malaria Diagnostics Industry Revenue Share (%), by Country 2025 & 2033
- Figure 10: Asia Pacific Malaria Diagnostics Industry Revenue (Million), by Technology 2025 & 2033
- Figure 11: Asia Pacific Malaria Diagnostics Industry Revenue Share (%), by Technology 2025 & 2033
- Figure 12: Asia Pacific Malaria Diagnostics Industry Revenue (Million), by Country 2025 & 2033
- Figure 13: Asia Pacific Malaria Diagnostics Industry Revenue Share (%), by Country 2025 & 2033
- Figure 14: India Malaria Diagnostics Industry Revenue (Million), by Technology 2025 & 2033
- Figure 15: India Malaria Diagnostics Industry Revenue Share (%), by Technology 2025 & 2033
- Figure 16: India Malaria Diagnostics Industry Revenue (Million), by Country 2025 & 2033
- Figure 17: India Malaria Diagnostics Industry Revenue Share (%), by Country 2025 & 2033
- Figure 18: Africa Malaria Diagnostics Industry Revenue (Million), by Technology 2025 & 2033
- Figure 19: Africa Malaria Diagnostics Industry Revenue Share (%), by Technology 2025 & 2033
- Figure 20: Africa Malaria Diagnostics Industry Revenue (Million), by Country 2025 & 2033
- Figure 21: Africa Malaria Diagnostics Industry Revenue Share (%), by Country 2025 & 2033
List of Tables
- Table 1: Global Malaria Diagnostics Industry Revenue Million Forecast, by Technology 2020 & 2033
- Table 2: Global Malaria Diagnostics Industry Revenue Million Forecast, by Region 2020 & 2033
- Table 3: Global Malaria Diagnostics Industry Revenue Million Forecast, by Technology 2020 & 2033
- Table 4: Global Malaria Diagnostics Industry Revenue Million Forecast, by Country 2020 & 2033
- Table 5: Venezuela Malaria Diagnostics Industry Revenue (Million) Forecast, by Application 2020 & 2033
- Table 6: Brazil Malaria Diagnostics Industry Revenue (Million) Forecast, by Application 2020 & 2033
- Table 7: Colombia Malaria Diagnostics Industry Revenue (Million) Forecast, by Application 2020 & 2033
- Table 8: Rest of the Americas Malaria Diagnostics Industry Revenue (Million) Forecast, by Application 2020 & 2033
- Table 9: Global Malaria Diagnostics Industry Revenue Million Forecast, by Technology 2020 & 2033
- Table 10: Global Malaria Diagnostics Industry Revenue Million Forecast, by Country 2020 & 2033
- Table 11: Germany Malaria Diagnostics Industry Revenue (Million) Forecast, by Application 2020 & 2033
- Table 12: United Kingdom Malaria Diagnostics Industry Revenue (Million) Forecast, by Application 2020 & 2033
- Table 13: France Malaria Diagnostics Industry Revenue (Million) Forecast, by Application 2020 & 2033
- Table 14: Turkey Malaria Diagnostics Industry Revenue (Million) Forecast, by Application 2020 & 2033
- Table 15: Spain Malaria Diagnostics Industry Revenue (Million) Forecast, by Application 2020 & 2033
- Table 16: Rest of Europe Malaria Diagnostics Industry Revenue (Million) Forecast, by Application 2020 & 2033
- Table 17: Global Malaria Diagnostics Industry Revenue Million Forecast, by Technology 2020 & 2033
- Table 18: Global Malaria Diagnostics Industry Revenue Million Forecast, by Country 2020 & 2033
- Table 19: Global Malaria Diagnostics Industry Revenue Million Forecast, by Technology 2020 & 2033
- Table 20: Global Malaria Diagnostics Industry Revenue Million Forecast, by Country 2020 & 2033
- Table 21: Myanmar Malaria Diagnostics Industry Revenue (Million) Forecast, by Application 2020 & 2033
- Table 22: Indonesia Malaria Diagnostics Industry Revenue (Million) Forecast, by Application 2020 & 2033
- Table 23: Pakistan Malaria Diagnostics Industry Revenue (Million) Forecast, by Application 2020 & 2033
- Table 24: China Malaria Diagnostics Industry Revenue (Million) Forecast, by Application 2020 & 2033
- Table 25: Papua New Guinea Malaria Diagnostics Industry Revenue (Million) Forecast, by Application 2020 & 2033
- Table 26: Cambodia Malaria Diagnostics Industry Revenue (Million) Forecast, by Application 2020 & 2033
- Table 27: Rest of Asia Pacific Malaria Diagnostics Industry Revenue (Million) Forecast, by Application 2020 & 2033
- Table 28: Global Malaria Diagnostics Industry Revenue Million Forecast, by Technology 2020 & 2033
- Table 29: Global Malaria Diagnostics Industry Revenue Million Forecast, by Country 2020 & 2033
- Table 30: Democratic Republic of Congo Malaria Diagnostics Industry Revenue (Million) Forecast, by Application 2020 & 2033
- Table 31: Nigeria Malaria Diagnostics Industry Revenue (Million) Forecast, by Application 2020 & 2033
- Table 32: Uganda Malaria Diagnostics Industry Revenue (Million) Forecast, by Application 2020 & 2033
- Table 33: Rest of Africa Malaria Diagnostics Industry Revenue (Million) Forecast, by Application 2020 & 2033
Frequently Asked Questions
1. What is the projected Compound Annual Growth Rate (CAGR) of the Malaria Diagnostics Industry?
The projected CAGR is approximately 5.23%.
2. Which companies are prominent players in the Malaria Diagnostics Industry?
Key companies in the market include AdvaCare Pharma*List Not Exhaustive, BioMerieux SA, Bio-Rad Laboratories Inc, Nikon Corporation, Siemens Healthineers, Abbott Laboratories, Ortho Clinical Diagnostics, Premier Medical Corporation Pvt Ltd, Advy Chemical Pvt Ltd, Zephyr Biomedicals, Access Bio Inc, Thermo Fisher Scientific.
3. What are the main segments of the Malaria Diagnostics Industry?
The market segments include Technology.
4. Can you provide details about the market size?
The market size is estimated to be USD 0.86 Million as of 2022.
5. What are some drivers contributing to market growth?
Growing Demand for Diagnostic Tools in Malaria-endemic Regions; Increasing Technological Advancements and Efficient Diagnostics; Scale-up of Rapid Diagnostic Tests and Universal Access to Diagnosis.
6. What are the notable trends driving market growth?
Microscopic Diagnostics is Expected to Hold the Highest Market Share in the Technology Segment.
7. Are there any restraints impacting market growth?
Increasing Number of Malaria-free Countries; Rising Demand for Low-cost Diagnostic Tools.
8. Can you provide examples of recent developments in the market?
In June 2022, SC Johnson and Global Fund partnered to eradicate malaria. The Global Fund provides 56% of all international financing for malaria programs (39% of total available resources) and invested more than USD 16 billion in malaria control programs to date.
9. What pricing options are available for accessing the report?
Pricing options include single-user, multi-user, and enterprise licenses priced at USD 4750, USD 5250, and USD 8750 respectively.
10. Is the market size provided in terms of value or volume?
The market size is provided in terms of value, measured in Million.
11. Are there any specific market keywords associated with the report?
Yes, the market keyword associated with the report is "Malaria Diagnostics Industry," which aids in identifying and referencing the specific market segment covered.
12. How do I determine which pricing option suits my needs best?
The pricing options vary based on user requirements and access needs. Individual users may opt for single-user licenses, while businesses requiring broader access may choose multi-user or enterprise licenses for cost-effective access to the report.
13. Are there any additional resources or data provided in the Malaria Diagnostics Industry report?
While the report offers comprehensive insights, it's advisable to review the specific contents or supplementary materials provided to ascertain if additional resources or data are available.
14. How can I stay updated on further developments or reports in the Malaria Diagnostics Industry?
To stay informed about further developments, trends, and reports in the Malaria Diagnostics Industry, consider subscribing to industry newsletters, following relevant companies and organizations, or regularly checking reputable industry news sources and publications.
Methodology
Step 1 - Identification of Relevant Samples Size from Population Database


Step 2 - Approaches for Defining Global Market Size (Value, Volume* & Price*)

Note*: In applicable scenarios
Step 3 - Data Sources
Primary Research
- Web Analytics
- Survey Reports
- Research Institute
- Latest Research Reports
- Opinion Leaders
Secondary Research
- Annual Reports
- White Paper
- Latest Press Release
- Industry Association
- Paid Database
- Investor Presentations

Step 4 - Data Triangulation
Involves using different sources of information in order to increase the validity of a study
These sources are likely to be stakeholders in a program - participants, other researchers, program staff, other community members, and so on.
Then we put all data in single framework & apply various statistical tools to find out the dynamic on the market.
During the analysis stage, feedback from the stakeholder groups would be compared to determine areas of agreement as well as areas of divergence