

Key Insights
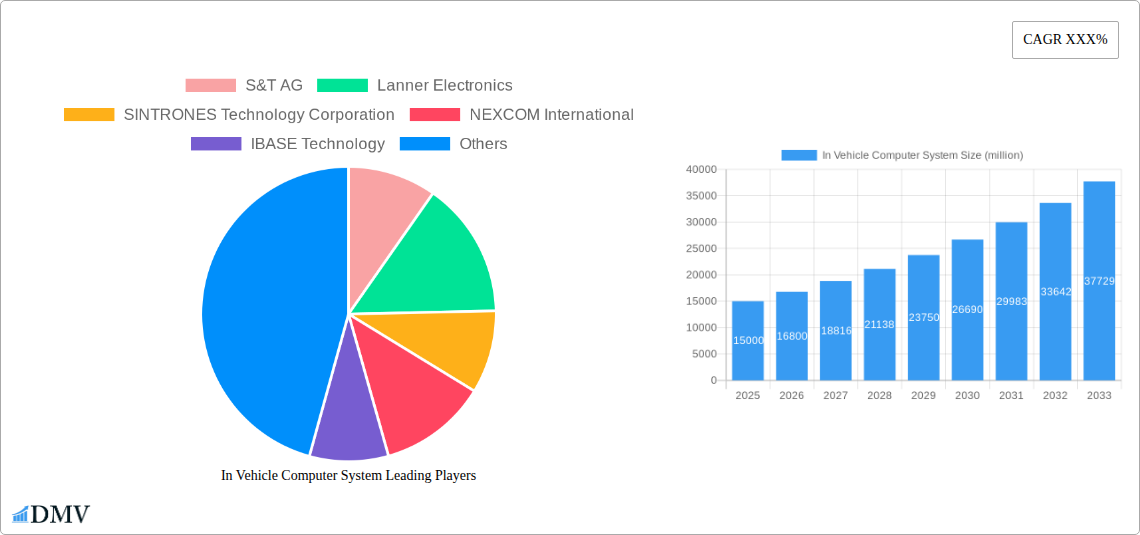
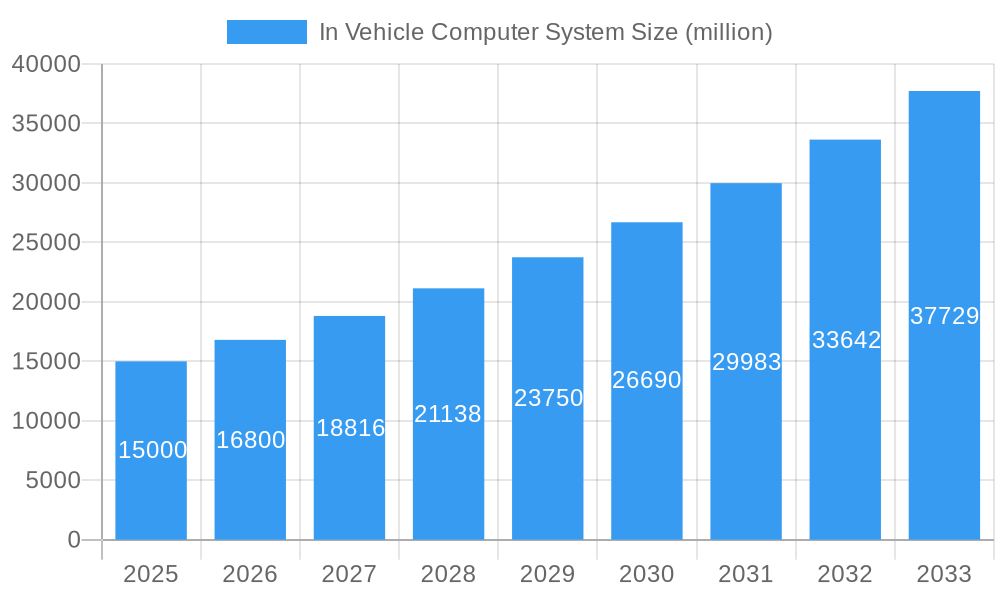
The In-Vehicle Computer System (IVCS) market is experiencing robust growth, driven by the increasing adoption of advanced driver-assistance systems (ADAS), the proliferation of connected cars, and the rising demand for in-car infotainment and telematics solutions. The market, estimated at $15 billion in 2025, is projected to witness a Compound Annual Growth Rate (CAGR) of 12% from 2025 to 2033, reaching approximately $45 billion by 2033. Key drivers include the automotive industry's shift towards autonomous driving capabilities, requiring sophisticated computing power for processing sensor data and executing complex algorithms. Furthermore, the growing consumer demand for enhanced connectivity features, such as seamless smartphone integration, over-the-air updates, and access to various online services, is fueling market expansion. Leading players like S&T AG, Lanner Electronics, and others are actively involved in developing innovative IVCS solutions, fostering competition and driving innovation within the sector.
In Vehicle Computer System Market Size (In Billion)
The market's segmentation is largely influenced by vehicle type (passenger cars, commercial vehicles), computing platform (x86, ARM), and application (ADAS, infotainment, telematics). While the passenger car segment currently dominates, the commercial vehicle segment is expected to show faster growth due to the increasing need for fleet management and safety systems. The ongoing integration of artificial intelligence (AI) and machine learning (ML) into IVCS is expected to revolutionize the automotive landscape, leading to more intelligent and responsive vehicles. However, factors such as high initial investment costs, stringent regulatory requirements, and cybersecurity concerns pose challenges to the market's growth. Nonetheless, the overall outlook for the IVCS market remains highly positive, driven by technological advancements and a favorable regulatory environment.
In Vehicle Computer System Company Market Share
In-Vehicle Computer System Market Report: 2019-2033 - A Comprehensive Analysis
This insightful report provides a detailed analysis of the In-Vehicle Computer System (IVCS) market, projecting a multi-million dollar valuation by 2033. Covering the period 2019-2033, with a base year of 2025 and forecast period 2025-2033, this comprehensive study offers stakeholders an unparalleled understanding of market dynamics, technological advancements, and future growth opportunities. Key players like S&T AG, Lanner Electronics, SINTRONES Technology Corporation, NEXCOM International, IBASE Technology, and Axiomtek are extensively profiled, alongside an assessment of industry segments and regional performance. This report is crucial for strategic decision-making and investment planning within the rapidly evolving IVCS landscape.
In Vehicle Computer System Market Composition & Trends
The In-Vehicle Computer System market, valued at $XX million in 2024, is experiencing significant growth driven by the increasing adoption of advanced driver-assistance systems (ADAS) and the rise of autonomous vehicles. Market concentration is moderate, with several key players holding significant shares but no single dominant entity. The competitive landscape is characterized by ongoing M&A activity, with deal values exceeding $XX million in the last five years. Innovation is fueled by advancements in processing power, AI capabilities, and connectivity technologies. Regulatory changes impacting vehicle safety and emissions are shaping market trends, while substitute products like cloud-based solutions face limitations in terms of latency and reliability. End-user profiles include automotive manufacturers, Tier-1 suppliers, and technology companies.
- Market Share Distribution (2024): S&T AG (xx%), Lanner Electronics (xx%), SINTRONES (xx%), NEXCOM (xx%), IBASE (xx%), Axiomtek (xx%), Others (xx%).
- M&A Activity (2019-2024): XX deals totaling over $XX million in value.
- Key Innovation Catalysts: AI, 5G connectivity, high-performance computing.
- Regulatory Landscape: Stringent safety and emissions standards driving demand for advanced IVCS.
In Vehicle Computer System Industry Evolution
The IVCS market has witnessed exponential growth over the historical period (2019-2024), with a Compound Annual Growth Rate (CAGR) of xx%. This growth is primarily attributable to the increasing integration of computing power into vehicles, facilitating the development of sophisticated features like ADAS and autonomous driving capabilities. Technological advancements, such as the miniaturization of components, improved processing power, and enhanced connectivity solutions (e.g., 5G), have significantly contributed to this expansion. Consumer demand is shifting towards vehicles equipped with advanced safety features, infotainment systems, and connected services, further fueling market growth. Adoption rates for IVCS are increasing rapidly, particularly in premium vehicle segments, with an estimated xx% penetration rate in 2025. This upward trajectory is projected to continue throughout the forecast period (2025-2033), leading to a market value of $XX million by 2033.
Leading Regions, Countries, or Segments in In Vehicle Computer System
The North American region currently dominates the In-Vehicle Computer System market, driven by high vehicle production volumes, early adoption of advanced technologies, and a robust regulatory framework supporting autonomous driving initiatives. China, however, is projected to experience the fastest growth rate, benefiting from a rapidly expanding automotive industry and government support for technological advancements in the transportation sector. The premium vehicle segment represents the most lucrative market share due to higher spending capacity and increased demand for advanced features.
- Key Drivers for North American Dominance: High vehicle production, early adoption of ADAS, supportive regulatory environment, strong consumer demand for advanced technologies.
- Key Drivers for China's High Growth Potential: Rapid expansion of the automotive industry, government investment in infrastructure and technology development, supportive policies for electric and autonomous vehicles.
- Dominant Segment: Premium vehicles showcase the highest adoption of advanced features and technologies within IVCS.
In Vehicle Computer System Product Innovations
Recent innovations in IVCS include the development of highly integrated, modular systems that enhance flexibility and reduce costs. The integration of artificial intelligence (AI) and machine learning (ML) algorithms enables advanced features such as driver monitoring, predictive maintenance, and personalized driving experiences. These innovations offer unique selling propositions, such as improved safety, enhanced driver comfort, and optimized vehicle performance. Key performance metrics focus on processing speed, power efficiency, thermal management, and functional safety compliance. These advancements continue to drive the expansion of the In-Vehicle Computer System market.
Propelling Factors for In Vehicle Computer System Growth
Several factors are driving the growth of the In-Vehicle Computer System market. Technological advancements, such as the development of more powerful and energy-efficient processors, are enabling the integration of more sophisticated features. Economic factors, including increased consumer disposable income and government incentives for vehicle electrification, are fostering demand. Regulatory pressures, such as stricter safety and emission standards, are also driving the adoption of advanced IVCS solutions. The increasing demand for connected and autonomous vehicles further contributes to the market's upward trajectory.
Obstacles in the In Vehicle Computer System Market
Despite the significant growth potential, the In-Vehicle Computer System market faces several challenges. High initial investment costs for advanced systems may hinder adoption in the lower-priced vehicle segments. Supply chain disruptions, particularly concerning semiconductor components, can impact production and availability. Intense competition among established players and new entrants can lead to pricing pressures. Furthermore, stringent safety and cybersecurity regulations require significant development efforts and certifications, posing additional challenges for manufacturers.
Future Opportunities in In Vehicle Computer System
The future of the In-Vehicle Computer System market is bright, presenting numerous opportunities for growth. The rising popularity of electric vehicles (EVs) and autonomous vehicles will drive demand for more sophisticated IVCS solutions. The integration of advanced sensor technologies, such as LiDAR and radar, will enhance autonomous driving capabilities and safety features. The development of high-bandwidth 5G connectivity will enable advanced applications such as real-time traffic information and remote diagnostics. The expansion of the software-defined vehicle (SDV) concept provides opportunities for flexible and upgradable IVCS architectures.
Major Players in the In Vehicle Computer System Ecosystem
Key Developments in In Vehicle Computer System Industry
- Q1 2023: Lanner Electronics launches a new high-performance IVCS platform with enhanced AI capabilities.
- Q3 2022: S&T AG acquires a smaller IVCS competitor, expanding its market share.
- Q4 2021: New safety regulations in Europe drive increased demand for advanced driver-assistance systems.
Strategic In Vehicle Computer System Market Forecast
The In-Vehicle Computer System market is poised for sustained growth over the forecast period (2025-2033), driven by technological advancements, increased adoption of ADAS and autonomous driving technologies, and supportive regulatory policies. The emergence of new markets, such as commercial vehicles and robotics, further expands the market potential. Continued innovation in areas like AI, 5G connectivity, and high-performance computing will shape the future of IVCS, creating new opportunities for market participants. The market is expected to reach a value of $XX million by 2033, representing a significant expansion compared to its current size.
In Vehicle Computer System Segmentation
-
1. Application
- 1.1. Safety
- 1.2. Entertainment
- 1.3. Navigation
- 1.4. Other
-
2. Type
- 2.1. 8 GB
- 2.2. 16 GB
- 2.3. Above 32 GB
In Vehicle Computer System Segmentation By Geography
-
1. North America
- 1.1. United States
- 1.2. Canada
- 1.3. Mexico
-
2. South America
- 2.1. Brazil
- 2.2. Argentina
- 2.3. Rest of South America
-
3. Europe
- 3.1. United Kingdom
- 3.2. Germany
- 3.3. France
- 3.4. Italy
- 3.5. Spain
- 3.6. Russia
- 3.7. Benelux
- 3.8. Nordics
- 3.9. Rest of Europe
-
4. Middle East & Africa
- 4.1. Turkey
- 4.2. Israel
- 4.3. GCC
- 4.4. North Africa
- 4.5. South Africa
- 4.6. Rest of Middle East & Africa
-
5. Asia Pacific
- 5.1. China
- 5.2. India
- 5.3. Japan
- 5.4. South Korea
- 5.5. ASEAN
- 5.6. Oceania
- 5.7. Rest of Asia Pacific

In Vehicle Computer System Regional Market Share
Geographic Coverage of In Vehicle Computer System
In Vehicle Computer System REPORT HIGHLIGHTS
| Aspects | Details |
|---|---|
| Study Period | 2020-2034 |
| Base Year | 2025 |
| Estimated Year | 2026 |
| Forecast Period | 2026-2034 |
| Historical Period | 2020-2025 |
| Growth Rate | CAGR of XXX% from 2020-2034 |
| Segmentation |
|
Table of Contents
- 1. Introduction
- 1.1. Research Scope
- 1.2. Market Segmentation
- 1.3. Research Methodology
- 1.4. Definitions and Assumptions
- 2. Executive Summary
- 2.1. Introduction
- 3. Market Dynamics
- 3.1. Introduction
- 3.2. Market Drivers
- 3.3. Market Restrains
- 3.4. Market Trends
- 4. Market Factor Analysis
- 4.1. Porters Five Forces
- 4.2. Supply/Value Chain
- 4.3. PESTEL analysis
- 4.4. Market Entropy
- 4.5. Patent/Trademark Analysis
- 5. Global In Vehicle Computer System Analysis, Insights and Forecast, 2020-2032
- 5.1. Market Analysis, Insights and Forecast - by Application
- 5.1.1. Safety
- 5.1.2. Entertainment
- 5.1.3. Navigation
- 5.1.4. Other
- 5.2. Market Analysis, Insights and Forecast - by Type
- 5.2.1. 8 GB
- 5.2.2. 16 GB
- 5.2.3. Above 32 GB
- 5.3. Market Analysis, Insights and Forecast - by Region
- 5.3.1. North America
- 5.3.2. South America
- 5.3.3. Europe
- 5.3.4. Middle East & Africa
- 5.3.5. Asia Pacific
- 5.1. Market Analysis, Insights and Forecast - by Application
- 6. North America In Vehicle Computer System Analysis, Insights and Forecast, 2020-2032
- 6.1. Market Analysis, Insights and Forecast - by Application
- 6.1.1. Safety
- 6.1.2. Entertainment
- 6.1.3. Navigation
- 6.1.4. Other
- 6.2. Market Analysis, Insights and Forecast - by Type
- 6.2.1. 8 GB
- 6.2.2. 16 GB
- 6.2.3. Above 32 GB
- 6.1. Market Analysis, Insights and Forecast - by Application
- 7. South America In Vehicle Computer System Analysis, Insights and Forecast, 2020-2032
- 7.1. Market Analysis, Insights and Forecast - by Application
- 7.1.1. Safety
- 7.1.2. Entertainment
- 7.1.3. Navigation
- 7.1.4. Other
- 7.2. Market Analysis, Insights and Forecast - by Type
- 7.2.1. 8 GB
- 7.2.2. 16 GB
- 7.2.3. Above 32 GB
- 7.1. Market Analysis, Insights and Forecast - by Application
- 8. Europe In Vehicle Computer System Analysis, Insights and Forecast, 2020-2032
- 8.1. Market Analysis, Insights and Forecast - by Application
- 8.1.1. Safety
- 8.1.2. Entertainment
- 8.1.3. Navigation
- 8.1.4. Other
- 8.2. Market Analysis, Insights and Forecast - by Type
- 8.2.1. 8 GB
- 8.2.2. 16 GB
- 8.2.3. Above 32 GB
- 8.1. Market Analysis, Insights and Forecast - by Application
- 9. Middle East & Africa In Vehicle Computer System Analysis, Insights and Forecast, 2020-2032
- 9.1. Market Analysis, Insights and Forecast - by Application
- 9.1.1. Safety
- 9.1.2. Entertainment
- 9.1.3. Navigation
- 9.1.4. Other
- 9.2. Market Analysis, Insights and Forecast - by Type
- 9.2.1. 8 GB
- 9.2.2. 16 GB
- 9.2.3. Above 32 GB
- 9.1. Market Analysis, Insights and Forecast - by Application
- 10. Asia Pacific In Vehicle Computer System Analysis, Insights and Forecast, 2020-2032
- 10.1. Market Analysis, Insights and Forecast - by Application
- 10.1.1. Safety
- 10.1.2. Entertainment
- 10.1.3. Navigation
- 10.1.4. Other
- 10.2. Market Analysis, Insights and Forecast - by Type
- 10.2.1. 8 GB
- 10.2.2. 16 GB
- 10.2.3. Above 32 GB
- 10.1. Market Analysis, Insights and Forecast - by Application
- 11. Competitive Analysis
- 11.1. Global Market Share Analysis 2025
- 11.2. Company Profiles
- 11.2.1 S&T AG
- 11.2.1.1. Overview
- 11.2.1.2. Products
- 11.2.1.3. SWOT Analysis
- 11.2.1.4. Recent Developments
- 11.2.1.5. Financials (Based on Availability)
- 11.2.2 Lanner Electronics
- 11.2.2.1. Overview
- 11.2.2.2. Products
- 11.2.2.3. SWOT Analysis
- 11.2.2.4. Recent Developments
- 11.2.2.5. Financials (Based on Availability)
- 11.2.3 SINTRONES Technology Corporation
- 11.2.3.1. Overview
- 11.2.3.2. Products
- 11.2.3.3. SWOT Analysis
- 11.2.3.4. Recent Developments
- 11.2.3.5. Financials (Based on Availability)
- 11.2.4 NEXCOM International
- 11.2.4.1. Overview
- 11.2.4.2. Products
- 11.2.4.3. SWOT Analysis
- 11.2.4.4. Recent Developments
- 11.2.4.5. Financials (Based on Availability)
- 11.2.5 IBASE Technology
- 11.2.5.1. Overview
- 11.2.5.2. Products
- 11.2.5.3. SWOT Analysis
- 11.2.5.4. Recent Developments
- 11.2.5.5. Financials (Based on Availability)
- 11.2.6 Axiomtek
- 11.2.6.1. Overview
- 11.2.6.2. Products
- 11.2.6.3. SWOT Analysis
- 11.2.6.4. Recent Developments
- 11.2.6.5. Financials (Based on Availability)
- 11.2.1 S&T AG
List of Figures
- Figure 1: Global In Vehicle Computer System Revenue Breakdown (million, %) by Region 2025 & 2033
- Figure 2: North America In Vehicle Computer System Revenue (million), by Application 2025 & 2033
- Figure 3: North America In Vehicle Computer System Revenue Share (%), by Application 2025 & 2033
- Figure 4: North America In Vehicle Computer System Revenue (million), by Type 2025 & 2033
- Figure 5: North America In Vehicle Computer System Revenue Share (%), by Type 2025 & 2033
- Figure 6: North America In Vehicle Computer System Revenue (million), by Country 2025 & 2033
- Figure 7: North America In Vehicle Computer System Revenue Share (%), by Country 2025 & 2033
- Figure 8: South America In Vehicle Computer System Revenue (million), by Application 2025 & 2033
- Figure 9: South America In Vehicle Computer System Revenue Share (%), by Application 2025 & 2033
- Figure 10: South America In Vehicle Computer System Revenue (million), by Type 2025 & 2033
- Figure 11: South America In Vehicle Computer System Revenue Share (%), by Type 2025 & 2033
- Figure 12: South America In Vehicle Computer System Revenue (million), by Country 2025 & 2033
- Figure 13: South America In Vehicle Computer System Revenue Share (%), by Country 2025 & 2033
- Figure 14: Europe In Vehicle Computer System Revenue (million), by Application 2025 & 2033
- Figure 15: Europe In Vehicle Computer System Revenue Share (%), by Application 2025 & 2033
- Figure 16: Europe In Vehicle Computer System Revenue (million), by Type 2025 & 2033
- Figure 17: Europe In Vehicle Computer System Revenue Share (%), by Type 2025 & 2033
- Figure 18: Europe In Vehicle Computer System Revenue (million), by Country 2025 & 2033
- Figure 19: Europe In Vehicle Computer System Revenue Share (%), by Country 2025 & 2033
- Figure 20: Middle East & Africa In Vehicle Computer System Revenue (million), by Application 2025 & 2033
- Figure 21: Middle East & Africa In Vehicle Computer System Revenue Share (%), by Application 2025 & 2033
- Figure 22: Middle East & Africa In Vehicle Computer System Revenue (million), by Type 2025 & 2033
- Figure 23: Middle East & Africa In Vehicle Computer System Revenue Share (%), by Type 2025 & 2033
- Figure 24: Middle East & Africa In Vehicle Computer System Revenue (million), by Country 2025 & 2033
- Figure 25: Middle East & Africa In Vehicle Computer System Revenue Share (%), by Country 2025 & 2033
- Figure 26: Asia Pacific In Vehicle Computer System Revenue (million), by Application 2025 & 2033
- Figure 27: Asia Pacific In Vehicle Computer System Revenue Share (%), by Application 2025 & 2033
- Figure 28: Asia Pacific In Vehicle Computer System Revenue (million), by Type 2025 & 2033
- Figure 29: Asia Pacific In Vehicle Computer System Revenue Share (%), by Type 2025 & 2033
- Figure 30: Asia Pacific In Vehicle Computer System Revenue (million), by Country 2025 & 2033
- Figure 31: Asia Pacific In Vehicle Computer System Revenue Share (%), by Country 2025 & 2033
List of Tables
- Table 1: Global In Vehicle Computer System Revenue million Forecast, by Application 2020 & 2033
- Table 2: Global In Vehicle Computer System Revenue million Forecast, by Type 2020 & 2033
- Table 3: Global In Vehicle Computer System Revenue million Forecast, by Region 2020 & 2033
- Table 4: Global In Vehicle Computer System Revenue million Forecast, by Application 2020 & 2033
- Table 5: Global In Vehicle Computer System Revenue million Forecast, by Type 2020 & 2033
- Table 6: Global In Vehicle Computer System Revenue million Forecast, by Country 2020 & 2033
- Table 7: United States In Vehicle Computer System Revenue (million) Forecast, by Application 2020 & 2033
- Table 8: Canada In Vehicle Computer System Revenue (million) Forecast, by Application 2020 & 2033
- Table 9: Mexico In Vehicle Computer System Revenue (million) Forecast, by Application 2020 & 2033
- Table 10: Global In Vehicle Computer System Revenue million Forecast, by Application 2020 & 2033
- Table 11: Global In Vehicle Computer System Revenue million Forecast, by Type 2020 & 2033
- Table 12: Global In Vehicle Computer System Revenue million Forecast, by Country 2020 & 2033
- Table 13: Brazil In Vehicle Computer System Revenue (million) Forecast, by Application 2020 & 2033
- Table 14: Argentina In Vehicle Computer System Revenue (million) Forecast, by Application 2020 & 2033
- Table 15: Rest of South America In Vehicle Computer System Revenue (million) Forecast, by Application 2020 & 2033
- Table 16: Global In Vehicle Computer System Revenue million Forecast, by Application 2020 & 2033
- Table 17: Global In Vehicle Computer System Revenue million Forecast, by Type 2020 & 2033
- Table 18: Global In Vehicle Computer System Revenue million Forecast, by Country 2020 & 2033
- Table 19: United Kingdom In Vehicle Computer System Revenue (million) Forecast, by Application 2020 & 2033
- Table 20: Germany In Vehicle Computer System Revenue (million) Forecast, by Application 2020 & 2033
- Table 21: France In Vehicle Computer System Revenue (million) Forecast, by Application 2020 & 2033
- Table 22: Italy In Vehicle Computer System Revenue (million) Forecast, by Application 2020 & 2033
- Table 23: Spain In Vehicle Computer System Revenue (million) Forecast, by Application 2020 & 2033
- Table 24: Russia In Vehicle Computer System Revenue (million) Forecast, by Application 2020 & 2033
- Table 25: Benelux In Vehicle Computer System Revenue (million) Forecast, by Application 2020 & 2033
- Table 26: Nordics In Vehicle Computer System Revenue (million) Forecast, by Application 2020 & 2033
- Table 27: Rest of Europe In Vehicle Computer System Revenue (million) Forecast, by Application 2020 & 2033
- Table 28: Global In Vehicle Computer System Revenue million Forecast, by Application 2020 & 2033
- Table 29: Global In Vehicle Computer System Revenue million Forecast, by Type 2020 & 2033
- Table 30: Global In Vehicle Computer System Revenue million Forecast, by Country 2020 & 2033
- Table 31: Turkey In Vehicle Computer System Revenue (million) Forecast, by Application 2020 & 2033
- Table 32: Israel In Vehicle Computer System Revenue (million) Forecast, by Application 2020 & 2033
- Table 33: GCC In Vehicle Computer System Revenue (million) Forecast, by Application 2020 & 2033
- Table 34: North Africa In Vehicle Computer System Revenue (million) Forecast, by Application 2020 & 2033
- Table 35: South Africa In Vehicle Computer System Revenue (million) Forecast, by Application 2020 & 2033
- Table 36: Rest of Middle East & Africa In Vehicle Computer System Revenue (million) Forecast, by Application 2020 & 2033
- Table 37: Global In Vehicle Computer System Revenue million Forecast, by Application 2020 & 2033
- Table 38: Global In Vehicle Computer System Revenue million Forecast, by Type 2020 & 2033
- Table 39: Global In Vehicle Computer System Revenue million Forecast, by Country 2020 & 2033
- Table 40: China In Vehicle Computer System Revenue (million) Forecast, by Application 2020 & 2033
- Table 41: India In Vehicle Computer System Revenue (million) Forecast, by Application 2020 & 2033
- Table 42: Japan In Vehicle Computer System Revenue (million) Forecast, by Application 2020 & 2033
- Table 43: South Korea In Vehicle Computer System Revenue (million) Forecast, by Application 2020 & 2033
- Table 44: ASEAN In Vehicle Computer System Revenue (million) Forecast, by Application 2020 & 2033
- Table 45: Oceania In Vehicle Computer System Revenue (million) Forecast, by Application 2020 & 2033
- Table 46: Rest of Asia Pacific In Vehicle Computer System Revenue (million) Forecast, by Application 2020 & 2033
Frequently Asked Questions
1. What is the projected Compound Annual Growth Rate (CAGR) of the In Vehicle Computer System?
The projected CAGR is approximately XXX%.
2. Which companies are prominent players in the In Vehicle Computer System?
Key companies in the market include S&T AG, Lanner Electronics, SINTRONES Technology Corporation, NEXCOM International, IBASE Technology, Axiomtek.
3. What are the main segments of the In Vehicle Computer System?
The market segments include Application, Type.
4. Can you provide details about the market size?
The market size is estimated to be USD XXX million as of 2022.
5. What are some drivers contributing to market growth?
N/A
6. What are the notable trends driving market growth?
N/A
7. Are there any restraints impacting market growth?
N/A
8. Can you provide examples of recent developments in the market?
N/A
9. What pricing options are available for accessing the report?
Pricing options include single-user, multi-user, and enterprise licenses priced at USD 3950.00, USD 5925.00, and USD 7900.00 respectively.
10. Is the market size provided in terms of value or volume?
The market size is provided in terms of value, measured in million.
11. Are there any specific market keywords associated with the report?
Yes, the market keyword associated with the report is "In Vehicle Computer System," which aids in identifying and referencing the specific market segment covered.
12. How do I determine which pricing option suits my needs best?
The pricing options vary based on user requirements and access needs. Individual users may opt for single-user licenses, while businesses requiring broader access may choose multi-user or enterprise licenses for cost-effective access to the report.
13. Are there any additional resources or data provided in the In Vehicle Computer System report?
While the report offers comprehensive insights, it's advisable to review the specific contents or supplementary materials provided to ascertain if additional resources or data are available.
14. How can I stay updated on further developments or reports in the In Vehicle Computer System?
To stay informed about further developments, trends, and reports in the In Vehicle Computer System, consider subscribing to industry newsletters, following relevant companies and organizations, or regularly checking reputable industry news sources and publications.
Methodology
Step 1 - Identification of Relevant Samples Size from Population Database


Step 2 - Approaches for Defining Global Market Size (Value, Volume* & Price*)

Note*: In applicable scenarios
Step 3 - Data Sources
Primary Research
- Web Analytics
- Survey Reports
- Research Institute
- Latest Research Reports
- Opinion Leaders
Secondary Research
- Annual Reports
- White Paper
- Latest Press Release
- Industry Association
- Paid Database
- Investor Presentations

Step 4 - Data Triangulation
Involves using different sources of information in order to increase the validity of a study
These sources are likely to be stakeholders in a program - participants, other researchers, program staff, other community members, and so on.
Then we put all data in single framework & apply various statistical tools to find out the dynamic on the market.
During the analysis stage, feedback from the stakeholder groups would be compared to determine areas of agreement as well as areas of divergence