

Key Insights
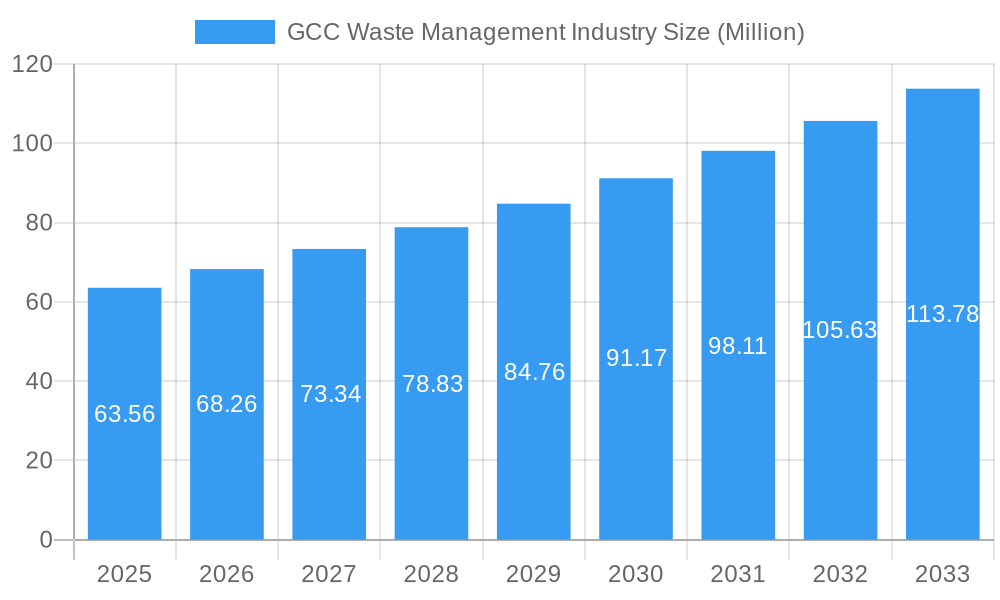
The GCC waste management market, valued at $63.56 million in 2025, is experiencing robust growth, projected to expand at a CAGR of 7.38% from 2025 to 2033. This surge is driven by several factors. Increasing urbanization and population density across the Gulf Cooperation Council (GCC) nations generate substantial waste volumes, necessitating advanced waste management solutions. Stringent government regulations aimed at improving environmental sustainability and promoting recycling initiatives are further propelling market growth. Tourism's expansion in the region also contributes significantly, adding to waste generation and the demand for efficient waste handling. Furthermore, rising environmental awareness among citizens and corporations is fostering a greater focus on sustainable waste disposal practices, creating a favorable environment for industry growth. Key players like Averda, Suez, Veolia, and Bee'ah are actively shaping the market landscape through technological innovations, strategic partnerships, and expanding service offerings. However, challenges remain, including the high cost of implementing advanced waste management technologies and the need for consistent infrastructure development across the region to support efficient waste collection and processing.
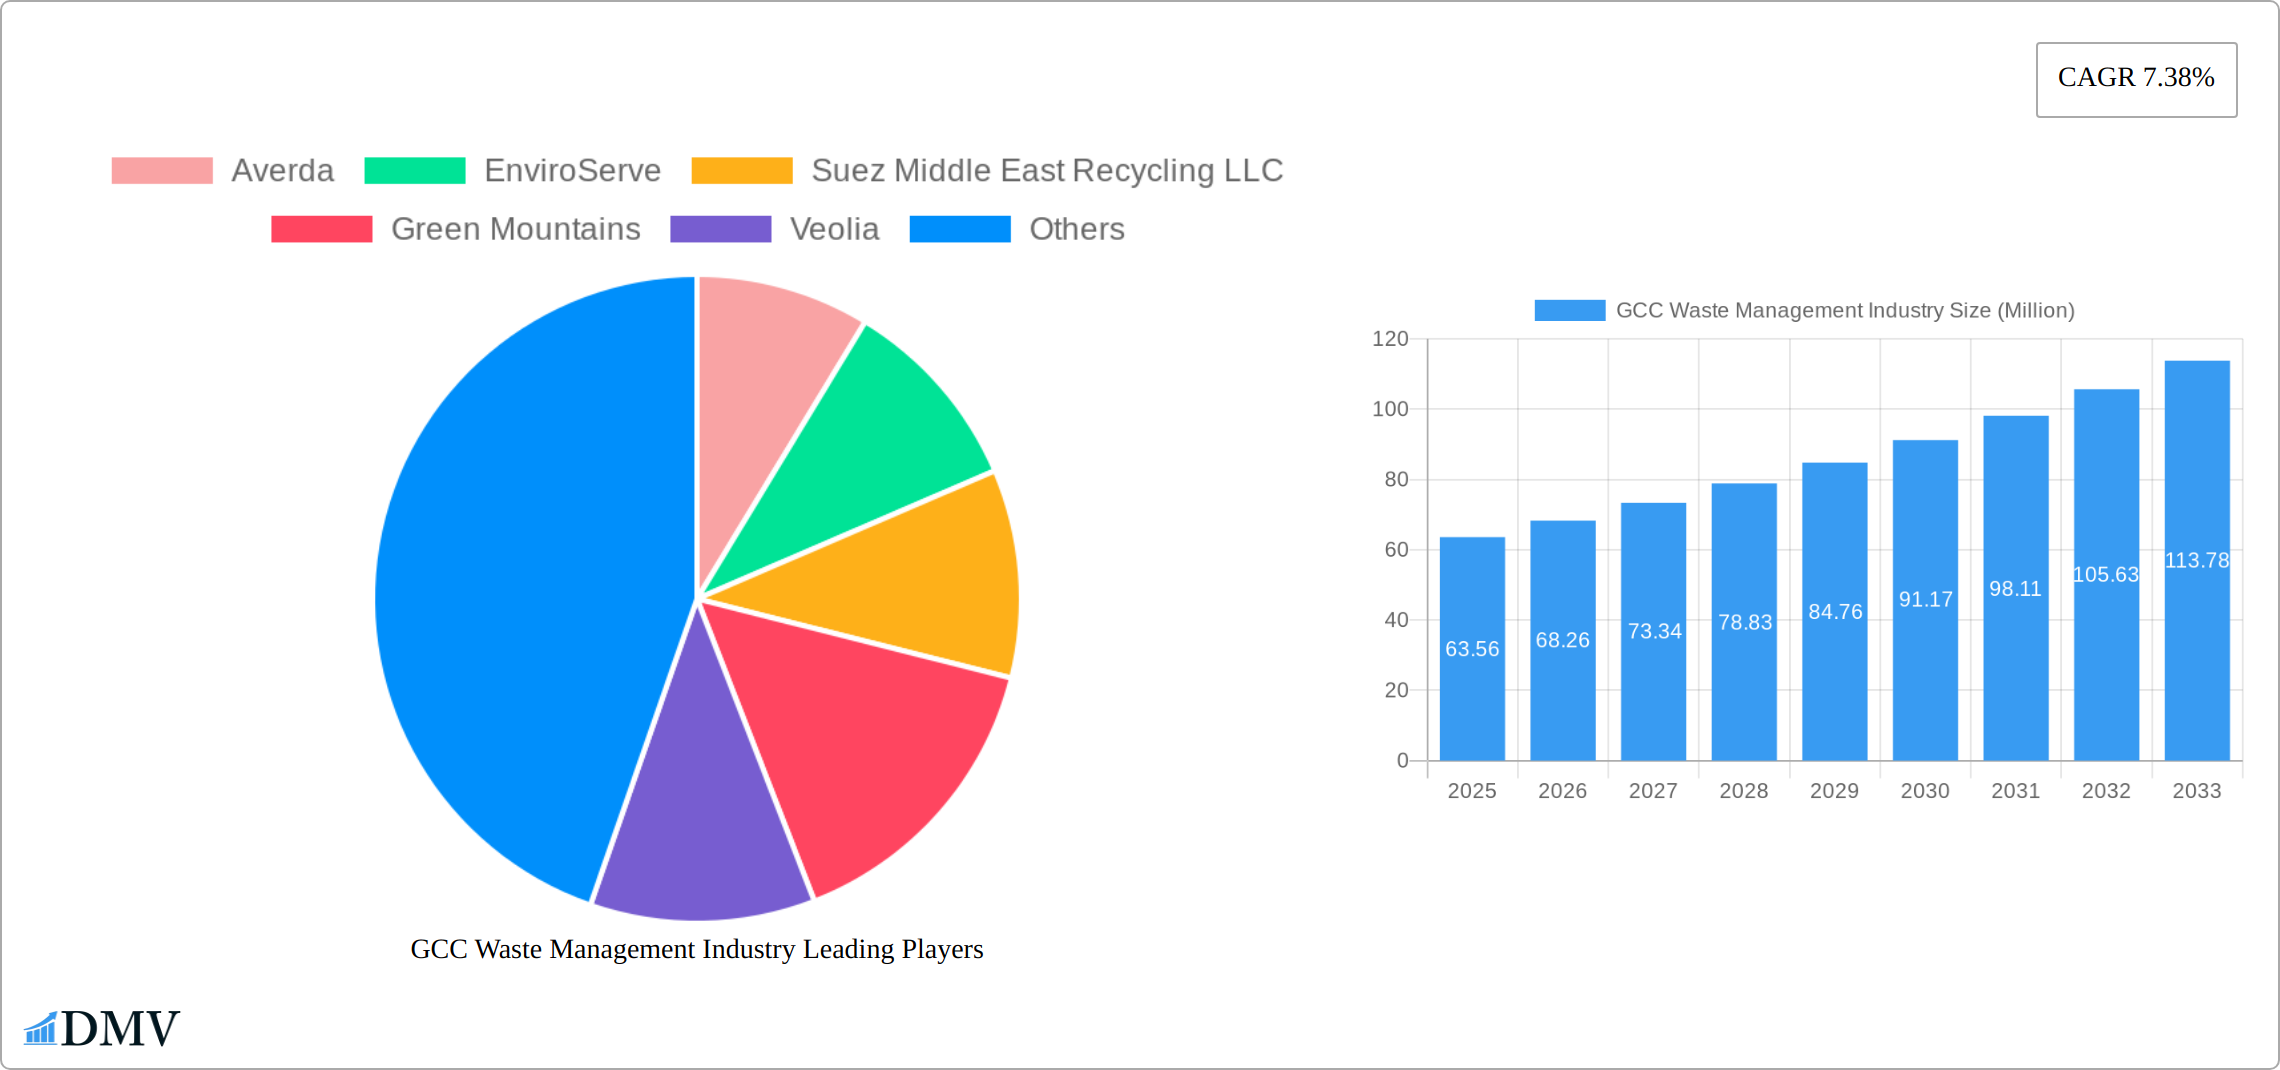
GCC Waste Management Industry Market Size (In Million)
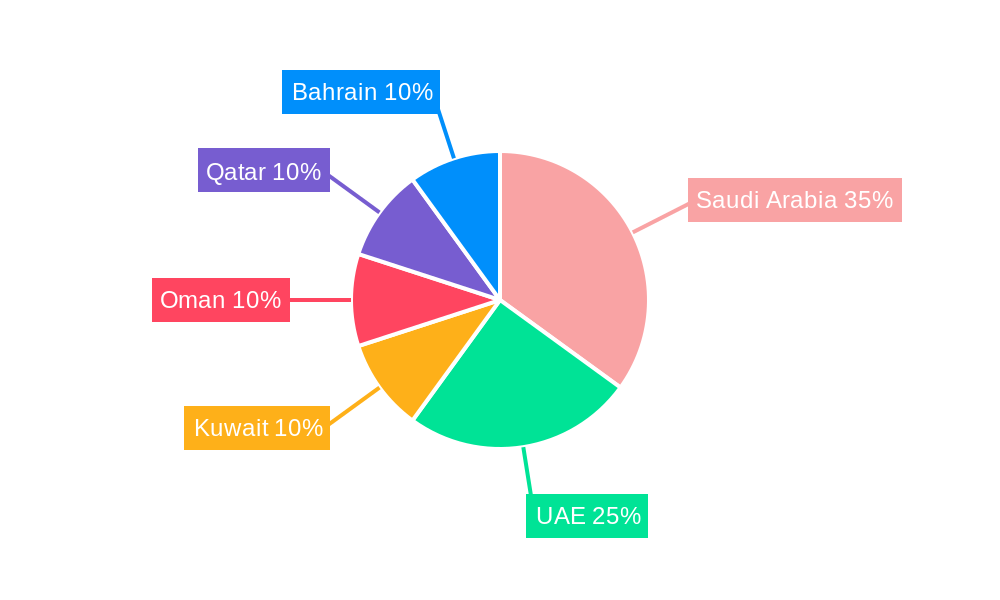
The competitive landscape is characterized by a mix of international and regional players. International companies bring advanced technologies and expertise, while local firms possess a strong understanding of regional nuances and regulatory frameworks. The market is segmented based on waste type (municipal solid waste, industrial waste, hazardous waste), waste management services (collection, transportation, processing, recycling, disposal), and geographic location (Saudi Arabia, UAE, Kuwait, Oman, Bahrain, Qatar). While precise segmental data is unavailable, it's reasonable to assume that municipal solid waste management constitutes a significant portion of the market, given the region's urbanization rate and tourism. Future growth will likely be driven by increased investment in recycling and renewable energy generation from waste, aligning with the GCC's broader sustainability goals. The forecast period (2025-2033) anticipates continuous market expansion fueled by consistent economic growth and environmental initiatives within the GCC.
GCC Waste Management Industry Company Market Share
GCC Waste Management Industry: A Comprehensive Market Report (2019-2033)
This insightful report provides a detailed analysis of the GCC waste management industry, encompassing market trends, key players, technological advancements, and future growth prospects. With a study period spanning 2019-2033, a base year of 2025, and a forecast period of 2025-2033, this report offers invaluable insights for stakeholders seeking to navigate this dynamic sector. The market is valued at xx Million in 2025 and is projected to reach xx Million by 2033.
GCC Waste Management Industry Market Composition & Trends
The GCC waste management market is experiencing significant transformation, driven by factors such as increasing urbanization, stringent government regulations, and growing environmental awareness. Market concentration is moderate, with several large players vying for market share alongside numerous smaller, specialized firms. Key segments include municipal solid waste (MSW) management, industrial waste management, and hazardous waste management. The market is characterized by ongoing consolidation, with mergers and acquisitions (M&A) playing a significant role in shaping the competitive landscape. Recent M&A deal values have ranged from xx Million to xx Million, reflecting the significant investment in the sector.
- Market Share Distribution (2025): Averda (xx%), Bee'ah (xx%), Suez Middle East Recycling LLC (xx%), Veolia (xx%), Others (xx%). (Note: These figures are estimates based on available data).
- Innovation Catalysts: Technological advancements in waste-to-energy, recycling technologies, and smart waste management solutions are driving innovation.
- Regulatory Landscape: Stringent environmental regulations and government initiatives promoting sustainable waste management practices are shaping market dynamics.
- Substitute Products: Limited substitutes exist, however, advancements in biodegradation and waste reduction technologies present some alternatives.
- End-User Profiles: Municipal corporations, industrial facilities, and commercial businesses represent the primary end-users.
- M&A Activities: Consolidation is evident, with larger players acquiring smaller companies to expand their geographic reach and service offerings.
GCC Waste Management Industry Industry Evolution
The GCC waste management industry has experienced a transformative evolution over the past decade, marked by significant growth and increasing sophistication. This impressive trajectory is underpinned by several key factors: rapid urbanization leading to increased waste generation, and a growing regional emphasis on environmental stewardship and sustainability. The adoption of cutting-edge technologies has been a pivotal catalyst, with advancements in areas such as automated sorting systems, advanced waste-to-energy (WtE) facilities, and innovative recycling processes dramatically enhancing operational efficiency and environmental outcomes. Concurrently, a palpable shift in consumer attitudes towards eco-conscious waste management solutions is actively shaping market dynamics and business strategies.
Looking ahead, the market is projected for robust expansion, with an estimated Compound Annual Growth Rate (CAGR) of xx% from 2025 to 2033. This growth will be further propelled by substantial government investments in modern waste management infrastructure and the progressive enforcement of stringent environmental regulations across the GCC. The integration of sophisticated waste management technologies, including AI-powered waste sorting systems, is on an upward trend, with an anticipated adoption rate of xx% by 2025, signaling a move towards more intelligent and data-driven waste management practices.
Leading Regions, Countries, or Segments in GCC Waste Management Industry
The United Arab Emirates (UAE) and Saudi Arabia currently stand as frontrunners in the GCC waste management market. This leadership is largely attributable to their substantial commitments to infrastructure development and the implementation of supportive and forward-thinking regulatory frameworks. Both nations are experiencing vigorous growth across both municipal solid waste (MSW) and industrial waste management sectors, reflecting a comprehensive approach to waste handling.
- Key Drivers (UAE & Saudi Arabia):
- Significant and sustained government investments in state-of-the-art waste management infrastructure projects.
- Rigorous environmental regulations and proactive policies that actively promote and mandate sustainable waste management practices.
- A high degree of private sector engagement and attractive opportunities for foreign direct investment (FDI), fostering innovation and capital infusion.
- Accelerated adoption of advanced and innovative waste management technologies, enhancing efficiency and environmental performance.
- Dominance Factors: The substantial population base, consequently high waste generation rates, and demonstrably proactive governmental initiatives are the primary contributors to the market dominance of the UAE and Saudi Arabia. Furthermore, significant strategic investments in pioneering technologies and a robust and engaged private sector presence are instrumental in shaping and advancing the sector's development and capabilities.
GCC Waste Management Industry Product Innovations
Recent innovations include the development of advanced sorting technologies to increase recycling rates, waste-to-energy plants converting waste into renewable energy, and smart bins that optimize waste collection routes and improve efficiency. These innovations enhance operational efficiency, reduce environmental impact, and contribute to the overall sustainability of waste management practices within the GCC. The key selling proposition of these technologies revolves around improved efficiency, cost reduction, and sustainability.
Propelling Factors for GCC Waste Management Industry Growth
The GCC waste management industry's growth is propelled by several key factors: rising urbanization resulting in increased waste generation; stringent government regulations promoting sustainable waste management; growing environmental awareness among citizens; and significant investments in advanced waste management technologies such as AI-powered waste sorting systems and anaerobic digestion plants. Furthermore, government initiatives focused on public-private partnerships are also driving growth.
Obstacles in the GCC Waste Management Industry Market
Despite the industry's impressive growth, several challenges persist within the GCC waste management landscape. These include the substantial initial capital investment required for the deployment of advanced technologies, a localized scarcity of skilled labor in certain operational areas, and the inherent volatility of oil prices which can impact operational costs across various segments of the industry. Furthermore, achieving higher recycling rates remains a significant hurdle, often due to limitations in existing infrastructure and the need for enhanced public participation in effective waste segregation at the source. The presence and operation of informal waste sectors also present a complex challenge, potentially impacting the overall sustainability, economic viability, and operational efficiency of the formalized sector.
Future Opportunities in GCC Waste Management Industry
Future opportunities lie in expanding waste-to-energy capacity, developing innovative recycling technologies, exploring circular economy models, and increasing private sector participation through public-private partnerships. Furthermore, the increasing focus on sustainable solutions within various industrial sectors presents vast potential.
Major Players in the GCC Waste Management Industry Ecosystem
- Averda
- EnviroServe
- Suez Middle East Recycling LLC
- Green Mountains
- Veolia
- Blue LLC
- Envac
- SEPCO Environment
- Wasco
- Saudi Investment Recycling Company
- Dulsco Waste Management Services
- Bee'ah
- Power Waste Management and Transport LLC
- Al Haya Enviro
- Bin-Ovation
- United Waste Management Company
- Kuwait Waste Collection and Recycling Company (List Not Exhaustive)
Key Developments in GCC Waste Management Industry Industry
- December 2023: Wardwizard Innovations and Mobility partnered with BEEAH Group to promote electric vehicles in the GCC and Africa, signifying a move towards sustainable transportation within the waste management sector.
- October 2022: Marafiq commenced construction of a new sewage treatment plant at Jeddah Airport II, highlighting significant investment in wastewater management infrastructure.
- September 2022: A USD 1.48 Billion public-private partnership contract was awarded for a large-scale sewage treatment facility in Qatar, demonstrating strong government commitment to water and waste management.
Strategic GCC Waste Management Industry Market Forecast
The GCC waste management industry is strongly positioned for continued and sustained growth, driven by ongoing urbanization trends, a rising tide of environmental consciousness among the populace, and unwavering government support for sustainable practices. The strategic implementation of innovative technologies, coupled with well-structured public-private partnerships, will act as significant accelerators for market expansion. Future opportunities are particularly promising in the development and integration of circular economy models, which aim to minimize waste and maximize resource utilization. The widespread adoption of smart technologies for enhanced waste management efficiency, including intelligent collection routes and real-time monitoring, is also expected to contribute significantly to the market's value appreciation over the coming decade.
GCC Waste Management Industry Segmentation
-
1. Waste Type
- 1.1. Industrial Waste
- 1.2. Municipal Solid Waste
- 1.3. Hazardous Waste
- 1.4. E-Waste
- 1.5. Plastic Waste
- 1.6. Bio-Medical Waste
-
2. Disposal Method
- 2.1. Collection
- 2.2. Landfills
- 2.3. Incineration
- 2.4. Recycling
GCC Waste Management Industry Segmentation By Geography
-
1. North America
- 1.1. United States
- 1.2. Canada
- 1.3. Mexico
-
2. South America
- 2.1. Brazil
- 2.2. Argentina
- 2.3. Rest of South America
-
3. Europe
- 3.1. United Kingdom
- 3.2. Germany
- 3.3. France
- 3.4. Italy
- 3.5. Spain
- 3.6. Russia
- 3.7. Benelux
- 3.8. Nordics
- 3.9. Rest of Europe
-
4. Middle East & Africa
- 4.1. Turkey
- 4.2. Israel
- 4.3. GCC
- 4.4. North Africa
- 4.5. South Africa
- 4.6. Rest of Middle East & Africa
-
5. Asia Pacific
- 5.1. China
- 5.2. India
- 5.3. Japan
- 5.4. South Korea
- 5.5. ASEAN
- 5.6. Oceania
- 5.7. Rest of Asia Pacific
GCC Waste Management Industry Regional Market Share
Geographic Coverage of GCC Waste Management Industry
GCC Waste Management Industry REPORT HIGHLIGHTS
| Aspects | Details |
|---|---|
| Study Period | 2020-2034 |
| Base Year | 2025 |
| Estimated Year | 2026 |
| Forecast Period | 2026-2034 |
| Historical Period | 2020-2025 |
| Growth Rate | CAGR of 7.38% from 2020-2034 |
| Segmentation |
|
Table of Contents
- 1. Introduction
- 1.1. Research Scope
- 1.2. Market Segmentation
- 1.3. Research Objective
- 1.4. Definitions and Assumptions
- 2. Executive Summary
- 2.1. Market Snapshot
- 3. Market Dynamics
- 3.1. Market Drivers
- 3.2. Market Restrains
- 3.3. Market Trends
- 3.4. Market Opportunities
- 4. Market Factor Analysis
- 4.1. Porters Five Forces
- 4.1.1. Bargaining Power of Suppliers
- 4.1.2. Bargaining Power of Buyers
- 4.1.3. Threat of New Entrants
- 4.1.4. Threat of Substitutes
- 4.1.5. Competitive Rivalry
- 4.2. PESTEL analysis
- 4.3. BCG Analysis
- 4.3.1. Stars (High Growth, High Market Share)
- 4.3.2. Cash Cows (Low Growth, High Market Share)
- 4.3.3. Question Mark (High Growth, Low Market Share)
- 4.3.4. Dogs (Low Growth, Low Market Share)
- 4.4. Ansoff Matrix Analysis
- 4.5. Supply Chain Analysis
- 4.6. Regulatory Landscape
- 4.7. Current Market Potential and Opportunity Assessment (TAM–SAM–SOM Framework)
- 4.8. DMV Analyst Note
- 4.1. Porters Five Forces
- 5. Market Analysis, Insights and Forecast 2021-2033
- 5.1. Market Analysis, Insights and Forecast - by Waste Type
- 5.1.1. Industrial Waste
- 5.1.2. Municipal Solid Waste
- 5.1.3. Hazardous Waste
- 5.1.4. E-Waste
- 5.1.5. Plastic Waste
- 5.1.6. Bio-Medical Waste
- 5.2. Market Analysis, Insights and Forecast - by Disposal Method
- 5.2.1. Collection
- 5.2.2. Landfills
- 5.2.3. Incineration
- 5.2.4. Recycling
- 5.3. Market Analysis, Insights and Forecast - by Region
- 5.3.1. North America
- 5.3.2. South America
- 5.3.3. Europe
- 5.3.4. Middle East & Africa
- 5.3.5. Asia Pacific
- 5.1. Market Analysis, Insights and Forecast - by Waste Type
- 6. Global GCC Waste Management Industry Analysis, Insights and Forecast, 2021-2033
- 6.1. Market Analysis, Insights and Forecast - by Waste Type
- 6.1.1. Industrial Waste
- 6.1.2. Municipal Solid Waste
- 6.1.3. Hazardous Waste
- 6.1.4. E-Waste
- 6.1.5. Plastic Waste
- 6.1.6. Bio-Medical Waste
- 6.2. Market Analysis, Insights and Forecast - by Disposal Method
- 6.2.1. Collection
- 6.2.2. Landfills
- 6.2.3. Incineration
- 6.2.4. Recycling
- 6.1. Market Analysis, Insights and Forecast - by Waste Type
- 7. North America GCC Waste Management Industry Analysis, Insights and Forecast, 2020-2032
- 7.1. Market Analysis, Insights and Forecast - by Waste Type
- 7.1.1. Industrial Waste
- 7.1.2. Municipal Solid Waste
- 7.1.3. Hazardous Waste
- 7.1.4. E-Waste
- 7.1.5. Plastic Waste
- 7.1.6. Bio-Medical Waste
- 7.2. Market Analysis, Insights and Forecast - by Disposal Method
- 7.2.1. Collection
- 7.2.2. Landfills
- 7.2.3. Incineration
- 7.2.4. Recycling
- 7.1. Market Analysis, Insights and Forecast - by Waste Type
- 8. South America GCC Waste Management Industry Analysis, Insights and Forecast, 2020-2032
- 8.1. Market Analysis, Insights and Forecast - by Waste Type
- 8.1.1. Industrial Waste
- 8.1.2. Municipal Solid Waste
- 8.1.3. Hazardous Waste
- 8.1.4. E-Waste
- 8.1.5. Plastic Waste
- 8.1.6. Bio-Medical Waste
- 8.2. Market Analysis, Insights and Forecast - by Disposal Method
- 8.2.1. Collection
- 8.2.2. Landfills
- 8.2.3. Incineration
- 8.2.4. Recycling
- 8.1. Market Analysis, Insights and Forecast - by Waste Type
- 9. Europe GCC Waste Management Industry Analysis, Insights and Forecast, 2020-2032
- 9.1. Market Analysis, Insights and Forecast - by Waste Type
- 9.1.1. Industrial Waste
- 9.1.2. Municipal Solid Waste
- 9.1.3. Hazardous Waste
- 9.1.4. E-Waste
- 9.1.5. Plastic Waste
- 9.1.6. Bio-Medical Waste
- 9.2. Market Analysis, Insights and Forecast - by Disposal Method
- 9.2.1. Collection
- 9.2.2. Landfills
- 9.2.3. Incineration
- 9.2.4. Recycling
- 9.1. Market Analysis, Insights and Forecast - by Waste Type
- 10. Middle East & Africa GCC Waste Management Industry Analysis, Insights and Forecast, 2020-2032
- 10.1. Market Analysis, Insights and Forecast - by Waste Type
- 10.1.1. Industrial Waste
- 10.1.2. Municipal Solid Waste
- 10.1.3. Hazardous Waste
- 10.1.4. E-Waste
- 10.1.5. Plastic Waste
- 10.1.6. Bio-Medical Waste
- 10.2. Market Analysis, Insights and Forecast - by Disposal Method
- 10.2.1. Collection
- 10.2.2. Landfills
- 10.2.3. Incineration
- 10.2.4. Recycling
- 10.1. Market Analysis, Insights and Forecast - by Waste Type
- 11. Asia Pacific GCC Waste Management Industry Analysis, Insights and Forecast, 2020-2032
- 11.1. Market Analysis, Insights and Forecast - by Waste Type
- 11.1.1. Industrial Waste
- 11.1.2. Municipal Solid Waste
- 11.1.3. Hazardous Waste
- 11.1.4. E-Waste
- 11.1.5. Plastic Waste
- 11.1.6. Bio-Medical Waste
- 11.2. Market Analysis, Insights and Forecast - by Disposal Method
- 11.2.1. Collection
- 11.2.2. Landfills
- 11.2.3. Incineration
- 11.2.4. Recycling
- 11.1. Market Analysis, Insights and Forecast - by Waste Type
- 12. Competitive Analysis
- 12.1. Company Profiles
- 12.1.1 Averda
- 12.1.1.1. Company Overview
- 12.1.1.2. Products
- 12.1.1.3. Company Financials
- 12.1.1.4. SWOT Analysis
- 12.1.2 EnviroServe
- 12.1.2.1. Company Overview
- 12.1.2.2. Products
- 12.1.2.3. Company Financials
- 12.1.2.4. SWOT Analysis
- 12.1.3 Suez Middle East Recycling LLC
- 12.1.3.1. Company Overview
- 12.1.3.2. Products
- 12.1.3.3. Company Financials
- 12.1.3.4. SWOT Analysis
- 12.1.4 Green Mountains
- 12.1.4.1. Company Overview
- 12.1.4.2. Products
- 12.1.4.3. Company Financials
- 12.1.4.4. SWOT Analysis
- 12.1.5 Veolia
- 12.1.5.1. Company Overview
- 12.1.5.2. Products
- 12.1.5.3. Company Financials
- 12.1.5.4. SWOT Analysis
- 12.1.6 Blue LLC
- 12.1.6.1. Company Overview
- 12.1.6.2. Products
- 12.1.6.3. Company Financials
- 12.1.6.4. SWOT Analysis
- 12.1.7 Envac
- 12.1.7.1. Company Overview
- 12.1.7.2. Products
- 12.1.7.3. Company Financials
- 12.1.7.4. SWOT Analysis
- 12.1.8 SEPCO Environment
- 12.1.8.1. Company Overview
- 12.1.8.2. Products
- 12.1.8.3. Company Financials
- 12.1.8.4. SWOT Analysis
- 12.1.9 Wasco
- 12.1.9.1. Company Overview
- 12.1.9.2. Products
- 12.1.9.3. Company Financials
- 12.1.9.4. SWOT Analysis
- 12.1.10 Saudi Investment Recycling Company
- 12.1.10.1. Company Overview
- 12.1.10.2. Products
- 12.1.10.3. Company Financials
- 12.1.10.4. SWOT Analysis
- 12.1.11 Dulsco Waste Management Services
- 12.1.11.1. Company Overview
- 12.1.11.2. Products
- 12.1.11.3. Company Financials
- 12.1.11.4. SWOT Analysis
- 12.1.12 Bee'ah
- 12.1.12.1. Company Overview
- 12.1.12.2. Products
- 12.1.12.3. Company Financials
- 12.1.12.4. SWOT Analysis
- 12.1.13 Power Waste Management and Transport LLC
- 12.1.13.1. Company Overview
- 12.1.13.2. Products
- 12.1.13.3. Company Financials
- 12.1.13.4. SWOT Analysis
- 12.1.14 Al Haya Enviro
- 12.1.14.1. Company Overview
- 12.1.14.2. Products
- 12.1.14.3. Company Financials
- 12.1.14.4. SWOT Analysis
- 12.1.15 Bin-Ovation
- 12.1.15.1. Company Overview
- 12.1.15.2. Products
- 12.1.15.3. Company Financials
- 12.1.15.4. SWOT Analysis
- 12.1.16 United Waste Management Company
- 12.1.16.1. Company Overview
- 12.1.16.2. Products
- 12.1.16.3. Company Financials
- 12.1.16.4. SWOT Analysis
- 12.1.17 Kuwait Waste Collection and Recycling Company**List Not Exhaustive
- 12.1.17.1. Company Overview
- 12.1.17.2. Products
- 12.1.17.3. Company Financials
- 12.1.17.4. SWOT Analysis
- 12.1.1 Averda
- 12.2. Market Entropy
- 12.2.1 Company's Key Areas Served
- 12.2.2 Recent Developments
- 12.3. Company Market Share Analysis 2025
- 12.3.1 Top 5 Companies Market Share Analysis
- 12.3.2 Top 3 Companies Market Share Analysis
- 12.4. List of Potential Customers
- 13. Research Methodology
List of Figures
- Figure 1: Global GCC Waste Management Industry Revenue Breakdown (Million, %) by Region 2025 & 2033
- Figure 2: Global GCC Waste Management Industry Volume Breakdown (Billion, %) by Region 2025 & 2033
- Figure 3: North America GCC Waste Management Industry Revenue (Million), by Waste Type 2025 & 2033
- Figure 4: North America GCC Waste Management Industry Volume (Billion), by Waste Type 2025 & 2033
- Figure 5: North America GCC Waste Management Industry Revenue Share (%), by Waste Type 2025 & 2033
- Figure 6: North America GCC Waste Management Industry Volume Share (%), by Waste Type 2025 & 2033
- Figure 7: North America GCC Waste Management Industry Revenue (Million), by Disposal Method 2025 & 2033
- Figure 8: North America GCC Waste Management Industry Volume (Billion), by Disposal Method 2025 & 2033
- Figure 9: North America GCC Waste Management Industry Revenue Share (%), by Disposal Method 2025 & 2033
- Figure 10: North America GCC Waste Management Industry Volume Share (%), by Disposal Method 2025 & 2033
- Figure 11: North America GCC Waste Management Industry Revenue (Million), by Country 2025 & 2033
- Figure 12: North America GCC Waste Management Industry Volume (Billion), by Country 2025 & 2033
- Figure 13: North America GCC Waste Management Industry Revenue Share (%), by Country 2025 & 2033
- Figure 14: North America GCC Waste Management Industry Volume Share (%), by Country 2025 & 2033
- Figure 15: South America GCC Waste Management Industry Revenue (Million), by Waste Type 2025 & 2033
- Figure 16: South America GCC Waste Management Industry Volume (Billion), by Waste Type 2025 & 2033
- Figure 17: South America GCC Waste Management Industry Revenue Share (%), by Waste Type 2025 & 2033
- Figure 18: South America GCC Waste Management Industry Volume Share (%), by Waste Type 2025 & 2033
- Figure 19: South America GCC Waste Management Industry Revenue (Million), by Disposal Method 2025 & 2033
- Figure 20: South America GCC Waste Management Industry Volume (Billion), by Disposal Method 2025 & 2033
- Figure 21: South America GCC Waste Management Industry Revenue Share (%), by Disposal Method 2025 & 2033
- Figure 22: South America GCC Waste Management Industry Volume Share (%), by Disposal Method 2025 & 2033
- Figure 23: South America GCC Waste Management Industry Revenue (Million), by Country 2025 & 2033
- Figure 24: South America GCC Waste Management Industry Volume (Billion), by Country 2025 & 2033
- Figure 25: South America GCC Waste Management Industry Revenue Share (%), by Country 2025 & 2033
- Figure 26: South America GCC Waste Management Industry Volume Share (%), by Country 2025 & 2033
- Figure 27: Europe GCC Waste Management Industry Revenue (Million), by Waste Type 2025 & 2033
- Figure 28: Europe GCC Waste Management Industry Volume (Billion), by Waste Type 2025 & 2033
- Figure 29: Europe GCC Waste Management Industry Revenue Share (%), by Waste Type 2025 & 2033
- Figure 30: Europe GCC Waste Management Industry Volume Share (%), by Waste Type 2025 & 2033
- Figure 31: Europe GCC Waste Management Industry Revenue (Million), by Disposal Method 2025 & 2033
- Figure 32: Europe GCC Waste Management Industry Volume (Billion), by Disposal Method 2025 & 2033
- Figure 33: Europe GCC Waste Management Industry Revenue Share (%), by Disposal Method 2025 & 2033
- Figure 34: Europe GCC Waste Management Industry Volume Share (%), by Disposal Method 2025 & 2033
- Figure 35: Europe GCC Waste Management Industry Revenue (Million), by Country 2025 & 2033
- Figure 36: Europe GCC Waste Management Industry Volume (Billion), by Country 2025 & 2033
- Figure 37: Europe GCC Waste Management Industry Revenue Share (%), by Country 2025 & 2033
- Figure 38: Europe GCC Waste Management Industry Volume Share (%), by Country 2025 & 2033
- Figure 39: Middle East & Africa GCC Waste Management Industry Revenue (Million), by Waste Type 2025 & 2033
- Figure 40: Middle East & Africa GCC Waste Management Industry Volume (Billion), by Waste Type 2025 & 2033
- Figure 41: Middle East & Africa GCC Waste Management Industry Revenue Share (%), by Waste Type 2025 & 2033
- Figure 42: Middle East & Africa GCC Waste Management Industry Volume Share (%), by Waste Type 2025 & 2033
- Figure 43: Middle East & Africa GCC Waste Management Industry Revenue (Million), by Disposal Method 2025 & 2033
- Figure 44: Middle East & Africa GCC Waste Management Industry Volume (Billion), by Disposal Method 2025 & 2033
- Figure 45: Middle East & Africa GCC Waste Management Industry Revenue Share (%), by Disposal Method 2025 & 2033
- Figure 46: Middle East & Africa GCC Waste Management Industry Volume Share (%), by Disposal Method 2025 & 2033
- Figure 47: Middle East & Africa GCC Waste Management Industry Revenue (Million), by Country 2025 & 2033
- Figure 48: Middle East & Africa GCC Waste Management Industry Volume (Billion), by Country 2025 & 2033
- Figure 49: Middle East & Africa GCC Waste Management Industry Revenue Share (%), by Country 2025 & 2033
- Figure 50: Middle East & Africa GCC Waste Management Industry Volume Share (%), by Country 2025 & 2033
- Figure 51: Asia Pacific GCC Waste Management Industry Revenue (Million), by Waste Type 2025 & 2033
- Figure 52: Asia Pacific GCC Waste Management Industry Volume (Billion), by Waste Type 2025 & 2033
- Figure 53: Asia Pacific GCC Waste Management Industry Revenue Share (%), by Waste Type 2025 & 2033
- Figure 54: Asia Pacific GCC Waste Management Industry Volume Share (%), by Waste Type 2025 & 2033
- Figure 55: Asia Pacific GCC Waste Management Industry Revenue (Million), by Disposal Method 2025 & 2033
- Figure 56: Asia Pacific GCC Waste Management Industry Volume (Billion), by Disposal Method 2025 & 2033
- Figure 57: Asia Pacific GCC Waste Management Industry Revenue Share (%), by Disposal Method 2025 & 2033
- Figure 58: Asia Pacific GCC Waste Management Industry Volume Share (%), by Disposal Method 2025 & 2033
- Figure 59: Asia Pacific GCC Waste Management Industry Revenue (Million), by Country 2025 & 2033
- Figure 60: Asia Pacific GCC Waste Management Industry Volume (Billion), by Country 2025 & 2033
- Figure 61: Asia Pacific GCC Waste Management Industry Revenue Share (%), by Country 2025 & 2033
- Figure 62: Asia Pacific GCC Waste Management Industry Volume Share (%), by Country 2025 & 2033
List of Tables
- Table 1: Global GCC Waste Management Industry Revenue Million Forecast, by Waste Type 2020 & 2033
- Table 2: Global GCC Waste Management Industry Volume Billion Forecast, by Waste Type 2020 & 2033
- Table 3: Global GCC Waste Management Industry Revenue Million Forecast, by Disposal Method 2020 & 2033
- Table 4: Global GCC Waste Management Industry Volume Billion Forecast, by Disposal Method 2020 & 2033
- Table 5: Global GCC Waste Management Industry Revenue Million Forecast, by Region 2020 & 2033
- Table 6: Global GCC Waste Management Industry Volume Billion Forecast, by Region 2020 & 2033
- Table 7: Global GCC Waste Management Industry Revenue Million Forecast, by Waste Type 2020 & 2033
- Table 8: Global GCC Waste Management Industry Volume Billion Forecast, by Waste Type 2020 & 2033
- Table 9: Global GCC Waste Management Industry Revenue Million Forecast, by Disposal Method 2020 & 2033
- Table 10: Global GCC Waste Management Industry Volume Billion Forecast, by Disposal Method 2020 & 2033
- Table 11: Global GCC Waste Management Industry Revenue Million Forecast, by Country 2020 & 2033
- Table 12: Global GCC Waste Management Industry Volume Billion Forecast, by Country 2020 & 2033
- Table 13: United States GCC Waste Management Industry Revenue (Million) Forecast, by Application 2020 & 2033
- Table 14: United States GCC Waste Management Industry Volume (Billion) Forecast, by Application 2020 & 2033
- Table 15: Canada GCC Waste Management Industry Revenue (Million) Forecast, by Application 2020 & 2033
- Table 16: Canada GCC Waste Management Industry Volume (Billion) Forecast, by Application 2020 & 2033
- Table 17: Mexico GCC Waste Management Industry Revenue (Million) Forecast, by Application 2020 & 2033
- Table 18: Mexico GCC Waste Management Industry Volume (Billion) Forecast, by Application 2020 & 2033
- Table 19: Global GCC Waste Management Industry Revenue Million Forecast, by Waste Type 2020 & 2033
- Table 20: Global GCC Waste Management Industry Volume Billion Forecast, by Waste Type 2020 & 2033
- Table 21: Global GCC Waste Management Industry Revenue Million Forecast, by Disposal Method 2020 & 2033
- Table 22: Global GCC Waste Management Industry Volume Billion Forecast, by Disposal Method 2020 & 2033
- Table 23: Global GCC Waste Management Industry Revenue Million Forecast, by Country 2020 & 2033
- Table 24: Global GCC Waste Management Industry Volume Billion Forecast, by Country 2020 & 2033
- Table 25: Brazil GCC Waste Management Industry Revenue (Million) Forecast, by Application 2020 & 2033
- Table 26: Brazil GCC Waste Management Industry Volume (Billion) Forecast, by Application 2020 & 2033
- Table 27: Argentina GCC Waste Management Industry Revenue (Million) Forecast, by Application 2020 & 2033
- Table 28: Argentina GCC Waste Management Industry Volume (Billion) Forecast, by Application 2020 & 2033
- Table 29: Rest of South America GCC Waste Management Industry Revenue (Million) Forecast, by Application 2020 & 2033
- Table 30: Rest of South America GCC Waste Management Industry Volume (Billion) Forecast, by Application 2020 & 2033
- Table 31: Global GCC Waste Management Industry Revenue Million Forecast, by Waste Type 2020 & 2033
- Table 32: Global GCC Waste Management Industry Volume Billion Forecast, by Waste Type 2020 & 2033
- Table 33: Global GCC Waste Management Industry Revenue Million Forecast, by Disposal Method 2020 & 2033
- Table 34: Global GCC Waste Management Industry Volume Billion Forecast, by Disposal Method 2020 & 2033
- Table 35: Global GCC Waste Management Industry Revenue Million Forecast, by Country 2020 & 2033
- Table 36: Global GCC Waste Management Industry Volume Billion Forecast, by Country 2020 & 2033
- Table 37: United Kingdom GCC Waste Management Industry Revenue (Million) Forecast, by Application 2020 & 2033
- Table 38: United Kingdom GCC Waste Management Industry Volume (Billion) Forecast, by Application 2020 & 2033
- Table 39: Germany GCC Waste Management Industry Revenue (Million) Forecast, by Application 2020 & 2033
- Table 40: Germany GCC Waste Management Industry Volume (Billion) Forecast, by Application 2020 & 2033
- Table 41: France GCC Waste Management Industry Revenue (Million) Forecast, by Application 2020 & 2033
- Table 42: France GCC Waste Management Industry Volume (Billion) Forecast, by Application 2020 & 2033
- Table 43: Italy GCC Waste Management Industry Revenue (Million) Forecast, by Application 2020 & 2033
- Table 44: Italy GCC Waste Management Industry Volume (Billion) Forecast, by Application 2020 & 2033
- Table 45: Spain GCC Waste Management Industry Revenue (Million) Forecast, by Application 2020 & 2033
- Table 46: Spain GCC Waste Management Industry Volume (Billion) Forecast, by Application 2020 & 2033
- Table 47: Russia GCC Waste Management Industry Revenue (Million) Forecast, by Application 2020 & 2033
- Table 48: Russia GCC Waste Management Industry Volume (Billion) Forecast, by Application 2020 & 2033
- Table 49: Benelux GCC Waste Management Industry Revenue (Million) Forecast, by Application 2020 & 2033
- Table 50: Benelux GCC Waste Management Industry Volume (Billion) Forecast, by Application 2020 & 2033
- Table 51: Nordics GCC Waste Management Industry Revenue (Million) Forecast, by Application 2020 & 2033
- Table 52: Nordics GCC Waste Management Industry Volume (Billion) Forecast, by Application 2020 & 2033
- Table 53: Rest of Europe GCC Waste Management Industry Revenue (Million) Forecast, by Application 2020 & 2033
- Table 54: Rest of Europe GCC Waste Management Industry Volume (Billion) Forecast, by Application 2020 & 2033
- Table 55: Global GCC Waste Management Industry Revenue Million Forecast, by Waste Type 2020 & 2033
- Table 56: Global GCC Waste Management Industry Volume Billion Forecast, by Waste Type 2020 & 2033
- Table 57: Global GCC Waste Management Industry Revenue Million Forecast, by Disposal Method 2020 & 2033
- Table 58: Global GCC Waste Management Industry Volume Billion Forecast, by Disposal Method 2020 & 2033
- Table 59: Global GCC Waste Management Industry Revenue Million Forecast, by Country 2020 & 2033
- Table 60: Global GCC Waste Management Industry Volume Billion Forecast, by Country 2020 & 2033
- Table 61: Turkey GCC Waste Management Industry Revenue (Million) Forecast, by Application 2020 & 2033
- Table 62: Turkey GCC Waste Management Industry Volume (Billion) Forecast, by Application 2020 & 2033
- Table 63: Israel GCC Waste Management Industry Revenue (Million) Forecast, by Application 2020 & 2033
- Table 64: Israel GCC Waste Management Industry Volume (Billion) Forecast, by Application 2020 & 2033
- Table 65: GCC GCC Waste Management Industry Revenue (Million) Forecast, by Application 2020 & 2033
- Table 66: GCC GCC Waste Management Industry Volume (Billion) Forecast, by Application 2020 & 2033
- Table 67: North Africa GCC Waste Management Industry Revenue (Million) Forecast, by Application 2020 & 2033
- Table 68: North Africa GCC Waste Management Industry Volume (Billion) Forecast, by Application 2020 & 2033
- Table 69: South Africa GCC Waste Management Industry Revenue (Million) Forecast, by Application 2020 & 2033
- Table 70: South Africa GCC Waste Management Industry Volume (Billion) Forecast, by Application 2020 & 2033
- Table 71: Rest of Middle East & Africa GCC Waste Management Industry Revenue (Million) Forecast, by Application 2020 & 2033
- Table 72: Rest of Middle East & Africa GCC Waste Management Industry Volume (Billion) Forecast, by Application 2020 & 2033
- Table 73: Global GCC Waste Management Industry Revenue Million Forecast, by Waste Type 2020 & 2033
- Table 74: Global GCC Waste Management Industry Volume Billion Forecast, by Waste Type 2020 & 2033
- Table 75: Global GCC Waste Management Industry Revenue Million Forecast, by Disposal Method 2020 & 2033
- Table 76: Global GCC Waste Management Industry Volume Billion Forecast, by Disposal Method 2020 & 2033
- Table 77: Global GCC Waste Management Industry Revenue Million Forecast, by Country 2020 & 2033
- Table 78: Global GCC Waste Management Industry Volume Billion Forecast, by Country 2020 & 2033
- Table 79: China GCC Waste Management Industry Revenue (Million) Forecast, by Application 2020 & 2033
- Table 80: China GCC Waste Management Industry Volume (Billion) Forecast, by Application 2020 & 2033
- Table 81: India GCC Waste Management Industry Revenue (Million) Forecast, by Application 2020 & 2033
- Table 82: India GCC Waste Management Industry Volume (Billion) Forecast, by Application 2020 & 2033
- Table 83: Japan GCC Waste Management Industry Revenue (Million) Forecast, by Application 2020 & 2033
- Table 84: Japan GCC Waste Management Industry Volume (Billion) Forecast, by Application 2020 & 2033
- Table 85: South Korea GCC Waste Management Industry Revenue (Million) Forecast, by Application 2020 & 2033
- Table 86: South Korea GCC Waste Management Industry Volume (Billion) Forecast, by Application 2020 & 2033
- Table 87: ASEAN GCC Waste Management Industry Revenue (Million) Forecast, by Application 2020 & 2033
- Table 88: ASEAN GCC Waste Management Industry Volume (Billion) Forecast, by Application 2020 & 2033
- Table 89: Oceania GCC Waste Management Industry Revenue (Million) Forecast, by Application 2020 & 2033
- Table 90: Oceania GCC Waste Management Industry Volume (Billion) Forecast, by Application 2020 & 2033
- Table 91: Rest of Asia Pacific GCC Waste Management Industry Revenue (Million) Forecast, by Application 2020 & 2033
- Table 92: Rest of Asia Pacific GCC Waste Management Industry Volume (Billion) Forecast, by Application 2020 & 2033
Frequently Asked Questions
1. What is the projected Compound Annual Growth Rate (CAGR) of the GCC Waste Management Industry?
The projected CAGR is approximately 7.38%.
2. Which companies are prominent players in the GCC Waste Management Industry?
Key companies in the market include Averda, EnviroServe, Suez Middle East Recycling LLC, Green Mountains, Veolia, Blue LLC, Envac, SEPCO Environment, Wasco, Saudi Investment Recycling Company, Dulsco Waste Management Services, Bee'ah, Power Waste Management and Transport LLC, Al Haya Enviro, Bin-Ovation, United Waste Management Company, Kuwait Waste Collection and Recycling Company**List Not Exhaustive.
3. What are the main segments of the GCC Waste Management Industry?
The market segments include Waste Type, Disposal Method.
4. Can you provide details about the market size?
The market size is estimated to be USD 63.56 Million as of 2022.
5. What are some drivers contributing to market growth?
4.; Increasing demand for mining waste co-disposable.
6. What are the notable trends driving market growth?
Increasing E-waste Generation in Gulf Cooperation Council Region.
7. Are there any restraints impacting market growth?
4.; Increasing demand for mining waste co-disposable.
8. Can you provide examples of recent developments in the market?
December 2023: Electric mobility firm Wardwizard Innovations and Mobility entered into an agreement with the Sharjah Government co-owned sustainable waste management company BEEAH Group (BG) for the manufacturing of electric vehicles. Under this collaboration, Wardwizard Innovations and Mobility, along with BEEAH Group, will jointly promote electric vehicles in GCC nations and the African region.
9. What pricing options are available for accessing the report?
Pricing options include single-user, multi-user, and enterprise licenses priced at USD 3800, USD 4500, and USD 5800 respectively.
10. Is the market size provided in terms of value or volume?
The market size is provided in terms of value, measured in Million and volume, measured in Billion.
11. Are there any specific market keywords associated with the report?
Yes, the market keyword associated with the report is "GCC Waste Management Industry," which aids in identifying and referencing the specific market segment covered.
12. How do I determine which pricing option suits my needs best?
The pricing options vary based on user requirements and access needs. Individual users may opt for single-user licenses, while businesses requiring broader access may choose multi-user or enterprise licenses for cost-effective access to the report.
13. Are there any additional resources or data provided in the GCC Waste Management Industry report?
While the report offers comprehensive insights, it's advisable to review the specific contents or supplementary materials provided to ascertain if additional resources or data are available.
14. How can I stay updated on further developments or reports in the GCC Waste Management Industry?
To stay informed about further developments, trends, and reports in the GCC Waste Management Industry, consider subscribing to industry newsletters, following relevant companies and organizations, or regularly checking reputable industry news sources and publications.
Methodology
Step 1 - Identification of Relevant Samples Size from Population Database


Step 2 - Approaches for Defining Global Market Size (Value, Volume* & Price*)

Note*: In applicable scenarios
Step 3 - Data Sources
Primary Research
- Web Analytics
- Survey Reports
- Research Institute
- Latest Research Reports
- Opinion Leaders
Secondary Research
- Annual Reports
- White Paper
- Latest Press Release
- Industry Association
- Paid Database
- Investor Presentations

Step 4 - Data Triangulation
Involves using different sources of information in order to increase the validity of a study
These sources are likely to be stakeholders in a program - participants, other researchers, program staff, other community members, and so on.
Then we put all data in single framework & apply various statistical tools to find out the dynamic on the market.
During the analysis stage, feedback from the stakeholder groups would be compared to determine areas of agreement as well as areas of divergence