

Key Insights
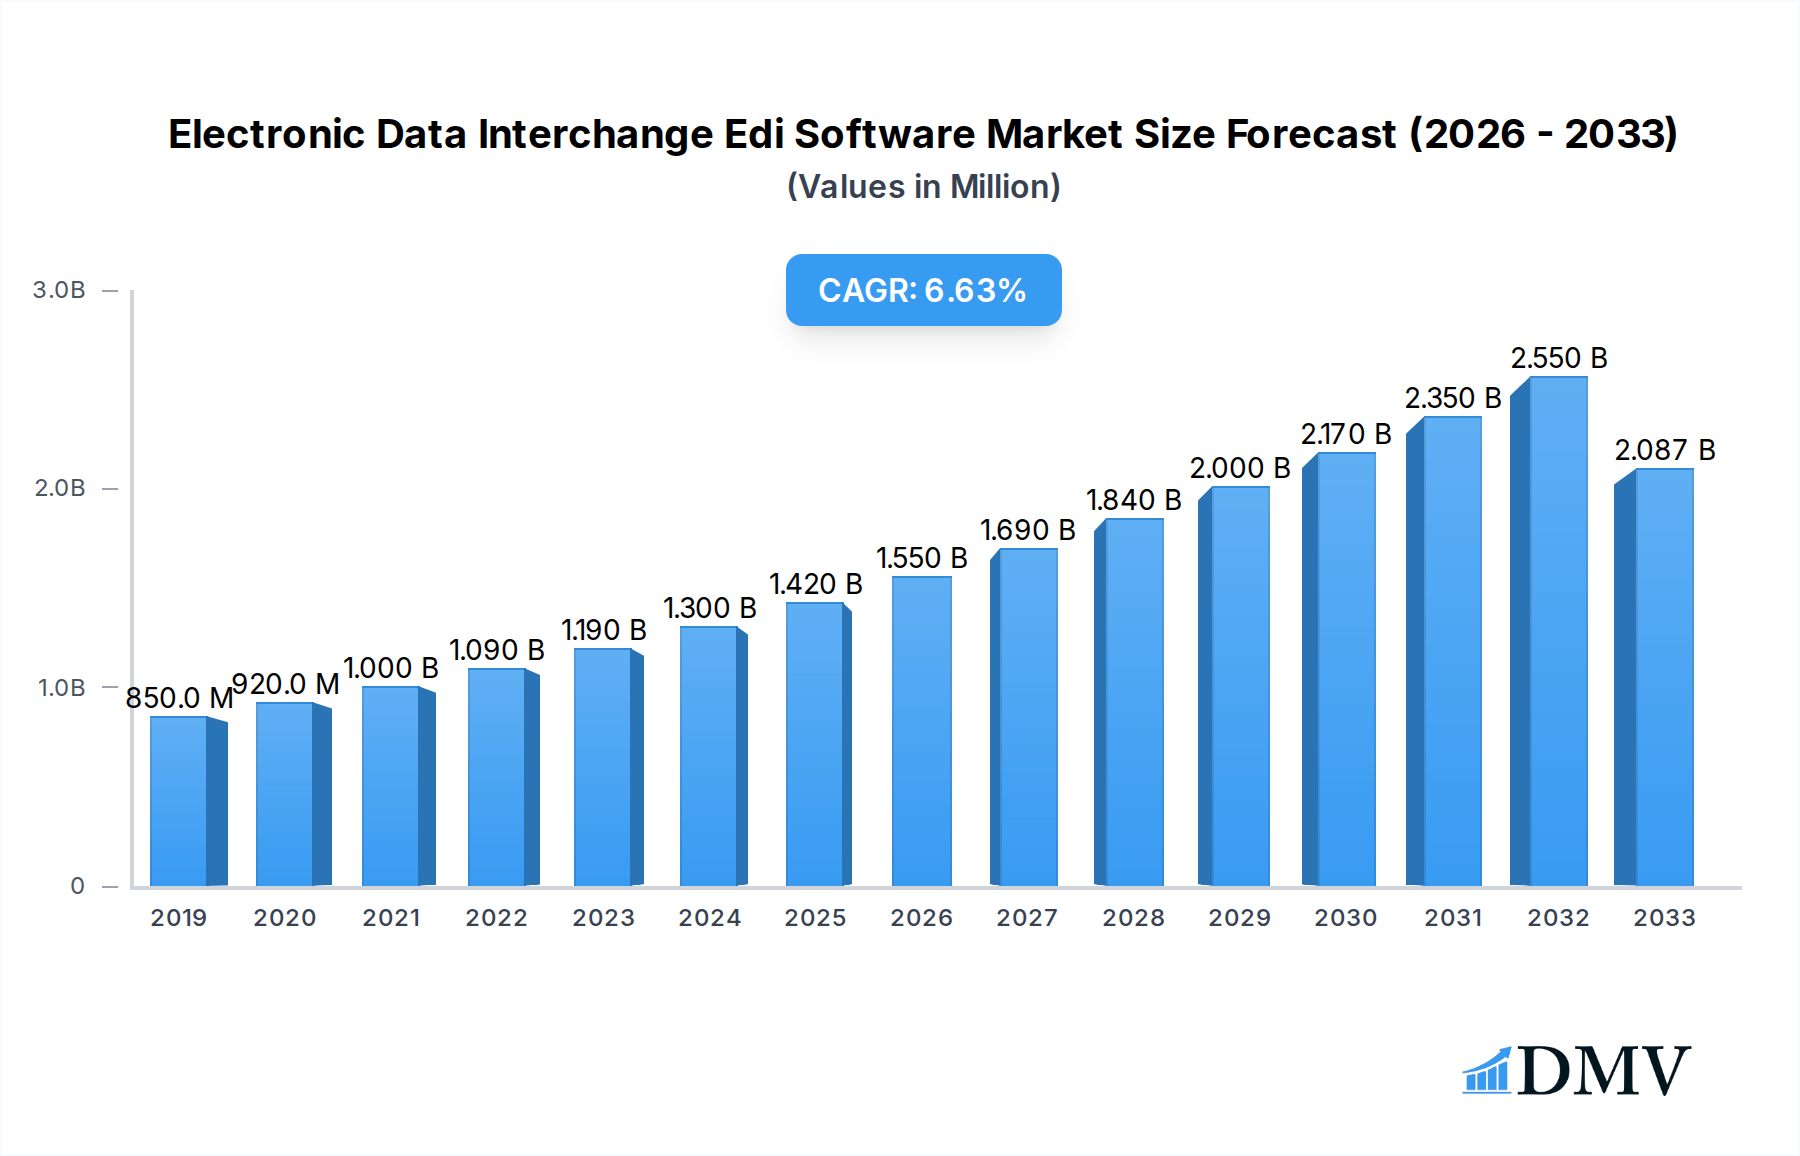
The Electronic Data Interchange (EDI) software market is poised for significant expansion, projected to reach a market size of $2087 million by 2033, driven by a robust Compound Annual Growth Rate (CAGR) of 8% during the forecast period of 2025-2033. This growth is primarily fueled by the increasing need for streamlined business operations and enhanced supply chain efficiency across industries. As businesses of all sizes, from large enterprises to Small and Medium-sized Enterprises (SMEs), increasingly rely on digital transformation, the demand for seamless data exchange solutions like EDI software is escalating. Key drivers include the imperative for real-time data synchronization, reduced manual errors, and improved compliance with industry standards. The market is also experiencing a strong shift towards cloud-based EDI solutions, offering greater scalability, flexibility, and cost-effectiveness compared to traditional on-premise systems. This trend is particularly evident as businesses seek to integrate disparate systems and facilitate smoother transactions with their trading partners.

Electronic Data Interchange Edi Software Market Size (In Million)
The landscape of EDI software is further shaped by emerging trends such as the integration of AI and machine learning for advanced data mapping and error detection, as well as the growing adoption of API-led connectivity to facilitate richer data exchanges beyond traditional EDI standards. While the market exhibits strong growth potential, certain restraints such as the initial implementation costs and the need for specialized technical expertise can pose challenges, particularly for smaller organizations. However, the overarching benefits of enhanced operational efficiency, accelerated business cycles, and improved partner relationships are compelling businesses to invest in robust EDI solutions. The competitive environment features a blend of established players and innovative newcomers, each vying to capture market share through advanced features, comprehensive support, and tailored solutions for diverse industry needs, with strong regional adoption anticipated across North America, Europe, and the Asia Pacific.
Electronic Data Interchange Edi Software Company Market Share
Electronic Data Interchange Edi Software Market Composition & Trends
The Electronic Data Interchange (EDI) software market is characterized by a dynamic ecosystem, with key players such as SPS Commerce, TrueCommerce, Cleo, DiCentral, Dell Boomi, MuleSoft, OpenText, and Epicor (1 EDI Source) commanding significant market share. These industry titans are continuously innovating, fueled by the increasing demand for streamlined business processes and enhanced supply chain visibility. Regulatory landscapes, including mandates for data standardization and security, act as powerful catalysts for EDI adoption, particularly for large enterprises and SMEs seeking compliance. Substitute products, while present, often fall short of the comprehensive integration and automation capabilities offered by robust EDI solutions. End-user profiles span diverse industries, from retail and healthcare to manufacturing and logistics, each with unique integration needs. Mergers and acquisitions (M&A) remain a critical trend, with recent deal values estimated in the one million to one hundred million range, as larger players consolidate their market positions and expand their service offerings. For instance, the acquisition of smaller EDI providers by established vendors aims to broaden their customer base and technological portfolios, driving market concentration. The market is projected to see continued consolidation, with top players potentially holding over seventy percent of the market share by 2033.
- Market Concentration: Dominated by a few key vendors, but with room for niche players.
- Innovation Catalysts: Regulatory compliance, cloud adoption, and the need for real-time data exchange.
- M&A Activities: Ongoing consolidation to expand market reach and technological capabilities, with deal values ranging from one million to one hundred million.
- End-User Profiles: Diverse, encompassing Large Enterprises and SMEs across multiple verticals.
Electronic Data Interchange Edi Software Industry Evolution
The Electronic Data Interchange (EDI) software industry has undergone a remarkable transformation throughout the historical period of 2019–2024 and is poised for exponential growth through 2033. Driven by the imperative for digital transformation, businesses of all sizes have recognized EDI as a cornerstone for efficient and accurate business-to-business (B2B) transactions. In the base year of 2025, the market is valued at an estimated one hundred fifty million, with a projected compound annual growth rate (CAGR) of twelve percent during the forecast period of 2025–2033. This robust growth is primarily attributed to the increasing adoption of cloud-based EDI solutions, which offer scalability, cost-effectiveness, and enhanced accessibility compared to traditional on-premise systems. Technological advancements, such as the integration of Artificial Intelligence (AI) and Machine Learning (ML) for predictive analytics and automated error detection, are further revolutionizing EDI capabilities, enabling faster processing and reduced operational costs. Consumer demand has shifted towards real-time data exchange and seamless integration with existing enterprise resource planning (ERP) and supply chain management (SCM) systems. This has spurred vendors to offer more sophisticated APIs and connectors, simplifying integration and expanding the utility of EDI beyond basic document exchange. The historical period witnessed a gradual but steady increase in EDI adoption, with SMEs increasingly embracing these solutions to compete with larger enterprises. By 2024, cloud-based EDI solutions accounted for approximately sixty-five percent of new implementations. Industry developments during the historical period included enhanced security protocols and increased support for various communication methods, such as AS2, SFTP, and VANs, catering to diverse business needs. The market’s evolution reflects a clear trajectory towards greater automation, intelligence, and interoperability, making EDI an indispensable tool for modern businesses aiming to optimize their operations and foster stronger trading partner relationships. By 2033, the market is forecasted to reach a value of over three hundred million.
Leading Regions, Countries, or Segments in Electronic Data Interchange Edi Software
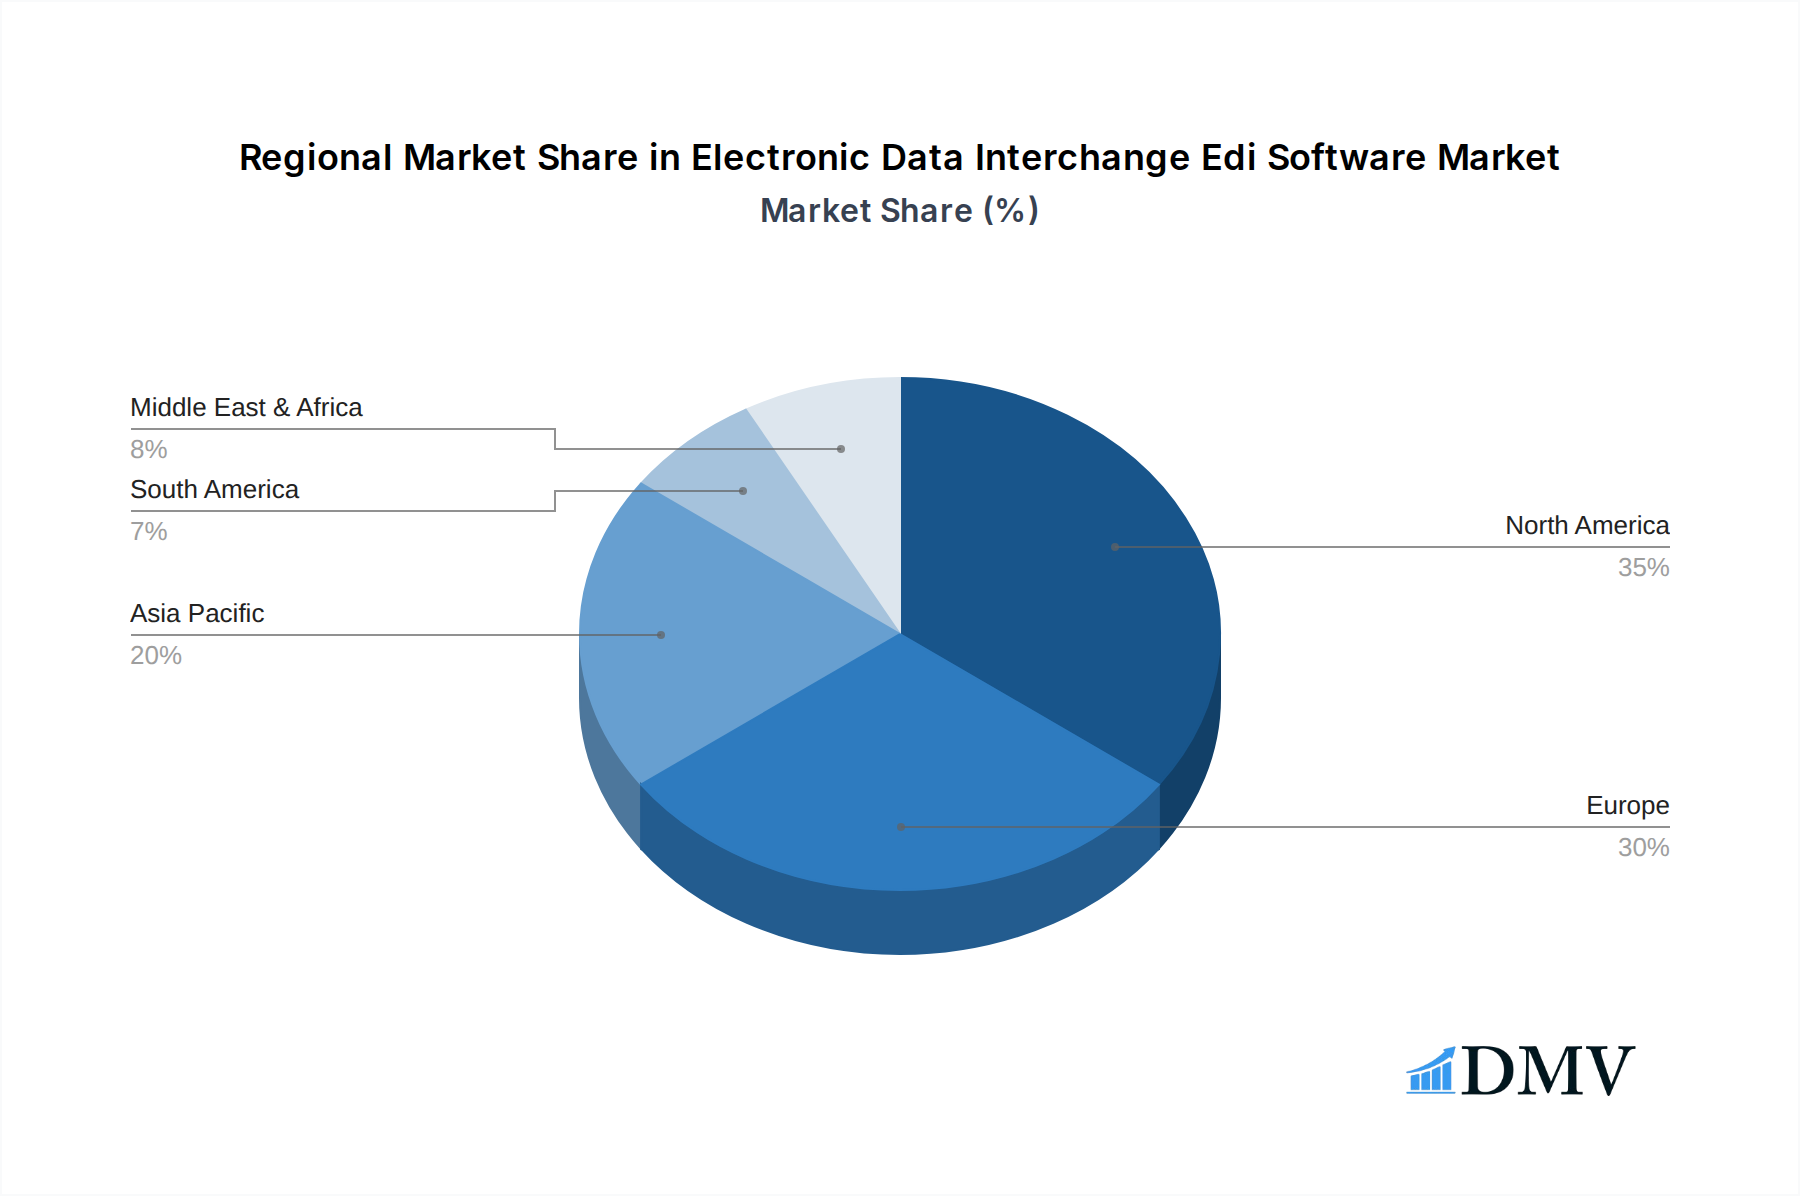
The North America region stands as the undisputed leader in the Electronic Data Interchange (EDI) software market, driven by a confluence of factors that solidify its dominance. Within North America, the United States, with its highly developed and technologically advanced business infrastructure, represents the largest country-level market for EDI solutions. The dominant segment in terms of adoption and market value is Large Enterprises, a trend that has persisted throughout the study period and is expected to continue. These enterprises, grappling with complex, high-volume B2B transactions across extensive supply chains, necessitate sophisticated EDI capabilities for efficient operations, regulatory compliance, and competitive advantage. The total market value in North America is estimated to be one hundred million in 2025, with the large enterprise segment contributing approximately seventy percent of this value.
Dominant Region: North America, projected to hold over forty percent of the global market share by 2033.
- Key Drivers: High concentration of global corporations, robust technological adoption, and stringent regulatory requirements for data exchange.
- Investment Trends: Significant investments in cloud-based EDI infrastructure and integration services by large enterprises.
- Regulatory Support: Government initiatives and industry standards promoting secure and standardized data interchange.
Dominant Country: United States, contributing approximately eighty-five percent of the North American market.
- Analysis: The US market benefits from a mature e-commerce ecosystem, extensive retail and manufacturing sectors, and a proactive approach to adopting digital supply chain solutions. Companies like SPS Commerce and TrueCommerce have established strong footholds here.
Dominant Segment (Application): Large Enterprises.
- Analysis: These organizations require advanced features such as high-volume transaction processing, complex mapping capabilities, robust security, and comprehensive audit trails. Their investment in EDI is crucial for managing intricate supplier and customer relationships, ensuring inventory accuracy, and facilitating timely payments. The total annual spend on EDI software and services by large enterprises in the US alone is estimated to be fifty million.
Dominant Segment (Type): Cloud Based.
- Analysis: While on-premise solutions still exist, cloud-based EDI has witnessed a substantial surge in adoption due to its scalability, flexibility, and lower upfront costs. This model allows businesses, particularly SMEs, to access enterprise-grade EDI capabilities without significant IT overhead. Cloud adoption is projected to reach eighty percent by 2033.
Electronic Data Interchange Edi Software Product Innovations
Recent product innovations in EDI software are significantly enhancing interoperability and automation. Companies like Dell Boomi and MuleSoft are leading the charge with their iPaaS (Integration Platform as a Service) solutions, offering robust APIs and connectors that simplify the integration of EDI with a myriad of other business applications. These platforms now incorporate AI-driven data validation and transformation, reducing manual errors and accelerating transaction processing times, with an average reduction in processing errors by ten percent. ArcESB (RSSBus) and Rocket Software are focusing on enhancing security protocols and compliance features, catering to industries with strict data privacy regulations, ensuring ninety-nine percent data integrity. The emphasis is on providing intuitive user interfaces and self-service capabilities, enabling businesses to manage their EDI workflows more efficiently, leading to a twenty percent decrease in integration time for new trading partners.
Propelling Factors for Electronic Data Interchange Edi Software Growth
The growth of the Electronic Data Interchange (EDI) software market is propelled by several key factors. The relentless pursuit of operational efficiency and cost reduction across all business verticals is a primary driver, as EDI automates manual processes, minimizes errors, and expedites transaction cycles. Regulatory mandates, such as those in healthcare (HIPAA) and finance, enforce standardized data exchange, compelling businesses to adopt compliant EDI solutions. Furthermore, the burgeoning e-commerce landscape necessitates seamless B2B integration to manage the increasing volume and complexity of online orders and supply chain logistics. Technological advancements, including cloud computing and API-driven integrations, are making EDI more accessible and affordable, particularly for Small and Medium-sized Enterprises (SMEs). The projected market growth is estimated to be twelve percent CAGR.
- Operational Efficiency: Automation of B2B transactions leading to reduced costs and faster cycle times, estimated to save businesses ** fifteen percent** in operational overhead.
- Regulatory Compliance: Increasing government and industry mandates for standardized data exchange.
- E-commerce Boom: Growing need for seamless integration to manage online sales and supply chains.
- Technological Advancements: Cloud-based solutions and APIs lowering barriers to entry.
Obstacles in the Electronic Data Interchange Edi Software Market
Despite its robust growth, the Electronic Data Interchange (EDI) software market faces several obstacles. The initial investment required for implementing comprehensive EDI solutions can be a significant barrier for smaller businesses, with average implementation costs ranging from fifty thousand to two hundred thousand. The complexity of integrating EDI with legacy systems and diverse trading partner requirements can lead to extended implementation timelines and increased operational challenges, potentially adding twenty percent to project costs. Navigating the diverse and evolving regulatory landscapes across different industries and geographies adds another layer of complexity. Furthermore, the threat of more agile and potentially disruptive technologies, such as blockchain for supply chain transparency, poses a long-term competitive pressure.
- High Implementation Costs: Initial investment can be prohibitive for SMEs, averaging one hundred thousand.
- Integration Complexity: Challenges in integrating with legacy systems and diverse trading partner setups.
- Evolving Regulations: The need for continuous adaptation to varying compliance standards.
- Competition from Emerging Technologies: Potential disruption from innovative solutions like blockchain.
Future Opportunities in Electronic Data Interchange Edi Software
Emerging opportunities in the EDI software market are substantial, particularly in leveraging advanced technologies and expanding into underserved segments. The integration of Artificial Intelligence (AI) and Machine Learning (ML) into EDI platforms presents a significant avenue for growth, enabling predictive analytics, intelligent data transformation, and automated exception handling, which could reduce processing errors by an additional fifteen percent. The increasing demand for real-time data exchange in supply chains, driven by the need for greater visibility and agility, opens up opportunities for dynamic EDI solutions. Expansion into emerging markets with developing e-commerce infrastructures and increasing adoption of digital business practices offers untapped potential. Furthermore, the growing adoption of API-driven integrations by SMEs, facilitated by platforms like Jitterbit and Babelway, democratizes access to EDI capabilities, creating new customer segments.
- AI/ML Integration: Enhancing automation and predictive capabilities for data processing.
- Real-Time Data Exchange: Meeting the demand for increased supply chain visibility.
- Emerging Markets: Tapping into developing economies with growing B2B integration needs.
- SME Adoption of APIs: Lowering barriers for smaller businesses to utilize EDI.
Major Players in the Electronic Data Interchange Edi Software Ecosystem
The Electronic Data Interchange (EDI) Software ecosystem is comprised of leading technology providers and specialized integration solutions. The major players driving innovation and market adoption include:
- SPS Commerce
- TrueCommerce
- Cleo
- DiCentral
- Dell Boomi
- MuleSoft
- OpenText
- Epicor (1 EDI Source)
- ArcESB (RSSBus)
- Rocket Software
- Software AG
- Babelway
- Jitterbit
- HelpSystems (GoAnywhere)
- Kovai (BizTalk360)
- IBM
- Dassault Systèmes (IQMS)
Key Developments in Electronic Data Interchange Edi Software Industry
The Electronic Data Interchange (EDI) Software industry has witnessed several impactful developments, shaping its trajectory from 2019 to the present.
- 2023: Launch of advanced AI-powered EDI analytics by major vendors like SPS Commerce, enabling predictive insights into supply chain performance and potential disruptions.
- 2022: Increased focus on API-first integration strategies by platforms such as Dell Boomi and MuleSoft, simplifying the connection of EDI with a broader range of cloud applications.
- 2021: Significant M&A activity, with consolidations aimed at expanding service portfolios and market reach, such as the acquisition of smaller EDI providers by established players.
- 2020: Enhanced security features and compliance certifications, including increased adoption of AS2 and SFTP protocols, driven by heightened cybersecurity concerns and regulatory demands.
- 2019: Growing adoption of cloud-based EDI solutions by SMEs, supported by more flexible subscription models and reduced implementation complexities.
Strategic Electronic Data Interchange Edi Software Market Forecast
The strategic forecast for the Electronic Data Interchange (EDI) software market indicates continued robust growth, driven by the fundamental need for efficient and accurate business-to-business data exchange. The increasing digital transformation initiatives across industries, coupled with the relentless expansion of e-commerce and global supply chains, will fuel demand for sophisticated EDI solutions. Future growth will be significantly influenced by the integration of advanced technologies such as AI and machine learning, which promise to automate more complex data processing tasks and provide actionable insights. Cloud-based EDI will continue to dominate deployment models, offering scalability and cost-effectiveness, particularly for SMEs. The market's potential is substantial, with an estimated market value of over three hundred million by 2033, representing a CAGR of twelve percent from 2025.
Electronic Data Interchange Edi Software Segmentation
-
1. Application
- 1.1. Large Enterprises
- 1.2. SMEs
-
2. Type
- 2.1. Cloud Based
- 2.2. On-Premise
Electronic Data Interchange Edi Software Segmentation By Geography
-
1. North America
- 1.1. United States
- 1.2. Canada
- 1.3. Mexico
-
2. South America
- 2.1. Brazil
- 2.2. Argentina
- 2.3. Rest of South America
-
3. Europe
- 3.1. United Kingdom
- 3.2. Germany
- 3.3. France
- 3.4. Italy
- 3.5. Spain
- 3.6. Russia
- 3.7. Benelux
- 3.8. Nordics
- 3.9. Rest of Europe
-
4. Middle East & Africa
- 4.1. Turkey
- 4.2. Israel
- 4.3. GCC
- 4.4. North Africa
- 4.5. South Africa
- 4.6. Rest of Middle East & Africa
-
5. Asia Pacific
- 5.1. China
- 5.2. India
- 5.3. Japan
- 5.4. South Korea
- 5.5. ASEAN
- 5.6. Oceania
- 5.7. Rest of Asia Pacific
Electronic Data Interchange Edi Software Regional Market Share
Geographic Coverage of Electronic Data Interchange Edi Software
Electronic Data Interchange Edi Software REPORT HIGHLIGHTS
| Aspects | Details |
|---|---|
| Study Period | 2020-2034 |
| Base Year | 2025 |
| Estimated Year | 2026 |
| Forecast Period | 2026-2034 |
| Historical Period | 2020-2025 |
| Growth Rate | CAGR of 8% from 2020-2034 |
| Segmentation |
|
Table of Contents
- 1. Introduction
- 1.1. Research Scope
- 1.2. Market Segmentation
- 1.3. Research Methodology
- 1.4. Definitions and Assumptions
- 2. Executive Summary
- 2.1. Introduction
- 3. Market Dynamics
- 3.1. Introduction
- 3.2. Market Drivers
- 3.3. Market Restrains
- 3.4. Market Trends
- 4. Market Factor Analysis
- 4.1. Porters Five Forces
- 4.2. Supply/Value Chain
- 4.3. PESTEL analysis
- 4.4. Market Entropy
- 4.5. Patent/Trademark Analysis
- 5. Global Electronic Data Interchange Edi Software Analysis, Insights and Forecast, 2020-2032
- 5.1. Market Analysis, Insights and Forecast - by Application
- 5.1.1. Large Enterprises
- 5.1.2. SMEs
- 5.2. Market Analysis, Insights and Forecast - by Type
- 5.2.1. Cloud Based
- 5.2.2. On-Premise
- 5.3. Market Analysis, Insights and Forecast - by Region
- 5.3.1. North America
- 5.3.2. South America
- 5.3.3. Europe
- 5.3.4. Middle East & Africa
- 5.3.5. Asia Pacific
- 5.1. Market Analysis, Insights and Forecast - by Application
- 6. North America Electronic Data Interchange Edi Software Analysis, Insights and Forecast, 2020-2032
- 6.1. Market Analysis, Insights and Forecast - by Application
- 6.1.1. Large Enterprises
- 6.1.2. SMEs
- 6.2. Market Analysis, Insights and Forecast - by Type
- 6.2.1. Cloud Based
- 6.2.2. On-Premise
- 6.1. Market Analysis, Insights and Forecast - by Application
- 7. South America Electronic Data Interchange Edi Software Analysis, Insights and Forecast, 2020-2032
- 7.1. Market Analysis, Insights and Forecast - by Application
- 7.1.1. Large Enterprises
- 7.1.2. SMEs
- 7.2. Market Analysis, Insights and Forecast - by Type
- 7.2.1. Cloud Based
- 7.2.2. On-Premise
- 7.1. Market Analysis, Insights and Forecast - by Application
- 8. Europe Electronic Data Interchange Edi Software Analysis, Insights and Forecast, 2020-2032
- 8.1. Market Analysis, Insights and Forecast - by Application
- 8.1.1. Large Enterprises
- 8.1.2. SMEs
- 8.2. Market Analysis, Insights and Forecast - by Type
- 8.2.1. Cloud Based
- 8.2.2. On-Premise
- 8.1. Market Analysis, Insights and Forecast - by Application
- 9. Middle East & Africa Electronic Data Interchange Edi Software Analysis, Insights and Forecast, 2020-2032
- 9.1. Market Analysis, Insights and Forecast - by Application
- 9.1.1. Large Enterprises
- 9.1.2. SMEs
- 9.2. Market Analysis, Insights and Forecast - by Type
- 9.2.1. Cloud Based
- 9.2.2. On-Premise
- 9.1. Market Analysis, Insights and Forecast - by Application
- 10. Asia Pacific Electronic Data Interchange Edi Software Analysis, Insights and Forecast, 2020-2032
- 10.1. Market Analysis, Insights and Forecast - by Application
- 10.1.1. Large Enterprises
- 10.1.2. SMEs
- 10.2. Market Analysis, Insights and Forecast - by Type
- 10.2.1. Cloud Based
- 10.2.2. On-Premise
- 10.1. Market Analysis, Insights and Forecast - by Application
- 11. Competitive Analysis
- 11.1. Global Market Share Analysis 2025
- 11.2. Company Profiles
- 11.2.1 SPS Commerce
- 11.2.1.1. Overview
- 11.2.1.2. Products
- 11.2.1.3. SWOT Analysis
- 11.2.1.4. Recent Developments
- 11.2.1.5. Financials (Based on Availability)
- 11.2.2 TrueCommerce
- 11.2.2.1. Overview
- 11.2.2.2. Products
- 11.2.2.3. SWOT Analysis
- 11.2.2.4. Recent Developments
- 11.2.2.5. Financials (Based on Availability)
- 11.2.3 Cleo
- 11.2.3.1. Overview
- 11.2.3.2. Products
- 11.2.3.3. SWOT Analysis
- 11.2.3.4. Recent Developments
- 11.2.3.5. Financials (Based on Availability)
- 11.2.4 DiCentral
- 11.2.4.1. Overview
- 11.2.4.2. Products
- 11.2.4.3. SWOT Analysis
- 11.2.4.4. Recent Developments
- 11.2.4.5. Financials (Based on Availability)
- 11.2.5 Dell Boomi
- 11.2.5.1. Overview
- 11.2.5.2. Products
- 11.2.5.3. SWOT Analysis
- 11.2.5.4. Recent Developments
- 11.2.5.5. Financials (Based on Availability)
- 11.2.6 MuleSoft
- 11.2.6.1. Overview
- 11.2.6.2. Products
- 11.2.6.3. SWOT Analysis
- 11.2.6.4. Recent Developments
- 11.2.6.5. Financials (Based on Availability)
- 11.2.7 OpenText
- 11.2.7.1. Overview
- 11.2.7.2. Products
- 11.2.7.3. SWOT Analysis
- 11.2.7.4. Recent Developments
- 11.2.7.5. Financials (Based on Availability)
- 11.2.8 Epicor (1 EDI Source)
- 11.2.8.1. Overview
- 11.2.8.2. Products
- 11.2.8.3. SWOT Analysis
- 11.2.8.4. Recent Developments
- 11.2.8.5. Financials (Based on Availability)
- 11.2.9 ArcESB (RSSBus)
- 11.2.9.1. Overview
- 11.2.9.2. Products
- 11.2.9.3. SWOT Analysis
- 11.2.9.4. Recent Developments
- 11.2.9.5. Financials (Based on Availability)
- 11.2.10 Rocket Software
- 11.2.10.1. Overview
- 11.2.10.2. Products
- 11.2.10.3. SWOT Analysis
- 11.2.10.4. Recent Developments
- 11.2.10.5. Financials (Based on Availability)
- 11.2.11 Software AG
- 11.2.11.1. Overview
- 11.2.11.2. Products
- 11.2.11.3. SWOT Analysis
- 11.2.11.4. Recent Developments
- 11.2.11.5. Financials (Based on Availability)
- 11.2.12 Babelway
- 11.2.12.1. Overview
- 11.2.12.2. Products
- 11.2.12.3. SWOT Analysis
- 11.2.12.4. Recent Developments
- 11.2.12.5. Financials (Based on Availability)
- 11.2.13 Jitterbit
- 11.2.13.1. Overview
- 11.2.13.2. Products
- 11.2.13.3. SWOT Analysis
- 11.2.13.4. Recent Developments
- 11.2.13.5. Financials (Based on Availability)
- 11.2.14 HelpSystems (GoAnywhere)
- 11.2.14.1. Overview
- 11.2.14.2. Products
- 11.2.14.3. SWOT Analysis
- 11.2.14.4. Recent Developments
- 11.2.14.5. Financials (Based on Availability)
- 11.2.15 Kovai (BizTalk360)
- 11.2.15.1. Overview
- 11.2.15.2. Products
- 11.2.15.3. SWOT Analysis
- 11.2.15.4. Recent Developments
- 11.2.15.5. Financials (Based on Availability)
- 11.2.16 IBM
- 11.2.16.1. Overview
- 11.2.16.2. Products
- 11.2.16.3. SWOT Analysis
- 11.2.16.4. Recent Developments
- 11.2.16.5. Financials (Based on Availability)
- 11.2.17 Dassault Systèmes (IQMS)
- 11.2.17.1. Overview
- 11.2.17.2. Products
- 11.2.17.3. SWOT Analysis
- 11.2.17.4. Recent Developments
- 11.2.17.5. Financials (Based on Availability)
- 11.2.1 SPS Commerce
List of Figures
- Figure 1: Global Electronic Data Interchange Edi Software Revenue Breakdown (million, %) by Region 2025 & 2033
- Figure 2: North America Electronic Data Interchange Edi Software Revenue (million), by Application 2025 & 2033
- Figure 3: North America Electronic Data Interchange Edi Software Revenue Share (%), by Application 2025 & 2033
- Figure 4: North America Electronic Data Interchange Edi Software Revenue (million), by Type 2025 & 2033
- Figure 5: North America Electronic Data Interchange Edi Software Revenue Share (%), by Type 2025 & 2033
- Figure 6: North America Electronic Data Interchange Edi Software Revenue (million), by Country 2025 & 2033
- Figure 7: North America Electronic Data Interchange Edi Software Revenue Share (%), by Country 2025 & 2033
- Figure 8: South America Electronic Data Interchange Edi Software Revenue (million), by Application 2025 & 2033
- Figure 9: South America Electronic Data Interchange Edi Software Revenue Share (%), by Application 2025 & 2033
- Figure 10: South America Electronic Data Interchange Edi Software Revenue (million), by Type 2025 & 2033
- Figure 11: South America Electronic Data Interchange Edi Software Revenue Share (%), by Type 2025 & 2033
- Figure 12: South America Electronic Data Interchange Edi Software Revenue (million), by Country 2025 & 2033
- Figure 13: South America Electronic Data Interchange Edi Software Revenue Share (%), by Country 2025 & 2033
- Figure 14: Europe Electronic Data Interchange Edi Software Revenue (million), by Application 2025 & 2033
- Figure 15: Europe Electronic Data Interchange Edi Software Revenue Share (%), by Application 2025 & 2033
- Figure 16: Europe Electronic Data Interchange Edi Software Revenue (million), by Type 2025 & 2033
- Figure 17: Europe Electronic Data Interchange Edi Software Revenue Share (%), by Type 2025 & 2033
- Figure 18: Europe Electronic Data Interchange Edi Software Revenue (million), by Country 2025 & 2033
- Figure 19: Europe Electronic Data Interchange Edi Software Revenue Share (%), by Country 2025 & 2033
- Figure 20: Middle East & Africa Electronic Data Interchange Edi Software Revenue (million), by Application 2025 & 2033
- Figure 21: Middle East & Africa Electronic Data Interchange Edi Software Revenue Share (%), by Application 2025 & 2033
- Figure 22: Middle East & Africa Electronic Data Interchange Edi Software Revenue (million), by Type 2025 & 2033
- Figure 23: Middle East & Africa Electronic Data Interchange Edi Software Revenue Share (%), by Type 2025 & 2033
- Figure 24: Middle East & Africa Electronic Data Interchange Edi Software Revenue (million), by Country 2025 & 2033
- Figure 25: Middle East & Africa Electronic Data Interchange Edi Software Revenue Share (%), by Country 2025 & 2033
- Figure 26: Asia Pacific Electronic Data Interchange Edi Software Revenue (million), by Application 2025 & 2033
- Figure 27: Asia Pacific Electronic Data Interchange Edi Software Revenue Share (%), by Application 2025 & 2033
- Figure 28: Asia Pacific Electronic Data Interchange Edi Software Revenue (million), by Type 2025 & 2033
- Figure 29: Asia Pacific Electronic Data Interchange Edi Software Revenue Share (%), by Type 2025 & 2033
- Figure 30: Asia Pacific Electronic Data Interchange Edi Software Revenue (million), by Country 2025 & 2033
- Figure 31: Asia Pacific Electronic Data Interchange Edi Software Revenue Share (%), by Country 2025 & 2033
List of Tables
- Table 1: Global Electronic Data Interchange Edi Software Revenue million Forecast, by Application 2020 & 2033
- Table 2: Global Electronic Data Interchange Edi Software Revenue million Forecast, by Type 2020 & 2033
- Table 3: Global Electronic Data Interchange Edi Software Revenue million Forecast, by Region 2020 & 2033
- Table 4: Global Electronic Data Interchange Edi Software Revenue million Forecast, by Application 2020 & 2033
- Table 5: Global Electronic Data Interchange Edi Software Revenue million Forecast, by Type 2020 & 2033
- Table 6: Global Electronic Data Interchange Edi Software Revenue million Forecast, by Country 2020 & 2033
- Table 7: United States Electronic Data Interchange Edi Software Revenue (million) Forecast, by Application 2020 & 2033
- Table 8: Canada Electronic Data Interchange Edi Software Revenue (million) Forecast, by Application 2020 & 2033
- Table 9: Mexico Electronic Data Interchange Edi Software Revenue (million) Forecast, by Application 2020 & 2033
- Table 10: Global Electronic Data Interchange Edi Software Revenue million Forecast, by Application 2020 & 2033
- Table 11: Global Electronic Data Interchange Edi Software Revenue million Forecast, by Type 2020 & 2033
- Table 12: Global Electronic Data Interchange Edi Software Revenue million Forecast, by Country 2020 & 2033
- Table 13: Brazil Electronic Data Interchange Edi Software Revenue (million) Forecast, by Application 2020 & 2033
- Table 14: Argentina Electronic Data Interchange Edi Software Revenue (million) Forecast, by Application 2020 & 2033
- Table 15: Rest of South America Electronic Data Interchange Edi Software Revenue (million) Forecast, by Application 2020 & 2033
- Table 16: Global Electronic Data Interchange Edi Software Revenue million Forecast, by Application 2020 & 2033
- Table 17: Global Electronic Data Interchange Edi Software Revenue million Forecast, by Type 2020 & 2033
- Table 18: Global Electronic Data Interchange Edi Software Revenue million Forecast, by Country 2020 & 2033
- Table 19: United Kingdom Electronic Data Interchange Edi Software Revenue (million) Forecast, by Application 2020 & 2033
- Table 20: Germany Electronic Data Interchange Edi Software Revenue (million) Forecast, by Application 2020 & 2033
- Table 21: France Electronic Data Interchange Edi Software Revenue (million) Forecast, by Application 2020 & 2033
- Table 22: Italy Electronic Data Interchange Edi Software Revenue (million) Forecast, by Application 2020 & 2033
- Table 23: Spain Electronic Data Interchange Edi Software Revenue (million) Forecast, by Application 2020 & 2033
- Table 24: Russia Electronic Data Interchange Edi Software Revenue (million) Forecast, by Application 2020 & 2033
- Table 25: Benelux Electronic Data Interchange Edi Software Revenue (million) Forecast, by Application 2020 & 2033
- Table 26: Nordics Electronic Data Interchange Edi Software Revenue (million) Forecast, by Application 2020 & 2033
- Table 27: Rest of Europe Electronic Data Interchange Edi Software Revenue (million) Forecast, by Application 2020 & 2033
- Table 28: Global Electronic Data Interchange Edi Software Revenue million Forecast, by Application 2020 & 2033
- Table 29: Global Electronic Data Interchange Edi Software Revenue million Forecast, by Type 2020 & 2033
- Table 30: Global Electronic Data Interchange Edi Software Revenue million Forecast, by Country 2020 & 2033
- Table 31: Turkey Electronic Data Interchange Edi Software Revenue (million) Forecast, by Application 2020 & 2033
- Table 32: Israel Electronic Data Interchange Edi Software Revenue (million) Forecast, by Application 2020 & 2033
- Table 33: GCC Electronic Data Interchange Edi Software Revenue (million) Forecast, by Application 2020 & 2033
- Table 34: North Africa Electronic Data Interchange Edi Software Revenue (million) Forecast, by Application 2020 & 2033
- Table 35: South Africa Electronic Data Interchange Edi Software Revenue (million) Forecast, by Application 2020 & 2033
- Table 36: Rest of Middle East & Africa Electronic Data Interchange Edi Software Revenue (million) Forecast, by Application 2020 & 2033
- Table 37: Global Electronic Data Interchange Edi Software Revenue million Forecast, by Application 2020 & 2033
- Table 38: Global Electronic Data Interchange Edi Software Revenue million Forecast, by Type 2020 & 2033
- Table 39: Global Electronic Data Interchange Edi Software Revenue million Forecast, by Country 2020 & 2033
- Table 40: China Electronic Data Interchange Edi Software Revenue (million) Forecast, by Application 2020 & 2033
- Table 41: India Electronic Data Interchange Edi Software Revenue (million) Forecast, by Application 2020 & 2033
- Table 42: Japan Electronic Data Interchange Edi Software Revenue (million) Forecast, by Application 2020 & 2033
- Table 43: South Korea Electronic Data Interchange Edi Software Revenue (million) Forecast, by Application 2020 & 2033
- Table 44: ASEAN Electronic Data Interchange Edi Software Revenue (million) Forecast, by Application 2020 & 2033
- Table 45: Oceania Electronic Data Interchange Edi Software Revenue (million) Forecast, by Application 2020 & 2033
- Table 46: Rest of Asia Pacific Electronic Data Interchange Edi Software Revenue (million) Forecast, by Application 2020 & 2033
Frequently Asked Questions
1. What is the projected Compound Annual Growth Rate (CAGR) of the Electronic Data Interchange Edi Software?
The projected CAGR is approximately 8%.
2. Which companies are prominent players in the Electronic Data Interchange Edi Software?
Key companies in the market include SPS Commerce, TrueCommerce, Cleo, DiCentral, Dell Boomi, MuleSoft, OpenText, Epicor (1 EDI Source), ArcESB (RSSBus), Rocket Software, Software AG, Babelway, Jitterbit, HelpSystems (GoAnywhere), Kovai (BizTalk360), IBM, Dassault Systèmes (IQMS).
3. What are the main segments of the Electronic Data Interchange Edi Software?
The market segments include Application, Type.
4. Can you provide details about the market size?
The market size is estimated to be USD 2087 million as of 2022.
5. What are some drivers contributing to market growth?
N/A
6. What are the notable trends driving market growth?
N/A
7. Are there any restraints impacting market growth?
N/A
8. Can you provide examples of recent developments in the market?
N/A
9. What pricing options are available for accessing the report?
Pricing options include single-user, multi-user, and enterprise licenses priced at USD 5900.00, USD 8850.00, and USD 11800.00 respectively.
10. Is the market size provided in terms of value or volume?
The market size is provided in terms of value, measured in million.
11. Are there any specific market keywords associated with the report?
Yes, the market keyword associated with the report is "Electronic Data Interchange Edi Software," which aids in identifying and referencing the specific market segment covered.
12. How do I determine which pricing option suits my needs best?
The pricing options vary based on user requirements and access needs. Individual users may opt for single-user licenses, while businesses requiring broader access may choose multi-user or enterprise licenses for cost-effective access to the report.
13. Are there any additional resources or data provided in the Electronic Data Interchange Edi Software report?
While the report offers comprehensive insights, it's advisable to review the specific contents or supplementary materials provided to ascertain if additional resources or data are available.
14. How can I stay updated on further developments or reports in the Electronic Data Interchange Edi Software?
To stay informed about further developments, trends, and reports in the Electronic Data Interchange Edi Software, consider subscribing to industry newsletters, following relevant companies and organizations, or regularly checking reputable industry news sources and publications.
Methodology
Step 1 - Identification of Relevant Samples Size from Population Database


Step 2 - Approaches for Defining Global Market Size (Value, Volume* & Price*)

Note*: In applicable scenarios
Step 3 - Data Sources
Primary Research
- Web Analytics
- Survey Reports
- Research Institute
- Latest Research Reports
- Opinion Leaders
Secondary Research
- Annual Reports
- White Paper
- Latest Press Release
- Industry Association
- Paid Database
- Investor Presentations

Step 4 - Data Triangulation
Involves using different sources of information in order to increase the validity of a study
These sources are likely to be stakeholders in a program - participants, other researchers, program staff, other community members, and so on.
Then we put all data in single framework & apply various statistical tools to find out the dynamic on the market.
During the analysis stage, feedback from the stakeholder groups would be compared to determine areas of agreement as well as areas of divergence