

Key Insights
The global Cranberry Wine market is poised for robust expansion, projected to reach a market size of $236 million by 2025. This growth trajectory is underpinned by a CAGR of 4.4% from 2025 to 2033, indicating a steady and significant increase in market value. The primary drivers fueling this expansion include the increasing consumer preference for novel and fruit-infused wines, the growing popularity of cranberry as a health-conscious ingredient, and the expanding distribution channels, particularly the rise of online sales and specialized wine retailers. Convenience stores and supermarkets are also playing a crucial role in making cranberry wine more accessible to a wider consumer base. Furthermore, the perceived health benefits associated with cranberries, such as antioxidant properties, are resonating with health-aware consumers seeking sophisticated yet beneficial beverage options.
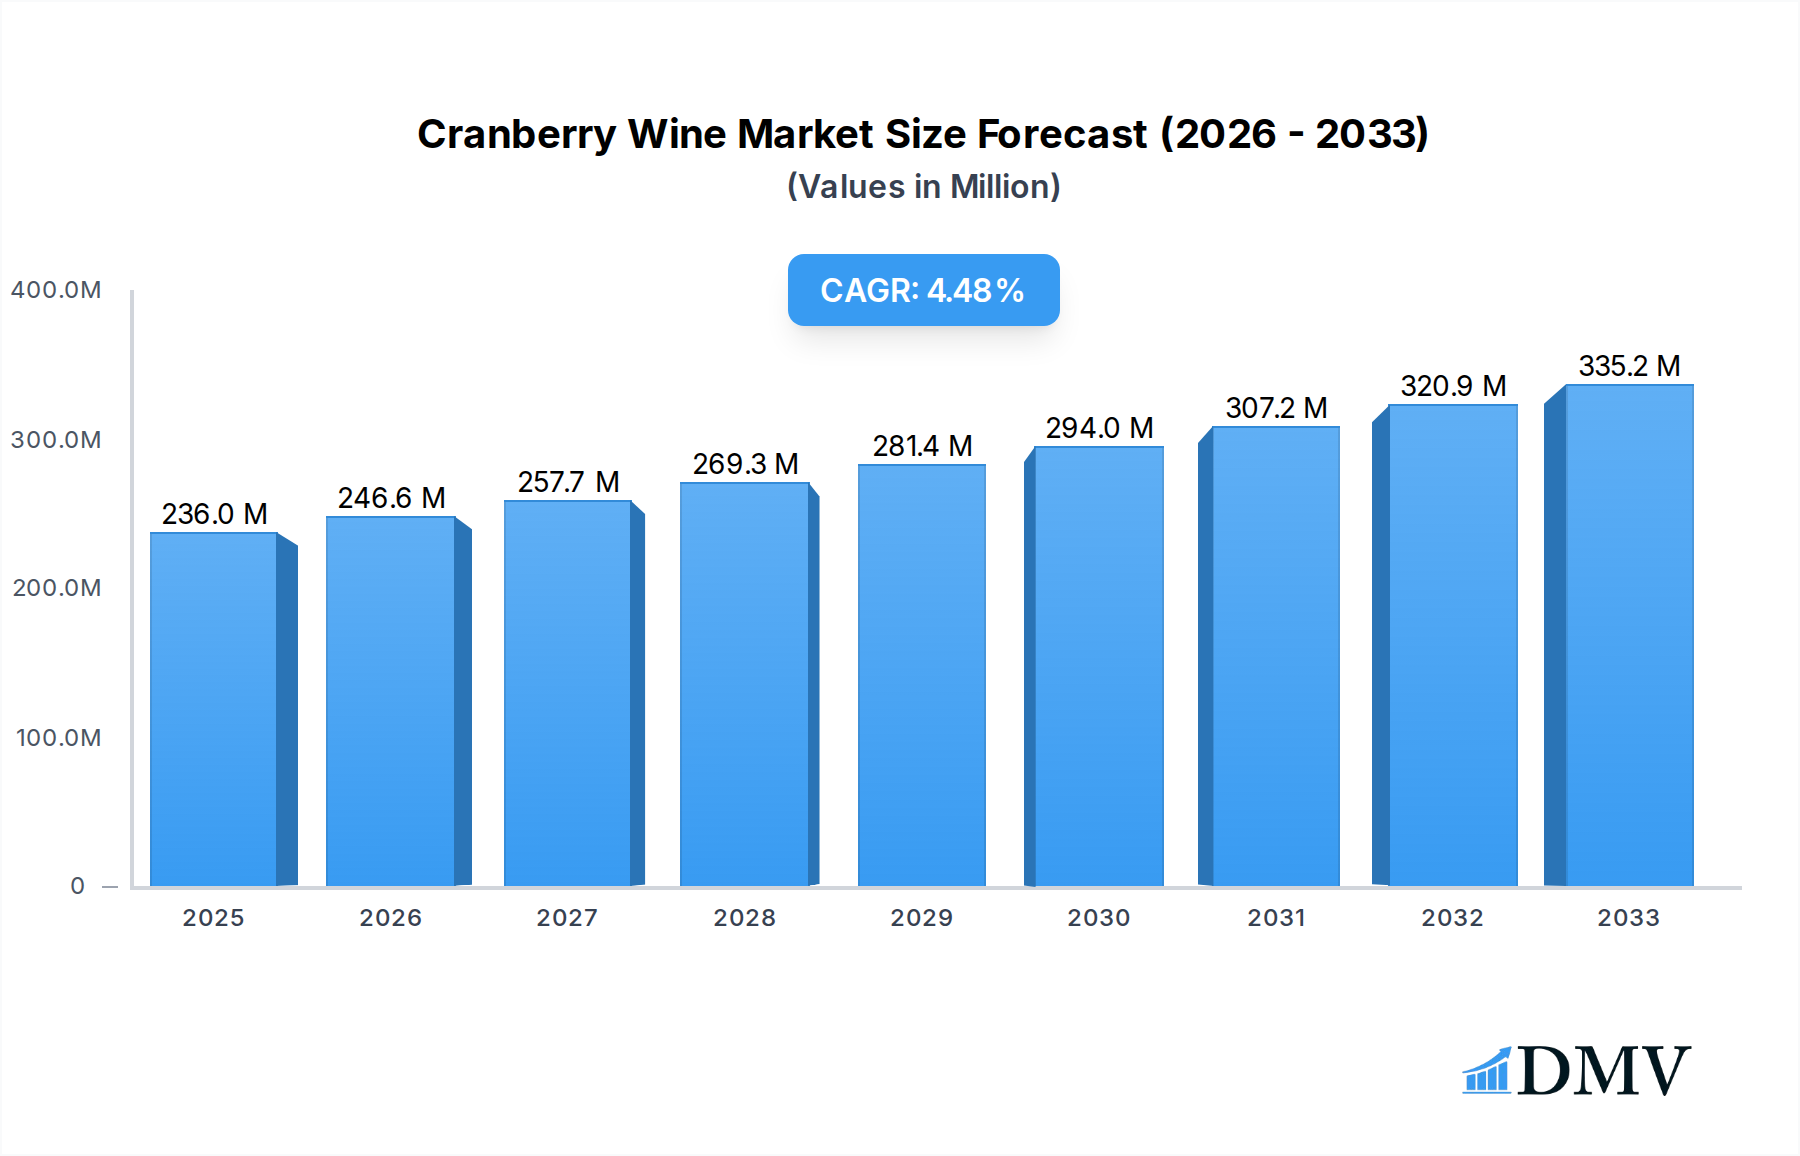
Cranberry Wine Market Size (In Million)
The market landscape is characterized by a dynamic interplay of opportunities and challenges. While the demand for unique wine varietals continues to rise, market growth may face certain restraints. These could include the relatively higher production costs compared to grape-based wines, potential seasonal availability of raw cranberries impacting consistent supply, and established consumer preferences for traditional wine types. However, the industry is actively innovating, with a focus on developing premium cranberry wine products with diverse flavor profiles and appealing packaging. The market is segmented by application, with Convenience Stores, Supermarkets, Bars, and Online Sales emerging as key consumption avenues, alongside "Others" encompassing niche markets and direct-to-consumer sales. In terms of type, wines with an Alcohol by Volume (ABV) of 22% are likely to capture significant attention. Leading companies such as Leelanau Cellars, Pasek Cellars, and Fort Wine Co. are actively shaping the market through product development and strategic marketing initiatives.

Cranberry Wine Company Market Share
Cranberry Wine Market Composition & Trends
The global cranberry wine market is characterized by a moderate to high concentration, with key players like Leelanau Cellars, Pasek Cellars, and Fort Wine Co. holding significant market share. Innovation catalysts driving this segment include advancements in fermentation techniques, the growing consumer preference for unique fruit wines, and the expansion of niche beverage categories. The regulatory landscape, particularly concerning labeling standards and alcohol content regulations (e.g., Alcohol by Volume: 22%), plays a crucial role in shaping market entry and product development. Substitute products, such as other fruit wines, ciders, and even spirits infused with cranberry flavors, present a constant competitive pressure. End-user profiles range from casual consumers seeking novel drinking experiences to connoisseurs appreciating the tartness and complexity of cranberry wines, often found in convenience stores, supermarkets, and bars. Mergers and acquisitions (M&A) activities, with estimated deal values in the hundreds of millions of dollars, are expected to continue as larger beverage corporations seek to diversify their portfolios and expand into the growing specialty wine sector. The overall market share distribution indicates a steady upward trend for cranberry wine, particularly in regions with a strong agricultural base for cranberries and a receptive consumer market.
- Market Concentration: Moderate to High
- Innovation Catalysts: Fermentation technology, consumer demand for fruit wines, niche beverage expansion.
- Regulatory Landscape: Labeling standards, alcohol content regulations.
- Substitute Products: Other fruit wines, ciders, cranberry-flavored spirits.
- End-User Profiles: Casual consumers, wine enthusiasts.
- M&A Deal Values: Estimated in the hundreds of millions of dollars.
Cranberry Wine Industry Evolution
The cranberry wine industry has witnessed significant evolution throughout the historical period (2019–2024) and is poised for substantial growth during the forecast period (2025–2033). Market growth trajectories have been consistently positive, fueled by a burgeoning consumer interest in artisanal and specialty beverages. Technological advancements in winemaking, including improved yeast strains for fruit fermentation, enhanced quality control measures, and sophisticated aging techniques, have elevated the perceived quality and appeal of cranberry wines. Shifting consumer demands are a primary driver; there's an increasing inclination towards unique flavor profiles, natural ingredients, and products with a distinct story and origin. Consumers are actively seeking alternatives to traditional grape wines, and cranberry wine, with its distinct tartness and vibrant color, has successfully captured a segment of this evolving market. The base year (2025) and estimated year (2025) showcase a mature yet rapidly expanding market, with projected annual growth rates in the high single digits. Adoption metrics for cranberry wine have shown a steady increase, particularly in markets where cranberries are culturally significant or readily available. The study period (2019–2033) encompasses a dynamic phase, from early adoption and market formation to anticipated widespread acceptance and diversification. The industry's capacity to adapt to changing palates and leverage unique agricultural strengths will be paramount in sustaining its upward momentum. The expansion into online sales channels has also democratized access, further accelerating market penetration and consumer engagement.
Leading Regions, Countries, or Segments in Cranberry Wine
The convenience store and supermarket segments are identified as the dominant channels for cranberry wine distribution, driven by their accessibility and broad consumer reach. In terms of geographic dominance, North America, particularly the United States, is a leading region due to its significant cranberry cultivation and a well-established market for fruit wines. The segment with Alcohol by Volume: 22% represents a significant niche, catering to consumers who prefer a slightly higher alcohol content in their fruit wines, offering a richer and more concentrated flavor profile. This specific alcohol percentage often appeals to those seeking a wine that can stand up to certain food pairings or be enjoyed as a standalone beverage with more body.
- Dominant Applications: Convenience Store, Supermarket.
- Key Drivers: High foot traffic, impulse purchases, widespread availability of a variety of beverage options, and established retail partnerships. Convenience stores are crucial for immediate consumption needs, while supermarkets cater to a broader audience seeking to stock their cellars.
- Dominant Type: Alcohol by Volume: 22%.
- Key Drivers: Consumer preference for robust flavors, perceived higher quality, and suitability for specific occasions or as a digestive. This segment benefits from a consumer base willing to explore premium fruit wine options.
- Leading Region: North America (specifically the United States).
- Key Drivers: Significant domestic cranberry production, a mature wine-drinking culture open to variations, and strong marketing efforts from established wineries like Leelanau Cellars and Island Grove Ag Products (IGAP). The presence of numerous cranberry bogs and a history of fruit-based beverage production provide a strong foundation.
- Emerging Segments: Online Sales are rapidly gaining traction, offering direct-to-consumer (DTC) opportunities and wider geographic reach for smaller producers.
Cranberry Wine Product Innovations
Product innovations in the cranberry wine market are increasingly focusing on enhancing flavor complexity and exploring unique aging processes. Companies are experimenting with different cranberry varietals and blending them with other fruits to create distinct taste profiles. Advancements in fermentation control allow for precise management of tartness and sweetness, leading to more balanced and appealing wines. For instance, the development of oak-aged cranberry wines offers a more sophisticated and nuanced drinking experience, attracting a segment of the market that appreciates aged wines. These innovations, coupled with sustainable sourcing and eco-friendly packaging, are key selling propositions that resonate with environmentally conscious consumers. The performance metrics of these innovative products are being measured by consumer acceptance, repeat purchase rates, and critical acclaim at industry competitions, all pointing towards a growing appreciation for quality and unique offerings.
Propelling Factors for Cranberry Wine Growth
Several factors are propelling the growth of the cranberry wine market. Economically, the increasing disposable income and a growing middle class in emerging markets are leading to higher spending on premium and specialty beverages. Technologically, advancements in fermentation and aging techniques are improving the quality and consistency of cranberry wines, making them more appealing to a wider audience. Regulatory support, in some regions, for agricultural diversification and local product promotion also contributes positively. Furthermore, the rising trend of "drink local" and support for artisanal products is benefiting cranberry wine producers. Consumer demand for healthier or perceived healthier beverage options, with cranberries known for their antioxidant properties, also plays a role.
Obstacles in the Cranberry Wine Market
Despite the positive outlook, the cranberry wine market faces certain obstacles. Regulatory challenges, particularly variations in alcohol taxation and labeling laws across different regions, can hinder market expansion and increase operational costs. Supply chain disruptions, including fluctuations in cranberry crop yields due to weather patterns or disease, can impact production volumes and pricing. Competitive pressures from established grape wine categories and other fruit wines are significant, requiring cranberry wine producers to continually innovate and market effectively. Furthermore, the perception of cranberry wine as a niche or seasonal product in some markets can limit its broader adoption.
Future Opportunities in Cranberry Wine
Emerging opportunities in the cranberry wine market are abundant. The expansion of online sales and direct-to-consumer models offers significant potential for reaching a global customer base and building direct relationships. The development of low-alcohol or no-alcohol cranberry wine variations could tap into the growing health-conscious consumer segment. Collaborations with the food industry for novel pairings and culinary applications present another avenue for growth. Furthermore, tapping into the growing tourism sector with winery tours and tasting experiences, particularly in regions with strong cranberry heritage, can drive both sales and brand loyalty. The increasing consumer interest in fortified wines also presents an opportunity for enhanced cranberry wine offerings.
Major Players in the Cranberry Wine Ecosystem
- Leelanau Cellars
- Pasek Cellars
- Fort Wine Co.
- DNA Vintners
- Lynfred Winery
- Island Grove Ag Products (IGAP)
- Lakeshore Farms Wine
- Robert Mazza, Inc.
Key Developments in Cranberry Wine Industry
- 2024/05: Launch of new cranberry wine varietals with lower acidity by Lynfred Winery, targeting a broader consumer palate.
- 2023/11: Leelanau Cellars expands its distribution network into new international markets, focusing on Europe and Asia.
- 2023/07: Island Grove Ag Products (IGAP) announces a significant investment in sustainable cranberry farming practices to ensure consistent supply.
- 2022/09: Fort Wine Co. introduces an oak-aged cranberry wine, receiving positive reviews and increasing market segment appeal.
- 2021/04: Pasek Cellars pioneers a new fermentation technique that enhances the natural sweetness of cranberries, reducing the need for added sugars.
Strategic Cranberry Wine Market Forecast
The strategic cranberry wine market forecast indicates sustained and robust growth driven by increasing consumer adoption of specialty beverages and ongoing product innovation. The convenience store and supermarket channels will remain pivotal for accessibility, while the expansion of online sales will unlock new geographic markets and direct consumer engagement. Key growth catalysts include the persistent trend towards unique flavor profiles, the growing appreciation for artisanal products, and advancements in winemaking technology that enhance quality and consistency. The market's ability to leverage the inherent appeal of cranberries—their health perceptions and vibrant character—will be crucial in capturing a larger share of the global beverage market. Forecasts suggest a compound annual growth rate (CAGR) of approximately XX% for the forecast period, with total market value projected to reach billions of dollars by 2033.
Cranberry Wine Segmentation
-
1. Application
- 1.1. Convenience Store
- 1.2. Supermarket
- 1.3. Bars
- 1.4. Online Sales
- 1.5. Others
-
2. Type
- 2.1. Alcohol by Volume:<11%
- 2.2. Alcohol by Volume:11-22%
- 2.3. Alcohol by Volume:>22%
Cranberry Wine Segmentation By Geography
-
1. North America
- 1.1. United States
- 1.2. Canada
- 1.3. Mexico
-
2. South America
- 2.1. Brazil
- 2.2. Argentina
- 2.3. Rest of South America
-
3. Europe
- 3.1. United Kingdom
- 3.2. Germany
- 3.3. France
- 3.4. Italy
- 3.5. Spain
- 3.6. Russia
- 3.7. Benelux
- 3.8. Nordics
- 3.9. Rest of Europe
-
4. Middle East & Africa
- 4.1. Turkey
- 4.2. Israel
- 4.3. GCC
- 4.4. North Africa
- 4.5. South Africa
- 4.6. Rest of Middle East & Africa
-
5. Asia Pacific
- 5.1. China
- 5.2. India
- 5.3. Japan
- 5.4. South Korea
- 5.5. ASEAN
- 5.6. Oceania
- 5.7. Rest of Asia Pacific

Cranberry Wine Regional Market Share
Geographic Coverage of Cranberry Wine
Cranberry Wine REPORT HIGHLIGHTS
| Aspects | Details |
|---|---|
| Study Period | 2020-2034 |
| Base Year | 2025 |
| Estimated Year | 2026 |
| Forecast Period | 2026-2034 |
| Historical Period | 2020-2025 |
| Growth Rate | CAGR of 4.4% from 2020-2034 |
| Segmentation |
|
Table of Contents
- 1. Introduction
- 1.1. Research Scope
- 1.2. Market Segmentation
- 1.3. Research Objective
- 1.4. Definitions and Assumptions
- 2. Executive Summary
- 2.1. Market Snapshot
- 3. Market Dynamics
- 3.1. Market Drivers
- 3.2. Market Restrains
- 3.3. Market Trends
- 3.4. Market Opportunities
- 4. Market Factor Analysis
- 4.1. Porters Five Forces
- 4.1.1. Bargaining Power of Suppliers
- 4.1.2. Bargaining Power of Buyers
- 4.1.3. Threat of New Entrants
- 4.1.4. Threat of Substitutes
- 4.1.5. Competitive Rivalry
- 4.2. PESTEL analysis
- 4.3. BCG Analysis
- 4.3.1. Stars (High Growth, High Market Share)
- 4.3.2. Cash Cows (Low Growth, High Market Share)
- 4.3.3. Question Mark (High Growth, Low Market Share)
- 4.3.4. Dogs (Low Growth, Low Market Share)
- 4.4. Ansoff Matrix Analysis
- 4.5. Supply Chain Analysis
- 4.6. Regulatory Landscape
- 4.7. Current Market Potential and Opportunity Assessment (TAM–SAM–SOM Framework)
- 4.8. DMV Analyst Note
- 4.1. Porters Five Forces
- 5. Market Analysis, Insights and Forecast 2021-2033
- 5.1. Market Analysis, Insights and Forecast - by Application
- 5.1.1. Convenience Store
- 5.1.2. Supermarket
- 5.1.3. Bars
- 5.1.4. Online Sales
- 5.1.5. Others
- 5.2. Market Analysis, Insights and Forecast - by Type
- 5.2.1. Alcohol by Volume:<11%
- 5.2.2. Alcohol by Volume:11-22%
- 5.2.3. Alcohol by Volume:>22%
- 5.3. Market Analysis, Insights and Forecast - by Region
- 5.3.1. North America
- 5.3.2. South America
- 5.3.3. Europe
- 5.3.4. Middle East & Africa
- 5.3.5. Asia Pacific
- 5.1. Market Analysis, Insights and Forecast - by Application
- 6. Global Cranberry Wine Analysis, Insights and Forecast, 2021-2033
- 6.1. Market Analysis, Insights and Forecast - by Application
- 6.1.1. Convenience Store
- 6.1.2. Supermarket
- 6.1.3. Bars
- 6.1.4. Online Sales
- 6.1.5. Others
- 6.2. Market Analysis, Insights and Forecast - by Type
- 6.2.1. Alcohol by Volume:<11%
- 6.2.2. Alcohol by Volume:11-22%
- 6.2.3. Alcohol by Volume:>22%
- 6.1. Market Analysis, Insights and Forecast - by Application
- 7. North America Cranberry Wine Analysis, Insights and Forecast, 2020-2032
- 7.1. Market Analysis, Insights and Forecast - by Application
- 7.1.1. Convenience Store
- 7.1.2. Supermarket
- 7.1.3. Bars
- 7.1.4. Online Sales
- 7.1.5. Others
- 7.2. Market Analysis, Insights and Forecast - by Type
- 7.2.1. Alcohol by Volume:<11%
- 7.2.2. Alcohol by Volume:11-22%
- 7.2.3. Alcohol by Volume:>22%
- 7.1. Market Analysis, Insights and Forecast - by Application
- 8. South America Cranberry Wine Analysis, Insights and Forecast, 2020-2032
- 8.1. Market Analysis, Insights and Forecast - by Application
- 8.1.1. Convenience Store
- 8.1.2. Supermarket
- 8.1.3. Bars
- 8.1.4. Online Sales
- 8.1.5. Others
- 8.2. Market Analysis, Insights and Forecast - by Type
- 8.2.1. Alcohol by Volume:<11%
- 8.2.2. Alcohol by Volume:11-22%
- 8.2.3. Alcohol by Volume:>22%
- 8.1. Market Analysis, Insights and Forecast - by Application
- 9. Europe Cranberry Wine Analysis, Insights and Forecast, 2020-2032
- 9.1. Market Analysis, Insights and Forecast - by Application
- 9.1.1. Convenience Store
- 9.1.2. Supermarket
- 9.1.3. Bars
- 9.1.4. Online Sales
- 9.1.5. Others
- 9.2. Market Analysis, Insights and Forecast - by Type
- 9.2.1. Alcohol by Volume:<11%
- 9.2.2. Alcohol by Volume:11-22%
- 9.2.3. Alcohol by Volume:>22%
- 9.1. Market Analysis, Insights and Forecast - by Application
- 10. Middle East & Africa Cranberry Wine Analysis, Insights and Forecast, 2020-2032
- 10.1. Market Analysis, Insights and Forecast - by Application
- 10.1.1. Convenience Store
- 10.1.2. Supermarket
- 10.1.3. Bars
- 10.1.4. Online Sales
- 10.1.5. Others
- 10.2. Market Analysis, Insights and Forecast - by Type
- 10.2.1. Alcohol by Volume:<11%
- 10.2.2. Alcohol by Volume:11-22%
- 10.2.3. Alcohol by Volume:>22%
- 10.1. Market Analysis, Insights and Forecast - by Application
- 11. Asia Pacific Cranberry Wine Analysis, Insights and Forecast, 2020-2032
- 11.1. Market Analysis, Insights and Forecast - by Application
- 11.1.1. Convenience Store
- 11.1.2. Supermarket
- 11.1.3. Bars
- 11.1.4. Online Sales
- 11.1.5. Others
- 11.2. Market Analysis, Insights and Forecast - by Type
- 11.2.1. Alcohol by Volume:<11%
- 11.2.2. Alcohol by Volume:11-22%
- 11.2.3. Alcohol by Volume:>22%
- 11.1. Market Analysis, Insights and Forecast - by Application
- 12. Competitive Analysis
- 12.1. Company Profiles
- 12.1.1 Leelanau Cellars
- 12.1.1.1. Company Overview
- 12.1.1.2. Products
- 12.1.1.3. Company Financials
- 12.1.1.4. SWOT Analysis
- 12.1.2 Pasek Cellars
- 12.1.2.1. Company Overview
- 12.1.2.2. Products
- 12.1.2.3. Company Financials
- 12.1.2.4. SWOT Analysis
- 12.1.3 Fort Wine Co.
- 12.1.3.1. Company Overview
- 12.1.3.2. Products
- 12.1.3.3. Company Financials
- 12.1.3.4. SWOT Analysis
- 12.1.4 DNA Vintners
- 12.1.4.1. Company Overview
- 12.1.4.2. Products
- 12.1.4.3. Company Financials
- 12.1.4.4. SWOT Analysis
- 12.1.5 Lynfred Winery
- 12.1.5.1. Company Overview
- 12.1.5.2. Products
- 12.1.5.3. Company Financials
- 12.1.5.4. SWOT Analysis
- 12.1.6 Island Grove Ag Products (IGAP)
- 12.1.6.1. Company Overview
- 12.1.6.2. Products
- 12.1.6.3. Company Financials
- 12.1.6.4. SWOT Analysis
- 12.1.7 Lakeshore Farms Wine
- 12.1.7.1. Company Overview
- 12.1.7.2. Products
- 12.1.7.3. Company Financials
- 12.1.7.4. SWOT Analysis
- 12.1.8 Robert Mazza
- 12.1.8.1. Company Overview
- 12.1.8.2. Products
- 12.1.8.3. Company Financials
- 12.1.8.4. SWOT Analysis
- 12.1.9 Inc.
- 12.1.9.1. Company Overview
- 12.1.9.2. Products
- 12.1.9.3. Company Financials
- 12.1.9.4. SWOT Analysis
- 12.1.1 Leelanau Cellars
- 12.2. Market Entropy
- 12.2.1 Company's Key Areas Served
- 12.2.2 Recent Developments
- 12.3. Company Market Share Analysis 2025
- 12.3.1 Top 5 Companies Market Share Analysis
- 12.3.2 Top 3 Companies Market Share Analysis
- 12.4. List of Potential Customers
- 13. Research Methodology
List of Figures
- Figure 1: Global Cranberry Wine Revenue Breakdown (million, %) by Region 2025 & 2033
- Figure 2: Global Cranberry Wine Volume Breakdown (K, %) by Region 2025 & 2033
- Figure 3: North America Cranberry Wine Revenue (million), by Application 2025 & 2033
- Figure 4: North America Cranberry Wine Volume (K), by Application 2025 & 2033
- Figure 5: North America Cranberry Wine Revenue Share (%), by Application 2025 & 2033
- Figure 6: North America Cranberry Wine Volume Share (%), by Application 2025 & 2033
- Figure 7: North America Cranberry Wine Revenue (million), by Type 2025 & 2033
- Figure 8: North America Cranberry Wine Volume (K), by Type 2025 & 2033
- Figure 9: North America Cranberry Wine Revenue Share (%), by Type 2025 & 2033
- Figure 10: North America Cranberry Wine Volume Share (%), by Type 2025 & 2033
- Figure 11: North America Cranberry Wine Revenue (million), by Country 2025 & 2033
- Figure 12: North America Cranberry Wine Volume (K), by Country 2025 & 2033
- Figure 13: North America Cranberry Wine Revenue Share (%), by Country 2025 & 2033
- Figure 14: North America Cranberry Wine Volume Share (%), by Country 2025 & 2033
- Figure 15: South America Cranberry Wine Revenue (million), by Application 2025 & 2033
- Figure 16: South America Cranberry Wine Volume (K), by Application 2025 & 2033
- Figure 17: South America Cranberry Wine Revenue Share (%), by Application 2025 & 2033
- Figure 18: South America Cranberry Wine Volume Share (%), by Application 2025 & 2033
- Figure 19: South America Cranberry Wine Revenue (million), by Type 2025 & 2033
- Figure 20: South America Cranberry Wine Volume (K), by Type 2025 & 2033
- Figure 21: South America Cranberry Wine Revenue Share (%), by Type 2025 & 2033
- Figure 22: South America Cranberry Wine Volume Share (%), by Type 2025 & 2033
- Figure 23: South America Cranberry Wine Revenue (million), by Country 2025 & 2033
- Figure 24: South America Cranberry Wine Volume (K), by Country 2025 & 2033
- Figure 25: South America Cranberry Wine Revenue Share (%), by Country 2025 & 2033
- Figure 26: South America Cranberry Wine Volume Share (%), by Country 2025 & 2033
- Figure 27: Europe Cranberry Wine Revenue (million), by Application 2025 & 2033
- Figure 28: Europe Cranberry Wine Volume (K), by Application 2025 & 2033
- Figure 29: Europe Cranberry Wine Revenue Share (%), by Application 2025 & 2033
- Figure 30: Europe Cranberry Wine Volume Share (%), by Application 2025 & 2033
- Figure 31: Europe Cranberry Wine Revenue (million), by Type 2025 & 2033
- Figure 32: Europe Cranberry Wine Volume (K), by Type 2025 & 2033
- Figure 33: Europe Cranberry Wine Revenue Share (%), by Type 2025 & 2033
- Figure 34: Europe Cranberry Wine Volume Share (%), by Type 2025 & 2033
- Figure 35: Europe Cranberry Wine Revenue (million), by Country 2025 & 2033
- Figure 36: Europe Cranberry Wine Volume (K), by Country 2025 & 2033
- Figure 37: Europe Cranberry Wine Revenue Share (%), by Country 2025 & 2033
- Figure 38: Europe Cranberry Wine Volume Share (%), by Country 2025 & 2033
- Figure 39: Middle East & Africa Cranberry Wine Revenue (million), by Application 2025 & 2033
- Figure 40: Middle East & Africa Cranberry Wine Volume (K), by Application 2025 & 2033
- Figure 41: Middle East & Africa Cranberry Wine Revenue Share (%), by Application 2025 & 2033
- Figure 42: Middle East & Africa Cranberry Wine Volume Share (%), by Application 2025 & 2033
- Figure 43: Middle East & Africa Cranberry Wine Revenue (million), by Type 2025 & 2033
- Figure 44: Middle East & Africa Cranberry Wine Volume (K), by Type 2025 & 2033
- Figure 45: Middle East & Africa Cranberry Wine Revenue Share (%), by Type 2025 & 2033
- Figure 46: Middle East & Africa Cranberry Wine Volume Share (%), by Type 2025 & 2033
- Figure 47: Middle East & Africa Cranberry Wine Revenue (million), by Country 2025 & 2033
- Figure 48: Middle East & Africa Cranberry Wine Volume (K), by Country 2025 & 2033
- Figure 49: Middle East & Africa Cranberry Wine Revenue Share (%), by Country 2025 & 2033
- Figure 50: Middle East & Africa Cranberry Wine Volume Share (%), by Country 2025 & 2033
- Figure 51: Asia Pacific Cranberry Wine Revenue (million), by Application 2025 & 2033
- Figure 52: Asia Pacific Cranberry Wine Volume (K), by Application 2025 & 2033
- Figure 53: Asia Pacific Cranberry Wine Revenue Share (%), by Application 2025 & 2033
- Figure 54: Asia Pacific Cranberry Wine Volume Share (%), by Application 2025 & 2033
- Figure 55: Asia Pacific Cranberry Wine Revenue (million), by Type 2025 & 2033
- Figure 56: Asia Pacific Cranberry Wine Volume (K), by Type 2025 & 2033
- Figure 57: Asia Pacific Cranberry Wine Revenue Share (%), by Type 2025 & 2033
- Figure 58: Asia Pacific Cranberry Wine Volume Share (%), by Type 2025 & 2033
- Figure 59: Asia Pacific Cranberry Wine Revenue (million), by Country 2025 & 2033
- Figure 60: Asia Pacific Cranberry Wine Volume (K), by Country 2025 & 2033
- Figure 61: Asia Pacific Cranberry Wine Revenue Share (%), by Country 2025 & 2033
- Figure 62: Asia Pacific Cranberry Wine Volume Share (%), by Country 2025 & 2033
List of Tables
- Table 1: Global Cranberry Wine Revenue million Forecast, by Application 2020 & 2033
- Table 2: Global Cranberry Wine Volume K Forecast, by Application 2020 & 2033
- Table 3: Global Cranberry Wine Revenue million Forecast, by Type 2020 & 2033
- Table 4: Global Cranberry Wine Volume K Forecast, by Type 2020 & 2033
- Table 5: Global Cranberry Wine Revenue million Forecast, by Region 2020 & 2033
- Table 6: Global Cranberry Wine Volume K Forecast, by Region 2020 & 2033
- Table 7: Global Cranberry Wine Revenue million Forecast, by Application 2020 & 2033
- Table 8: Global Cranberry Wine Volume K Forecast, by Application 2020 & 2033
- Table 9: Global Cranberry Wine Revenue million Forecast, by Type 2020 & 2033
- Table 10: Global Cranberry Wine Volume K Forecast, by Type 2020 & 2033
- Table 11: Global Cranberry Wine Revenue million Forecast, by Country 2020 & 2033
- Table 12: Global Cranberry Wine Volume K Forecast, by Country 2020 & 2033
- Table 13: United States Cranberry Wine Revenue (million) Forecast, by Application 2020 & 2033
- Table 14: United States Cranberry Wine Volume (K) Forecast, by Application 2020 & 2033
- Table 15: Canada Cranberry Wine Revenue (million) Forecast, by Application 2020 & 2033
- Table 16: Canada Cranberry Wine Volume (K) Forecast, by Application 2020 & 2033
- Table 17: Mexico Cranberry Wine Revenue (million) Forecast, by Application 2020 & 2033
- Table 18: Mexico Cranberry Wine Volume (K) Forecast, by Application 2020 & 2033
- Table 19: Global Cranberry Wine Revenue million Forecast, by Application 2020 & 2033
- Table 20: Global Cranberry Wine Volume K Forecast, by Application 2020 & 2033
- Table 21: Global Cranberry Wine Revenue million Forecast, by Type 2020 & 2033
- Table 22: Global Cranberry Wine Volume K Forecast, by Type 2020 & 2033
- Table 23: Global Cranberry Wine Revenue million Forecast, by Country 2020 & 2033
- Table 24: Global Cranberry Wine Volume K Forecast, by Country 2020 & 2033
- Table 25: Brazil Cranberry Wine Revenue (million) Forecast, by Application 2020 & 2033
- Table 26: Brazil Cranberry Wine Volume (K) Forecast, by Application 2020 & 2033
- Table 27: Argentina Cranberry Wine Revenue (million) Forecast, by Application 2020 & 2033
- Table 28: Argentina Cranberry Wine Volume (K) Forecast, by Application 2020 & 2033
- Table 29: Rest of South America Cranberry Wine Revenue (million) Forecast, by Application 2020 & 2033
- Table 30: Rest of South America Cranberry Wine Volume (K) Forecast, by Application 2020 & 2033
- Table 31: Global Cranberry Wine Revenue million Forecast, by Application 2020 & 2033
- Table 32: Global Cranberry Wine Volume K Forecast, by Application 2020 & 2033
- Table 33: Global Cranberry Wine Revenue million Forecast, by Type 2020 & 2033
- Table 34: Global Cranberry Wine Volume K Forecast, by Type 2020 & 2033
- Table 35: Global Cranberry Wine Revenue million Forecast, by Country 2020 & 2033
- Table 36: Global Cranberry Wine Volume K Forecast, by Country 2020 & 2033
- Table 37: United Kingdom Cranberry Wine Revenue (million) Forecast, by Application 2020 & 2033
- Table 38: United Kingdom Cranberry Wine Volume (K) Forecast, by Application 2020 & 2033
- Table 39: Germany Cranberry Wine Revenue (million) Forecast, by Application 2020 & 2033
- Table 40: Germany Cranberry Wine Volume (K) Forecast, by Application 2020 & 2033
- Table 41: France Cranberry Wine Revenue (million) Forecast, by Application 2020 & 2033
- Table 42: France Cranberry Wine Volume (K) Forecast, by Application 2020 & 2033
- Table 43: Italy Cranberry Wine Revenue (million) Forecast, by Application 2020 & 2033
- Table 44: Italy Cranberry Wine Volume (K) Forecast, by Application 2020 & 2033
- Table 45: Spain Cranberry Wine Revenue (million) Forecast, by Application 2020 & 2033
- Table 46: Spain Cranberry Wine Volume (K) Forecast, by Application 2020 & 2033
- Table 47: Russia Cranberry Wine Revenue (million) Forecast, by Application 2020 & 2033
- Table 48: Russia Cranberry Wine Volume (K) Forecast, by Application 2020 & 2033
- Table 49: Benelux Cranberry Wine Revenue (million) Forecast, by Application 2020 & 2033
- Table 50: Benelux Cranberry Wine Volume (K) Forecast, by Application 2020 & 2033
- Table 51: Nordics Cranberry Wine Revenue (million) Forecast, by Application 2020 & 2033
- Table 52: Nordics Cranberry Wine Volume (K) Forecast, by Application 2020 & 2033
- Table 53: Rest of Europe Cranberry Wine Revenue (million) Forecast, by Application 2020 & 2033
- Table 54: Rest of Europe Cranberry Wine Volume (K) Forecast, by Application 2020 & 2033
- Table 55: Global Cranberry Wine Revenue million Forecast, by Application 2020 & 2033
- Table 56: Global Cranberry Wine Volume K Forecast, by Application 2020 & 2033
- Table 57: Global Cranberry Wine Revenue million Forecast, by Type 2020 & 2033
- Table 58: Global Cranberry Wine Volume K Forecast, by Type 2020 & 2033
- Table 59: Global Cranberry Wine Revenue million Forecast, by Country 2020 & 2033
- Table 60: Global Cranberry Wine Volume K Forecast, by Country 2020 & 2033
- Table 61: Turkey Cranberry Wine Revenue (million) Forecast, by Application 2020 & 2033
- Table 62: Turkey Cranberry Wine Volume (K) Forecast, by Application 2020 & 2033
- Table 63: Israel Cranberry Wine Revenue (million) Forecast, by Application 2020 & 2033
- Table 64: Israel Cranberry Wine Volume (K) Forecast, by Application 2020 & 2033
- Table 65: GCC Cranberry Wine Revenue (million) Forecast, by Application 2020 & 2033
- Table 66: GCC Cranberry Wine Volume (K) Forecast, by Application 2020 & 2033
- Table 67: North Africa Cranberry Wine Revenue (million) Forecast, by Application 2020 & 2033
- Table 68: North Africa Cranberry Wine Volume (K) Forecast, by Application 2020 & 2033
- Table 69: South Africa Cranberry Wine Revenue (million) Forecast, by Application 2020 & 2033
- Table 70: South Africa Cranberry Wine Volume (K) Forecast, by Application 2020 & 2033
- Table 71: Rest of Middle East & Africa Cranberry Wine Revenue (million) Forecast, by Application 2020 & 2033
- Table 72: Rest of Middle East & Africa Cranberry Wine Volume (K) Forecast, by Application 2020 & 2033
- Table 73: Global Cranberry Wine Revenue million Forecast, by Application 2020 & 2033
- Table 74: Global Cranberry Wine Volume K Forecast, by Application 2020 & 2033
- Table 75: Global Cranberry Wine Revenue million Forecast, by Type 2020 & 2033
- Table 76: Global Cranberry Wine Volume K Forecast, by Type 2020 & 2033
- Table 77: Global Cranberry Wine Revenue million Forecast, by Country 2020 & 2033
- Table 78: Global Cranberry Wine Volume K Forecast, by Country 2020 & 2033
- Table 79: China Cranberry Wine Revenue (million) Forecast, by Application 2020 & 2033
- Table 80: China Cranberry Wine Volume (K) Forecast, by Application 2020 & 2033
- Table 81: India Cranberry Wine Revenue (million) Forecast, by Application 2020 & 2033
- Table 82: India Cranberry Wine Volume (K) Forecast, by Application 2020 & 2033
- Table 83: Japan Cranberry Wine Revenue (million) Forecast, by Application 2020 & 2033
- Table 84: Japan Cranberry Wine Volume (K) Forecast, by Application 2020 & 2033
- Table 85: South Korea Cranberry Wine Revenue (million) Forecast, by Application 2020 & 2033
- Table 86: South Korea Cranberry Wine Volume (K) Forecast, by Application 2020 & 2033
- Table 87: ASEAN Cranberry Wine Revenue (million) Forecast, by Application 2020 & 2033
- Table 88: ASEAN Cranberry Wine Volume (K) Forecast, by Application 2020 & 2033
- Table 89: Oceania Cranberry Wine Revenue (million) Forecast, by Application 2020 & 2033
- Table 90: Oceania Cranberry Wine Volume (K) Forecast, by Application 2020 & 2033
- Table 91: Rest of Asia Pacific Cranberry Wine Revenue (million) Forecast, by Application 2020 & 2033
- Table 92: Rest of Asia Pacific Cranberry Wine Volume (K) Forecast, by Application 2020 & 2033
Frequently Asked Questions
1. What is the projected Compound Annual Growth Rate (CAGR) of the Cranberry Wine?
The projected CAGR is approximately 4.4%.
2. Which companies are prominent players in the Cranberry Wine?
Key companies in the market include Leelanau Cellars, Pasek Cellars, Fort Wine Co., DNA Vintners, Lynfred Winery, Island Grove Ag Products (IGAP), Lakeshore Farms Wine, Robert Mazza, Inc..
3. What are the main segments of the Cranberry Wine?
The market segments include Application, Type.
4. Can you provide details about the market size?
The market size is estimated to be USD 236 million as of 2022.
5. What are some drivers contributing to market growth?
N/A
6. What are the notable trends driving market growth?
N/A
7. Are there any restraints impacting market growth?
N/A
8. Can you provide examples of recent developments in the market?
N/A
9. What pricing options are available for accessing the report?
Pricing options include single-user, multi-user, and enterprise licenses priced at USD 3950.00, USD 5925.00, and USD 7900.00 respectively.
10. Is the market size provided in terms of value or volume?
The market size is provided in terms of value, measured in million and volume, measured in K.
11. Are there any specific market keywords associated with the report?
Yes, the market keyword associated with the report is "Cranberry Wine," which aids in identifying and referencing the specific market segment covered.
12. How do I determine which pricing option suits my needs best?
The pricing options vary based on user requirements and access needs. Individual users may opt for single-user licenses, while businesses requiring broader access may choose multi-user or enterprise licenses for cost-effective access to the report.
13. Are there any additional resources or data provided in the Cranberry Wine report?
While the report offers comprehensive insights, it's advisable to review the specific contents or supplementary materials provided to ascertain if additional resources or data are available.
14. How can I stay updated on further developments or reports in the Cranberry Wine?
To stay informed about further developments, trends, and reports in the Cranberry Wine, consider subscribing to industry newsletters, following relevant companies and organizations, or regularly checking reputable industry news sources and publications.
Methodology
Step 1 - Identification of Relevant Samples Size from Population Database


Step 2 - Approaches for Defining Global Market Size (Value, Volume* & Price*)

Note*: In applicable scenarios
Step 3 - Data Sources
Primary Research
- Web Analytics
- Survey Reports
- Research Institute
- Latest Research Reports
- Opinion Leaders
Secondary Research
- Annual Reports
- White Paper
- Latest Press Release
- Industry Association
- Paid Database
- Investor Presentations

Step 4 - Data Triangulation
Involves using different sources of information in order to increase the validity of a study
These sources are likely to be stakeholders in a program - participants, other researchers, program staff, other community members, and so on.
Then we put all data in single framework & apply various statistical tools to find out the dynamic on the market.
During the analysis stage, feedback from the stakeholder groups would be compared to determine areas of agreement as well as areas of divergence