

Key Insights
The global Cloud-based Supply Chain Control Tower market is poised for substantial expansion, projected to reach an estimated $15.2 billion in 2025. This growth is fueled by an impressive Compound Annual Growth Rate (CAGR) of 17.5% over the forecast period of 2025-2033. The increasing complexity and volatility of modern supply chains, coupled with the growing demand for real-time visibility, predictive analytics, and enhanced collaboration, are the primary drivers behind this upward trajectory. Businesses across all sectors are recognizing the indispensable role of control towers in mitigating risks, optimizing operations, and achieving greater agility. The urgent need to streamline logistics and transportation, ensure efficient fulfillment processes, gain granular inventory control, and bolster supply assurance are key functionalities that businesses are actively seeking from cloud-based solutions. Furthermore, the trend towards end-to-end supply chain control, encompassing all stages from sourcing to final delivery, is gaining significant momentum, making cloud control towers a critical enabler of this holistic approach.
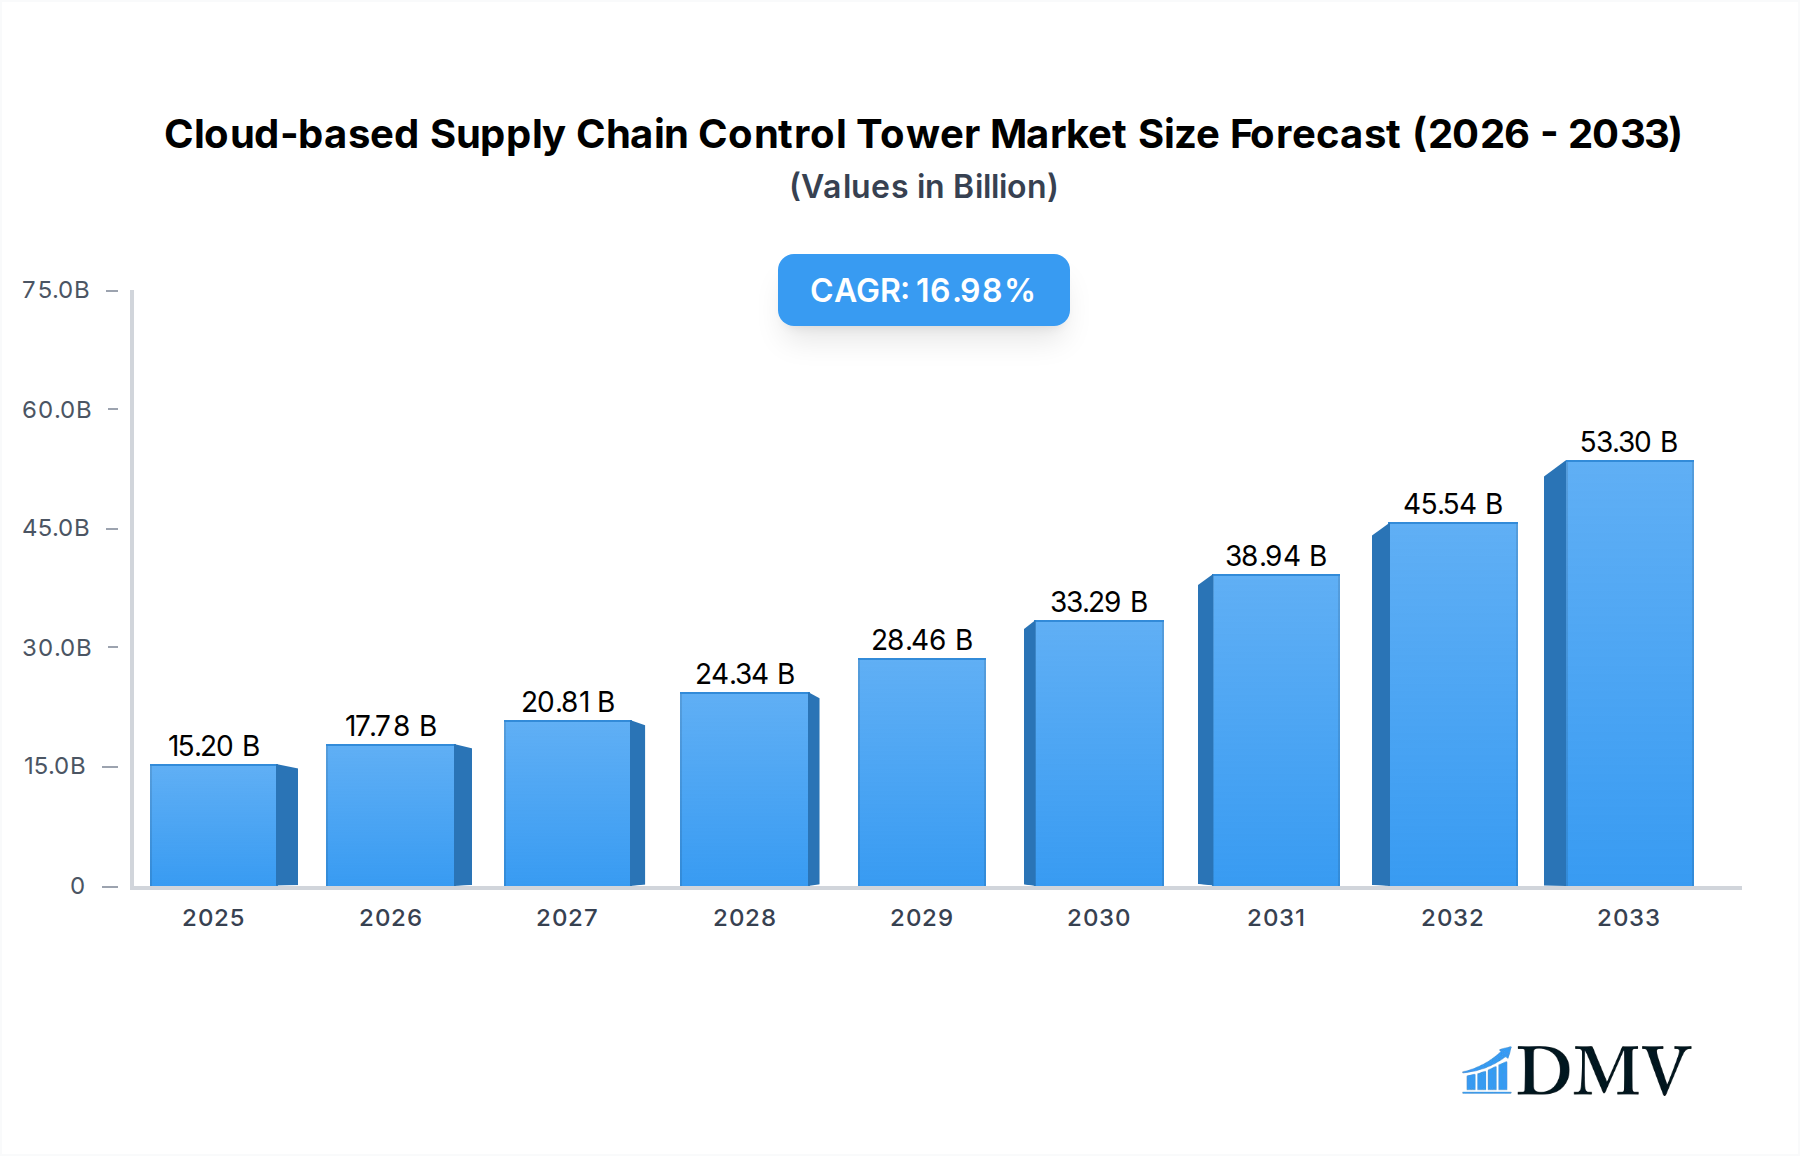
Cloud-based Supply Chain Control Tower Market Size (In Billion)
The market is characterized by a dynamic interplay of significant growth opportunities and strategic considerations for market players. While the adoption rate is high, particularly among large enterprises, the increasing accessibility and scalability of cloud solutions are also making them an attractive proposition for Small and Medium-sized Enterprises (SMEs). Key restraints to market growth include the initial implementation costs, concerns around data security and privacy, and the need for skilled personnel to effectively manage and leverage these sophisticated platforms. However, the pervasive benefits of improved decision-making, reduced operational costs, enhanced customer satisfaction, and greater resilience against disruptions are strongly outweighing these challenges. The competitive landscape is robust, with established technology giants like SAP, AWS Solutions, and IBM, alongside specialized supply chain software providers such as Blue Yonder and Kinaxis, vying for market share. Innovations in AI, machine learning, and IoT integration are expected to further propel the evolution of cloud-based supply chain control towers, offering even more sophisticated capabilities for predictive insights and proactive management.

Cloud-based Supply Chain Control Tower Company Market Share
Cloud-based Supply Chain Control Tower Market Research Report: Global Outlook & Strategic Forecast (2019-2033)
This comprehensive market intelligence report provides an in-depth analysis of the cloud-based supply chain control tower (SCCT) market, offering critical insights for stakeholders to navigate evolving industry landscapes. Covering a study period from 2019 to 2033, with a base year of 2025 and a forecast period extending to 2033, this report equips you with actionable intelligence on market composition, trends, evolution, regional dominance, product innovations, growth drivers, obstacles, future opportunities, and key players.
Cloud-based Supply Chain Control Tower Market Composition & Trends
The global cloud-based supply chain control tower market is characterized by a dynamic and evolving composition, driven by relentless innovation and increasing adoption across diverse business segments. Market concentration is moderate, with a blend of established enterprise software giants and agile, specialized SCCT providers vying for market share. Key innovation catalysts include advancements in AI/ML for predictive analytics, IoT for real-time visibility, and blockchain for enhanced traceability and security. The regulatory landscape, while generally supportive of digital transformation, presents complexities around data privacy and cross-border compliance, influencing deployment strategies. Substitute products, such as traditional ERP systems with limited visibility modules, are gradually being displaced by dedicated SCCT solutions offering superior end-to-end control. End-user profiles span from Small and Medium-sized Enterprises (SMEs) seeking cost-effective, scalable solutions to Large Enterprises demanding comprehensive, integrated platforms for managing complex global supply chains. Mergers and Acquisitions (M&A) activities are a significant trend, with estimated deal values in the billions of dollars, as larger players consolidate portfolios and acquire cutting-edge technologies to expand their offerings.
- Market Share Distribution: The market share is fragmented, with leading players like SAP, AWS Solutions, IBM, Accenture, and Blue Yonder holding substantial segments, while specialized vendors like E2open, LLamasoft, and o9 Solutions are gaining traction with their niche capabilities.
- M&A Deal Values: Significant M&A activity indicates a market consolidating around integrated solutions. Recent deals have seen valuations in the range of $1 billion to over $5 billion, reflecting the strategic importance of SCCT capabilities.
- Regulatory Impact: Data localization laws and trade agreements influence market access and integration strategies for global SCCT providers.
- Substitute Product Erosion: Traditional on-premise solutions with limited real-time data integration are progressively losing market share to flexible, scalable cloud SCCT platforms.
Cloud-based Supply Chain Control Tower Industry Evolution
The evolution of the cloud-based supply chain control tower industry is a narrative of rapid technological advancement and a growing imperative for resilient, agile, and transparent supply chains. From its nascent stages, where basic visibility tools were considered state-of-the-art, the industry has witnessed a transformative shift towards sophisticated, AI-driven platforms capable of real-time monitoring, predictive analytics, and proactive risk mitigation. The historical period (2019-2024) saw initial adoption driven by a desire for better inventory management and logistics optimization. However, the pandemic significantly accelerated this evolution, exposing vulnerabilities in traditional supply chains and highlighting the indispensable role of SCCT. Market growth trajectories have been consistently upward, with compound annual growth rates (CAGRs) in the high teens to low twenties. Technological advancements, including the integration of IoT sensors for granular tracking of goods and assets, machine learning algorithms for demand forecasting and anomaly detection, and cloud computing for scalability and accessibility, have been pivotal. Shifting consumer demands for faster delivery, greater product customization, and ethical sourcing have further compelled businesses to adopt more intelligent and responsive supply chain management solutions. The estimated market size in 2025 is projected to be in the range of $30 billion, with a robust forecast for continued growth. Adoption metrics show a substantial increase in the percentage of enterprises implementing SCCT solutions, with large enterprises leading the charge, followed closely by SMEs eager to leverage advanced capabilities without significant upfront IT investment. The industry's trajectory is firmly set towards end-to-end integration, enabling a holistic view and proactive management of the entire supply chain ecosystem, from raw material sourcing to final customer delivery. This continuous evolution is fueled by a cycle of innovation, competitive pressure, and the increasing recognition of SCCT as a strategic imperative for business continuity and competitive advantage.
Leading Regions, Countries, or Segments in Cloud-based Supply Chain Control Tower
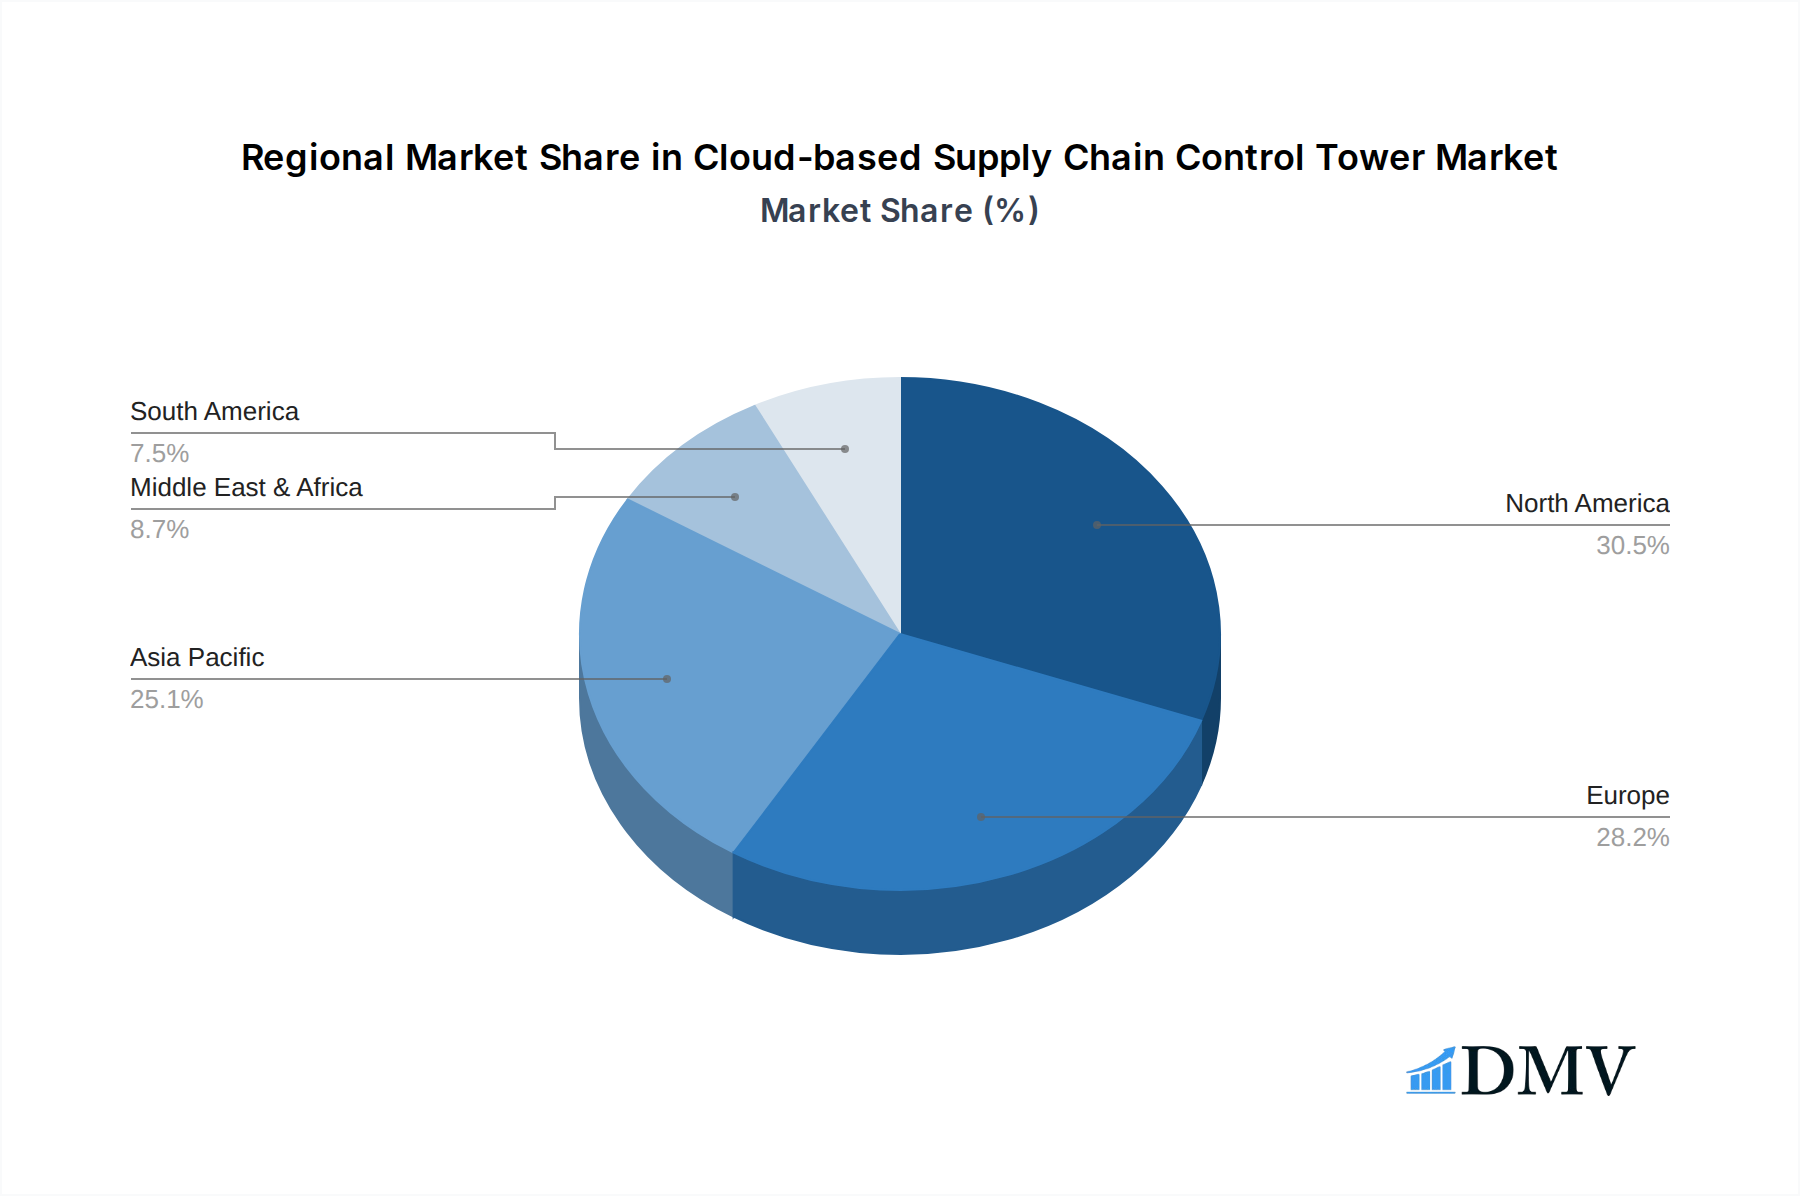
North America currently stands as the dominant region in the cloud-based supply chain control tower market, driven by a confluence of advanced technological infrastructure, a high concentration of large enterprises with complex supply chains, and proactive government initiatives promoting digital transformation. The United States, in particular, is a powerhouse, with a significant number of multinational corporations investing heavily in SCCT solutions to optimize their global operations. The Application segment of Large Enterprises is the primary driver of this dominance, as these organizations possess the scale and complexity that necessitate the robust capabilities offered by SCCT platforms.
- Dominant Region: North America (particularly the United States) exhibits the highest market penetration and investment in cloud-based SCCT.
- Key Drivers in North America:
- Technological Innovation Hub: Proximity to leading technology providers like AWS, Microsoft, and IBM fosters rapid adoption of cutting-edge SCCT solutions.
- Enterprise Adoption: A large base of Fortune 500 companies with intricate global supply chains actively seeks integrated visibility and control.
- Investment Trends: Significant venture capital and corporate investment in supply chain technology startups and established SCCT vendors.
- Regulatory Support: Government incentives and policies encouraging digital transformation and supply chain resilience.
- Dominant Segment (Application): Large Enterprises are the primary adopters, accounting for over 70% of the market share in 2025. Their need for end-to-end visibility, risk management, and optimization of vast, complex networks makes SCCT indispensable.
- Dominant Segment (Type): While all segments are growing, Logistics and Transportation, and Fulfillment are currently the most mature and widely implemented types of SCCT functionalities, representing a combined market share of approximately 55% in 2025. This is due to the immediate and tangible benefits of real-time tracking, route optimization, and delivery performance management.
- Emerging Segments: Supply Assurance and End-to-end SCCT are experiencing rapid growth as companies increasingly focus on end-to-end resilience and complete supply chain orchestration. The market for these segments is projected to grow at over 25% CAGR during the forecast period.
- Industry Developments Impact: The widespread adoption of e-commerce and the resulting pressure on last-mile delivery have further cemented the importance of advanced Logistics and Transportation SCCT capabilities, driving investment and innovation in this area.
Cloud-based Supply Chain Control Tower Product Innovations
Recent product innovations in the cloud-based supply chain control tower market are centered on enhancing predictive capabilities, automating decision-making, and improving user experience. Advanced AI and machine learning algorithms are now enabling SCCT solutions to not only detect anomalies but also to proactively predict disruptions like port congestion or material shortages, offering actionable recommendations for mitigation. Real-time "what-if" scenario planning and digital twin technology are becoming standard features, allowing businesses to simulate the impact of potential events and optimize responses. Integration with emerging technologies like the Industrial Internet of Things (IIoT) provides granular, real-time data from the shop floor to the delivery truck, enabling unprecedented visibility. Unique selling propositions often highlight seamless integration with existing ERP and WMS systems, user-friendly dashboards with customizable analytics, and robust cybersecurity features to protect sensitive supply chain data.
Propelling Factors for Cloud-based Supply Chain Control Tower Growth
The growth of the cloud-based supply chain control tower market is propelled by several critical factors. The increasing complexity and globalization of supply chains necessitate advanced visibility and control, which SCCT solutions uniquely provide. Economic pressures and the drive for operational efficiency are pushing companies to reduce costs through optimized inventory management and logistics. Furthermore, the growing demand for supply chain resilience, amplified by recent global disruptions, makes SCCT a strategic imperative for business continuity. Technological advancements in AI, IoT, and cloud computing are making these solutions more powerful, accessible, and cost-effective, driving adoption across all enterprise sizes.
- Globalization & Complexity: Managing intricate international networks requires a unified, real-time view.
- Cost Optimization: Reducing inventory holding costs, minimizing transportation expenses, and improving resource allocation.
- Supply Chain Resilience: Mitigating risks from disruptions through early detection and proactive responses.
- Technological Advancements: AI-driven analytics, IoT integration, and scalable cloud infrastructure.
Obstacles in the Cloud-based Supply Chain Control Tower Market
Despite robust growth, the cloud-based supply chain control tower market faces several significant obstacles. The integration of disparate legacy systems and the complexity of data harmonization from various sources remain a substantial technical challenge, potentially delaying implementation and increasing costs. Data security and privacy concerns, particularly with sensitive supply chain information being stored in the cloud, can be a deterrent for some organizations. The significant initial investment required for comprehensive SCCT solutions, even with cloud-based models, can be a barrier for smaller enterprises. Furthermore, the scarcity of skilled professionals with expertise in supply chain analytics and SCCT implementation poses a constraint on widespread adoption and effective utilization of these advanced platforms.
- Data Integration Challenges: Harmonizing data from diverse legacy systems.
- Cybersecurity & Data Privacy: Ensuring the security of sensitive supply chain information in the cloud.
- Initial Investment Costs: High upfront costs for comprehensive SCCT deployments can deter some businesses.
- Talent Shortage: Lack of skilled professionals in SCCT implementation and analytics.
Future Opportunities in Cloud-based Supply Chain Control Tower
The future holds immense opportunities for the cloud-based supply chain control tower market. The burgeoning field of sustainability and ESG (Environmental, Social, and Governance) compliance presents a significant avenue for SCCT innovation, enabling companies to track and report on their carbon footprint, ethical sourcing, and labor practices across their supply chains. The further integration of AI and machine learning will lead to highly autonomous supply chains, capable of self-optimizing and self-healing. The expansion into emerging markets with rapidly developing supply chains offers substantial growth potential. Moreover, the increasing demand for hyper-personalized customer experiences will drive SCCT solutions to offer even greater agility and responsiveness in meeting individual consumer needs.
- Sustainability & ESG Tracking: Demand for solutions to monitor and report on environmental and ethical practices.
- Autonomous Supply Chains: Advancements in AI for self-optimizing and self-healing supply chain operations.
- Emerging Market Expansion: Tapping into new geographic regions with developing supply chain infrastructures.
- Hyper-personalization: Enabling SCCT to support highly customized product delivery and customer experiences.
Major Players in the Cloud-based Supply Chain Control Tower Ecosystem
- SAP
- AWS Solutions
- IBM
- Accenture
- Blue Yonder
- E2open
- LLamasoft
- Quantum
- Cloudlink
- One Network
- Agility Insights
- Elementum
- Infor
- Kinaxis
- Viewlocity Technologies
- o9 Solutions
- GEP
Key Developments in Cloud-based Supply Chain Control Tower Industry
- 2023/Q4: SAP launches enhanced AI capabilities for its Supply Chain Control Tower, focusing on predictive risk management and automated decision support.
- 2024/Q1: AWS Solutions announces deeper integration of its IoT services with SCCT platforms, enabling real-time asset tracking and condition monitoring.
- 2024/Q2: Blue Yonder acquires a specialized AI company to bolster its machine learning capabilities for demand forecasting and inventory optimization within its SCCT suite.
- 2024/Q3: IBM introduces blockchain-based solutions for enhanced supply chain transparency and traceability, integrating with its existing SCCT offerings.
- 2024/Q4: Accenture partners with several major cloud providers to offer end-to-end SCCT implementation and managed services, focusing on large enterprise clients.
- 2025/Q1: E2open expands its global network visibility by integrating with new logistics partners and real-time transportation data providers.
- 2025/Q2: Kinaxis introduces advanced sustainability tracking features into its SCCT platform, addressing growing ESG compliance demands.
Strategic Cloud-based Supply Chain Control Tower Market Forecast
The strategic cloud-based supply chain control tower market is poised for remarkable growth, driven by increasing demand for agility, resilience, and end-to-end visibility. Future opportunities in sustainability, autonomous operations, and emerging markets will be key growth catalysts. The continued advancements in AI and IoT will enable SCCT platforms to offer even more sophisticated predictive analytics and proactive risk mitigation capabilities. The forecast indicates sustained double-digit growth, with significant potential for market expansion as more SMEs adopt these transformative solutions. Businesses that strategically invest in and leverage cloud-based SCCT will be best positioned to navigate future supply chain complexities and gain a sustainable competitive advantage.
Cloud-based Supply Chain Control Tower Segmentation
-
1. Application
- 1.1. SMEs
- 1.2. Large Enterprises
-
2. Types
- 2.1. Logistics and Transportation
- 2.2. Fulfillment
- 2.3. Inventory Control
- 2.4. Supply Assurance
- 2.5. End-to-end SCCT
- 2.6. Others
Cloud-based Supply Chain Control Tower Segmentation By Geography
-
1. North America
- 1.1. United States
- 1.2. Canada
- 1.3. Mexico
-
2. South America
- 2.1. Brazil
- 2.2. Argentina
- 2.3. Rest of South America
-
3. Europe
- 3.1. United Kingdom
- 3.2. Germany
- 3.3. France
- 3.4. Italy
- 3.5. Spain
- 3.6. Russia
- 3.7. Benelux
- 3.8. Nordics
- 3.9. Rest of Europe
-
4. Middle East & Africa
- 4.1. Turkey
- 4.2. Israel
- 4.3. GCC
- 4.4. North Africa
- 4.5. South Africa
- 4.6. Rest of Middle East & Africa
-
5. Asia Pacific
- 5.1. China
- 5.2. India
- 5.3. Japan
- 5.4. South Korea
- 5.5. ASEAN
- 5.6. Oceania
- 5.7. Rest of Asia Pacific
Cloud-based Supply Chain Control Tower Regional Market Share
Geographic Coverage of Cloud-based Supply Chain Control Tower
Cloud-based Supply Chain Control Tower REPORT HIGHLIGHTS
| Aspects | Details |
|---|---|
| Study Period | 2020-2034 |
| Base Year | 2025 |
| Estimated Year | 2026 |
| Forecast Period | 2026-2034 |
| Historical Period | 2020-2025 |
| Growth Rate | CAGR of 17.5% from 2020-2034 |
| Segmentation |
|
Table of Contents
- 1. Introduction
- 1.1. Research Scope
- 1.2. Market Segmentation
- 1.3. Research Methodology
- 1.4. Definitions and Assumptions
- 2. Executive Summary
- 2.1. Introduction
- 3. Market Dynamics
- 3.1. Introduction
- 3.2. Market Drivers
- 3.3. Market Restrains
- 3.4. Market Trends
- 4. Market Factor Analysis
- 4.1. Porters Five Forces
- 4.2. Supply/Value Chain
- 4.3. PESTEL analysis
- 4.4. Market Entropy
- 4.5. Patent/Trademark Analysis
- 5. Global Cloud-based Supply Chain Control Tower Analysis, Insights and Forecast, 2020-2032
- 5.1. Market Analysis, Insights and Forecast - by Application
- 5.1.1. SMEs
- 5.1.2. Large Enterprises
- 5.2. Market Analysis, Insights and Forecast - by Types
- 5.2.1. Logistics and Transportation
- 5.2.2. Fulfillment
- 5.2.3. Inventory Control
- 5.2.4. Supply Assurance
- 5.2.5. End-to-end SCCT
- 5.2.6. Others
- 5.3. Market Analysis, Insights and Forecast - by Region
- 5.3.1. North America
- 5.3.2. South America
- 5.3.3. Europe
- 5.3.4. Middle East & Africa
- 5.3.5. Asia Pacific
- 5.1. Market Analysis, Insights and Forecast - by Application
- 6. North America Cloud-based Supply Chain Control Tower Analysis, Insights and Forecast, 2020-2032
- 6.1. Market Analysis, Insights and Forecast - by Application
- 6.1.1. SMEs
- 6.1.2. Large Enterprises
- 6.2. Market Analysis, Insights and Forecast - by Types
- 6.2.1. Logistics and Transportation
- 6.2.2. Fulfillment
- 6.2.3. Inventory Control
- 6.2.4. Supply Assurance
- 6.2.5. End-to-end SCCT
- 6.2.6. Others
- 6.1. Market Analysis, Insights and Forecast - by Application
- 7. South America Cloud-based Supply Chain Control Tower Analysis, Insights and Forecast, 2020-2032
- 7.1. Market Analysis, Insights and Forecast - by Application
- 7.1.1. SMEs
- 7.1.2. Large Enterprises
- 7.2. Market Analysis, Insights and Forecast - by Types
- 7.2.1. Logistics and Transportation
- 7.2.2. Fulfillment
- 7.2.3. Inventory Control
- 7.2.4. Supply Assurance
- 7.2.5. End-to-end SCCT
- 7.2.6. Others
- 7.1. Market Analysis, Insights and Forecast - by Application
- 8. Europe Cloud-based Supply Chain Control Tower Analysis, Insights and Forecast, 2020-2032
- 8.1. Market Analysis, Insights and Forecast - by Application
- 8.1.1. SMEs
- 8.1.2. Large Enterprises
- 8.2. Market Analysis, Insights and Forecast - by Types
- 8.2.1. Logistics and Transportation
- 8.2.2. Fulfillment
- 8.2.3. Inventory Control
- 8.2.4. Supply Assurance
- 8.2.5. End-to-end SCCT
- 8.2.6. Others
- 8.1. Market Analysis, Insights and Forecast - by Application
- 9. Middle East & Africa Cloud-based Supply Chain Control Tower Analysis, Insights and Forecast, 2020-2032
- 9.1. Market Analysis, Insights and Forecast - by Application
- 9.1.1. SMEs
- 9.1.2. Large Enterprises
- 9.2. Market Analysis, Insights and Forecast - by Types
- 9.2.1. Logistics and Transportation
- 9.2.2. Fulfillment
- 9.2.3. Inventory Control
- 9.2.4. Supply Assurance
- 9.2.5. End-to-end SCCT
- 9.2.6. Others
- 9.1. Market Analysis, Insights and Forecast - by Application
- 10. Asia Pacific Cloud-based Supply Chain Control Tower Analysis, Insights and Forecast, 2020-2032
- 10.1. Market Analysis, Insights and Forecast - by Application
- 10.1.1. SMEs
- 10.1.2. Large Enterprises
- 10.2. Market Analysis, Insights and Forecast - by Types
- 10.2.1. Logistics and Transportation
- 10.2.2. Fulfillment
- 10.2.3. Inventory Control
- 10.2.4. Supply Assurance
- 10.2.5. End-to-end SCCT
- 10.2.6. Others
- 10.1. Market Analysis, Insights and Forecast - by Application
- 11. Competitive Analysis
- 11.1. Global Market Share Analysis 2025
- 11.2. Company Profiles
- 11.2.1 SAP
- 11.2.1.1. Overview
- 11.2.1.2. Products
- 11.2.1.3. SWOT Analysis
- 11.2.1.4. Recent Developments
- 11.2.1.5. Financials (Based on Availability)
- 11.2.2 AWS Solutions
- 11.2.2.1. Overview
- 11.2.2.2. Products
- 11.2.2.3. SWOT Analysis
- 11.2.2.4. Recent Developments
- 11.2.2.5. Financials (Based on Availability)
- 11.2.3 IBM
- 11.2.3.1. Overview
- 11.2.3.2. Products
- 11.2.3.3. SWOT Analysis
- 11.2.3.4. Recent Developments
- 11.2.3.5. Financials (Based on Availability)
- 11.2.4 Accenture
- 11.2.4.1. Overview
- 11.2.4.2. Products
- 11.2.4.3. SWOT Analysis
- 11.2.4.4. Recent Developments
- 11.2.4.5. Financials (Based on Availability)
- 11.2.5 Blue Yonder
- 11.2.5.1. Overview
- 11.2.5.2. Products
- 11.2.5.3. SWOT Analysis
- 11.2.5.4. Recent Developments
- 11.2.5.5. Financials (Based on Availability)
- 11.2.6 E2open
- 11.2.6.1. Overview
- 11.2.6.2. Products
- 11.2.6.3. SWOT Analysis
- 11.2.6.4. Recent Developments
- 11.2.6.5. Financials (Based on Availability)
- 11.2.7 LLamasoft
- 11.2.7.1. Overview
- 11.2.7.2. Products
- 11.2.7.3. SWOT Analysis
- 11.2.7.4. Recent Developments
- 11.2.7.5. Financials (Based on Availability)
- 11.2.8 Quantum
- 11.2.8.1. Overview
- 11.2.8.2. Products
- 11.2.8.3. SWOT Analysis
- 11.2.8.4. Recent Developments
- 11.2.8.5. Financials (Based on Availability)
- 11.2.9 Cloudlink
- 11.2.9.1. Overview
- 11.2.9.2. Products
- 11.2.9.3. SWOT Analysis
- 11.2.9.4. Recent Developments
- 11.2.9.5. Financials (Based on Availability)
- 11.2.10 One Network
- 11.2.10.1. Overview
- 11.2.10.2. Products
- 11.2.10.3. SWOT Analysis
- 11.2.10.4. Recent Developments
- 11.2.10.5. Financials (Based on Availability)
- 11.2.11 Agility Insights
- 11.2.11.1. Overview
- 11.2.11.2. Products
- 11.2.11.3. SWOT Analysis
- 11.2.11.4. Recent Developments
- 11.2.11.5. Financials (Based on Availability)
- 11.2.12 Elementum
- 11.2.12.1. Overview
- 11.2.12.2. Products
- 11.2.12.3. SWOT Analysis
- 11.2.12.4. Recent Developments
- 11.2.12.5. Financials (Based on Availability)
- 11.2.13 Infor
- 11.2.13.1. Overview
- 11.2.13.2. Products
- 11.2.13.3. SWOT Analysis
- 11.2.13.4. Recent Developments
- 11.2.13.5. Financials (Based on Availability)
- 11.2.14 Kinaxis
- 11.2.14.1. Overview
- 11.2.14.2. Products
- 11.2.14.3. SWOT Analysis
- 11.2.14.4. Recent Developments
- 11.2.14.5. Financials (Based on Availability)
- 11.2.15 Viewlocity Technologies
- 11.2.15.1. Overview
- 11.2.15.2. Products
- 11.2.15.3. SWOT Analysis
- 11.2.15.4. Recent Developments
- 11.2.15.5. Financials (Based on Availability)
- 11.2.16 o9 Solutions
- 11.2.16.1. Overview
- 11.2.16.2. Products
- 11.2.16.3. SWOT Analysis
- 11.2.16.4. Recent Developments
- 11.2.16.5. Financials (Based on Availability)
- 11.2.17 GEP
- 11.2.17.1. Overview
- 11.2.17.2. Products
- 11.2.17.3. SWOT Analysis
- 11.2.17.4. Recent Developments
- 11.2.17.5. Financials (Based on Availability)
- 11.2.1 SAP
List of Figures
- Figure 1: Global Cloud-based Supply Chain Control Tower Revenue Breakdown (undefined, %) by Region 2025 & 2033
- Figure 2: North America Cloud-based Supply Chain Control Tower Revenue (undefined), by Application 2025 & 2033
- Figure 3: North America Cloud-based Supply Chain Control Tower Revenue Share (%), by Application 2025 & 2033
- Figure 4: North America Cloud-based Supply Chain Control Tower Revenue (undefined), by Types 2025 & 2033
- Figure 5: North America Cloud-based Supply Chain Control Tower Revenue Share (%), by Types 2025 & 2033
- Figure 6: North America Cloud-based Supply Chain Control Tower Revenue (undefined), by Country 2025 & 2033
- Figure 7: North America Cloud-based Supply Chain Control Tower Revenue Share (%), by Country 2025 & 2033
- Figure 8: South America Cloud-based Supply Chain Control Tower Revenue (undefined), by Application 2025 & 2033
- Figure 9: South America Cloud-based Supply Chain Control Tower Revenue Share (%), by Application 2025 & 2033
- Figure 10: South America Cloud-based Supply Chain Control Tower Revenue (undefined), by Types 2025 & 2033
- Figure 11: South America Cloud-based Supply Chain Control Tower Revenue Share (%), by Types 2025 & 2033
- Figure 12: South America Cloud-based Supply Chain Control Tower Revenue (undefined), by Country 2025 & 2033
- Figure 13: South America Cloud-based Supply Chain Control Tower Revenue Share (%), by Country 2025 & 2033
- Figure 14: Europe Cloud-based Supply Chain Control Tower Revenue (undefined), by Application 2025 & 2033
- Figure 15: Europe Cloud-based Supply Chain Control Tower Revenue Share (%), by Application 2025 & 2033
- Figure 16: Europe Cloud-based Supply Chain Control Tower Revenue (undefined), by Types 2025 & 2033
- Figure 17: Europe Cloud-based Supply Chain Control Tower Revenue Share (%), by Types 2025 & 2033
- Figure 18: Europe Cloud-based Supply Chain Control Tower Revenue (undefined), by Country 2025 & 2033
- Figure 19: Europe Cloud-based Supply Chain Control Tower Revenue Share (%), by Country 2025 & 2033
- Figure 20: Middle East & Africa Cloud-based Supply Chain Control Tower Revenue (undefined), by Application 2025 & 2033
- Figure 21: Middle East & Africa Cloud-based Supply Chain Control Tower Revenue Share (%), by Application 2025 & 2033
- Figure 22: Middle East & Africa Cloud-based Supply Chain Control Tower Revenue (undefined), by Types 2025 & 2033
- Figure 23: Middle East & Africa Cloud-based Supply Chain Control Tower Revenue Share (%), by Types 2025 & 2033
- Figure 24: Middle East & Africa Cloud-based Supply Chain Control Tower Revenue (undefined), by Country 2025 & 2033
- Figure 25: Middle East & Africa Cloud-based Supply Chain Control Tower Revenue Share (%), by Country 2025 & 2033
- Figure 26: Asia Pacific Cloud-based Supply Chain Control Tower Revenue (undefined), by Application 2025 & 2033
- Figure 27: Asia Pacific Cloud-based Supply Chain Control Tower Revenue Share (%), by Application 2025 & 2033
- Figure 28: Asia Pacific Cloud-based Supply Chain Control Tower Revenue (undefined), by Types 2025 & 2033
- Figure 29: Asia Pacific Cloud-based Supply Chain Control Tower Revenue Share (%), by Types 2025 & 2033
- Figure 30: Asia Pacific Cloud-based Supply Chain Control Tower Revenue (undefined), by Country 2025 & 2033
- Figure 31: Asia Pacific Cloud-based Supply Chain Control Tower Revenue Share (%), by Country 2025 & 2033
List of Tables
- Table 1: Global Cloud-based Supply Chain Control Tower Revenue undefined Forecast, by Application 2020 & 2033
- Table 2: Global Cloud-based Supply Chain Control Tower Revenue undefined Forecast, by Types 2020 & 2033
- Table 3: Global Cloud-based Supply Chain Control Tower Revenue undefined Forecast, by Region 2020 & 2033
- Table 4: Global Cloud-based Supply Chain Control Tower Revenue undefined Forecast, by Application 2020 & 2033
- Table 5: Global Cloud-based Supply Chain Control Tower Revenue undefined Forecast, by Types 2020 & 2033
- Table 6: Global Cloud-based Supply Chain Control Tower Revenue undefined Forecast, by Country 2020 & 2033
- Table 7: United States Cloud-based Supply Chain Control Tower Revenue (undefined) Forecast, by Application 2020 & 2033
- Table 8: Canada Cloud-based Supply Chain Control Tower Revenue (undefined) Forecast, by Application 2020 & 2033
- Table 9: Mexico Cloud-based Supply Chain Control Tower Revenue (undefined) Forecast, by Application 2020 & 2033
- Table 10: Global Cloud-based Supply Chain Control Tower Revenue undefined Forecast, by Application 2020 & 2033
- Table 11: Global Cloud-based Supply Chain Control Tower Revenue undefined Forecast, by Types 2020 & 2033
- Table 12: Global Cloud-based Supply Chain Control Tower Revenue undefined Forecast, by Country 2020 & 2033
- Table 13: Brazil Cloud-based Supply Chain Control Tower Revenue (undefined) Forecast, by Application 2020 & 2033
- Table 14: Argentina Cloud-based Supply Chain Control Tower Revenue (undefined) Forecast, by Application 2020 & 2033
- Table 15: Rest of South America Cloud-based Supply Chain Control Tower Revenue (undefined) Forecast, by Application 2020 & 2033
- Table 16: Global Cloud-based Supply Chain Control Tower Revenue undefined Forecast, by Application 2020 & 2033
- Table 17: Global Cloud-based Supply Chain Control Tower Revenue undefined Forecast, by Types 2020 & 2033
- Table 18: Global Cloud-based Supply Chain Control Tower Revenue undefined Forecast, by Country 2020 & 2033
- Table 19: United Kingdom Cloud-based Supply Chain Control Tower Revenue (undefined) Forecast, by Application 2020 & 2033
- Table 20: Germany Cloud-based Supply Chain Control Tower Revenue (undefined) Forecast, by Application 2020 & 2033
- Table 21: France Cloud-based Supply Chain Control Tower Revenue (undefined) Forecast, by Application 2020 & 2033
- Table 22: Italy Cloud-based Supply Chain Control Tower Revenue (undefined) Forecast, by Application 2020 & 2033
- Table 23: Spain Cloud-based Supply Chain Control Tower Revenue (undefined) Forecast, by Application 2020 & 2033
- Table 24: Russia Cloud-based Supply Chain Control Tower Revenue (undefined) Forecast, by Application 2020 & 2033
- Table 25: Benelux Cloud-based Supply Chain Control Tower Revenue (undefined) Forecast, by Application 2020 & 2033
- Table 26: Nordics Cloud-based Supply Chain Control Tower Revenue (undefined) Forecast, by Application 2020 & 2033
- Table 27: Rest of Europe Cloud-based Supply Chain Control Tower Revenue (undefined) Forecast, by Application 2020 & 2033
- Table 28: Global Cloud-based Supply Chain Control Tower Revenue undefined Forecast, by Application 2020 & 2033
- Table 29: Global Cloud-based Supply Chain Control Tower Revenue undefined Forecast, by Types 2020 & 2033
- Table 30: Global Cloud-based Supply Chain Control Tower Revenue undefined Forecast, by Country 2020 & 2033
- Table 31: Turkey Cloud-based Supply Chain Control Tower Revenue (undefined) Forecast, by Application 2020 & 2033
- Table 32: Israel Cloud-based Supply Chain Control Tower Revenue (undefined) Forecast, by Application 2020 & 2033
- Table 33: GCC Cloud-based Supply Chain Control Tower Revenue (undefined) Forecast, by Application 2020 & 2033
- Table 34: North Africa Cloud-based Supply Chain Control Tower Revenue (undefined) Forecast, by Application 2020 & 2033
- Table 35: South Africa Cloud-based Supply Chain Control Tower Revenue (undefined) Forecast, by Application 2020 & 2033
- Table 36: Rest of Middle East & Africa Cloud-based Supply Chain Control Tower Revenue (undefined) Forecast, by Application 2020 & 2033
- Table 37: Global Cloud-based Supply Chain Control Tower Revenue undefined Forecast, by Application 2020 & 2033
- Table 38: Global Cloud-based Supply Chain Control Tower Revenue undefined Forecast, by Types 2020 & 2033
- Table 39: Global Cloud-based Supply Chain Control Tower Revenue undefined Forecast, by Country 2020 & 2033
- Table 40: China Cloud-based Supply Chain Control Tower Revenue (undefined) Forecast, by Application 2020 & 2033
- Table 41: India Cloud-based Supply Chain Control Tower Revenue (undefined) Forecast, by Application 2020 & 2033
- Table 42: Japan Cloud-based Supply Chain Control Tower Revenue (undefined) Forecast, by Application 2020 & 2033
- Table 43: South Korea Cloud-based Supply Chain Control Tower Revenue (undefined) Forecast, by Application 2020 & 2033
- Table 44: ASEAN Cloud-based Supply Chain Control Tower Revenue (undefined) Forecast, by Application 2020 & 2033
- Table 45: Oceania Cloud-based Supply Chain Control Tower Revenue (undefined) Forecast, by Application 2020 & 2033
- Table 46: Rest of Asia Pacific Cloud-based Supply Chain Control Tower Revenue (undefined) Forecast, by Application 2020 & 2033
Frequently Asked Questions
1. What is the projected Compound Annual Growth Rate (CAGR) of the Cloud-based Supply Chain Control Tower?
The projected CAGR is approximately 17.5%.
2. Which companies are prominent players in the Cloud-based Supply Chain Control Tower?
Key companies in the market include SAP, AWS Solutions, IBM, Accenture, Blue Yonder, E2open, LLamasoft, Quantum, Cloudlink, One Network, Agility Insights, Elementum, Infor, Kinaxis, Viewlocity Technologies, o9 Solutions, GEP.
3. What are the main segments of the Cloud-based Supply Chain Control Tower?
The market segments include Application, Types.
4. Can you provide details about the market size?
The market size is estimated to be USD XXX N/A as of 2022.
5. What are some drivers contributing to market growth?
N/A
6. What are the notable trends driving market growth?
N/A
7. Are there any restraints impacting market growth?
N/A
8. Can you provide examples of recent developments in the market?
N/A
9. What pricing options are available for accessing the report?
Pricing options include single-user, multi-user, and enterprise licenses priced at USD 4900.00, USD 7350.00, and USD 9800.00 respectively.
10. Is the market size provided in terms of value or volume?
The market size is provided in terms of value, measured in N/A.
11. Are there any specific market keywords associated with the report?
Yes, the market keyword associated with the report is "Cloud-based Supply Chain Control Tower," which aids in identifying and referencing the specific market segment covered.
12. How do I determine which pricing option suits my needs best?
The pricing options vary based on user requirements and access needs. Individual users may opt for single-user licenses, while businesses requiring broader access may choose multi-user or enterprise licenses for cost-effective access to the report.
13. Are there any additional resources or data provided in the Cloud-based Supply Chain Control Tower report?
While the report offers comprehensive insights, it's advisable to review the specific contents or supplementary materials provided to ascertain if additional resources or data are available.
14. How can I stay updated on further developments or reports in the Cloud-based Supply Chain Control Tower?
To stay informed about further developments, trends, and reports in the Cloud-based Supply Chain Control Tower, consider subscribing to industry newsletters, following relevant companies and organizations, or regularly checking reputable industry news sources and publications.
Methodology
Step 1 - Identification of Relevant Samples Size from Population Database


Step 2 - Approaches for Defining Global Market Size (Value, Volume* & Price*)

Note*: In applicable scenarios
Step 3 - Data Sources
Primary Research
- Web Analytics
- Survey Reports
- Research Institute
- Latest Research Reports
- Opinion Leaders
Secondary Research
- Annual Reports
- White Paper
- Latest Press Release
- Industry Association
- Paid Database
- Investor Presentations

Step 4 - Data Triangulation
Involves using different sources of information in order to increase the validity of a study
These sources are likely to be stakeholders in a program - participants, other researchers, program staff, other community members, and so on.
Then we put all data in single framework & apply various statistical tools to find out the dynamic on the market.
During the analysis stage, feedback from the stakeholder groups would be compared to determine areas of agreement as well as areas of divergence