

Key Insights
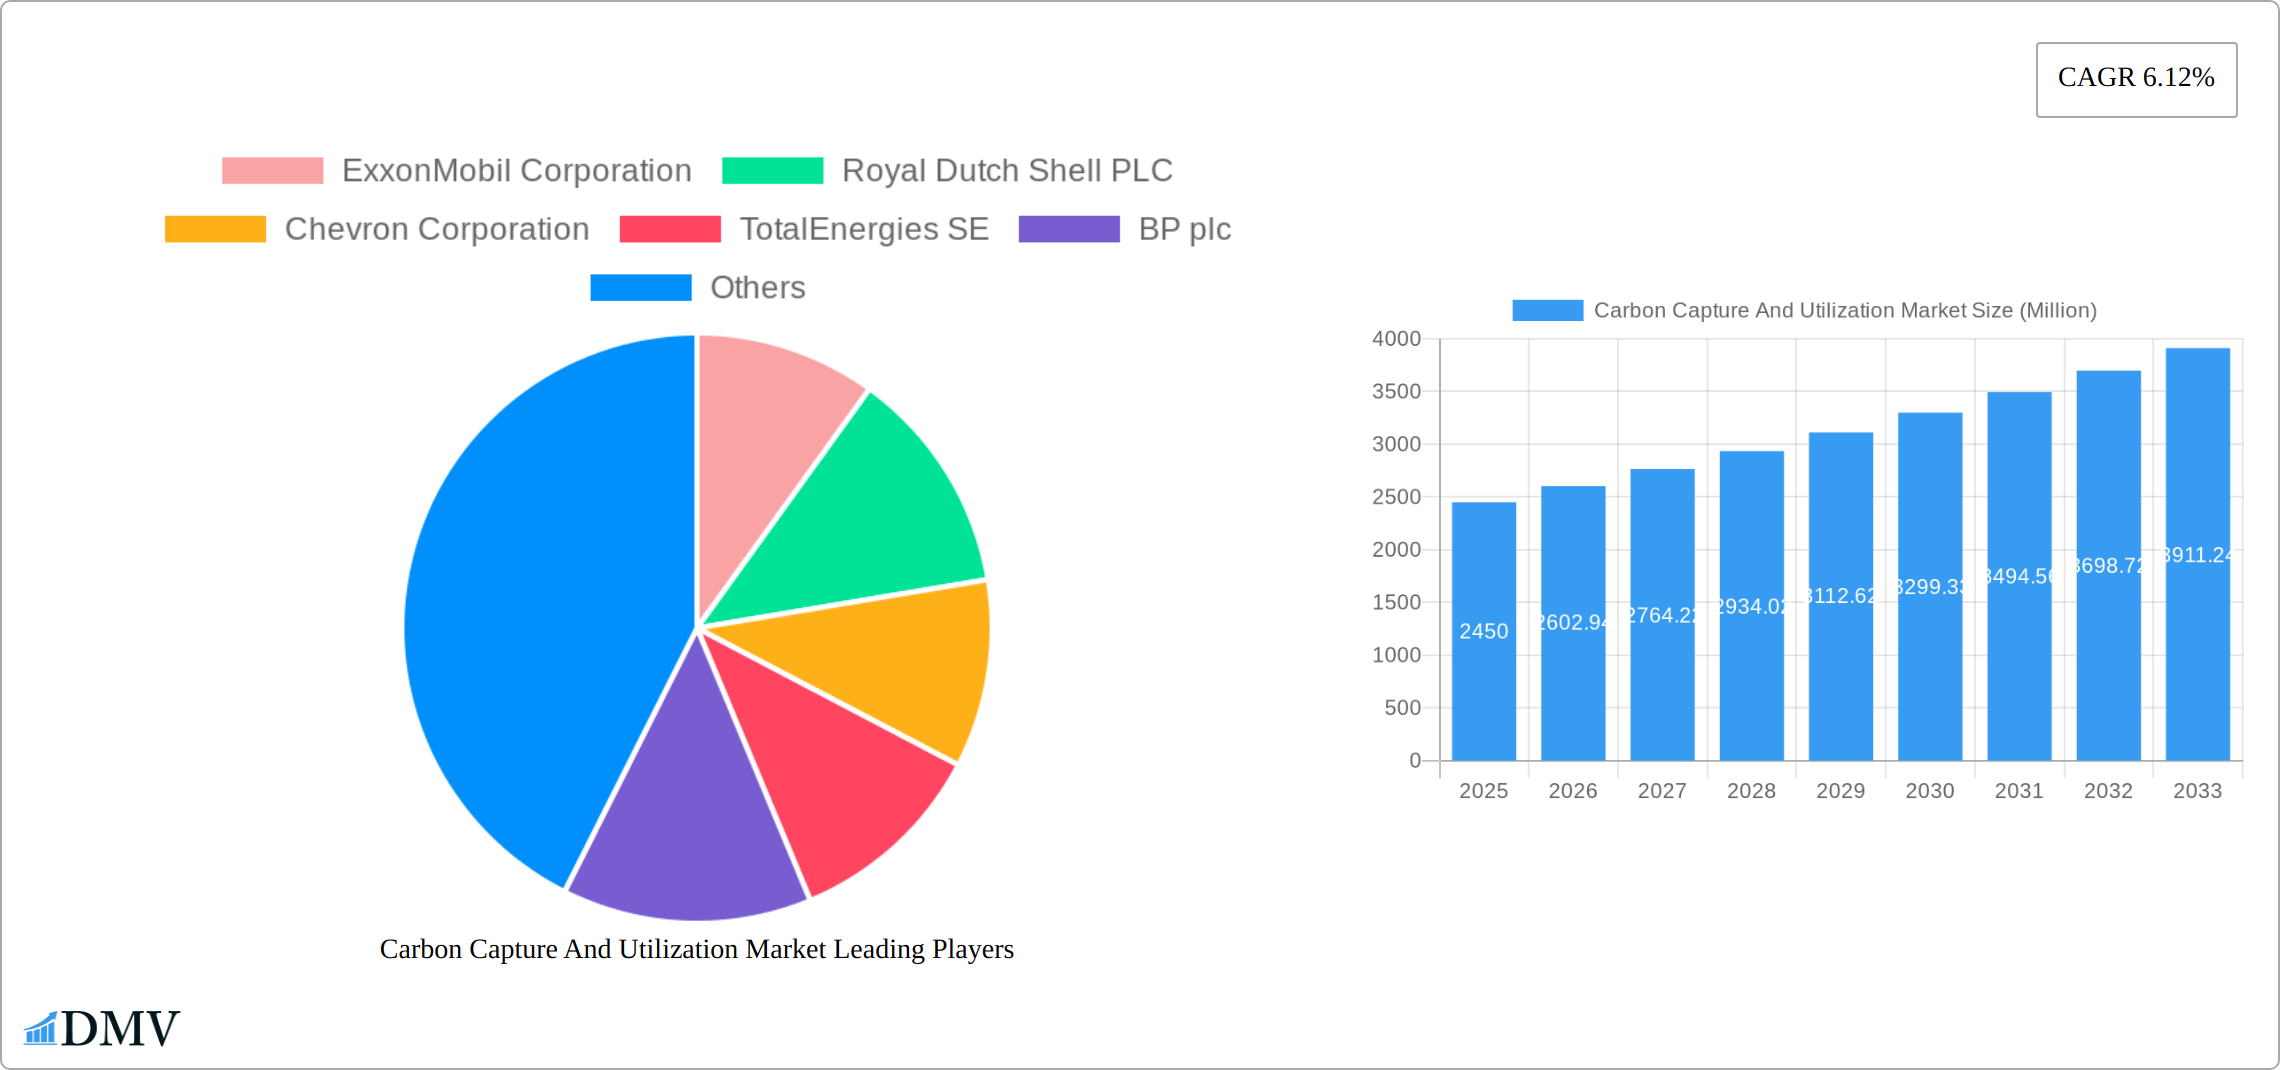
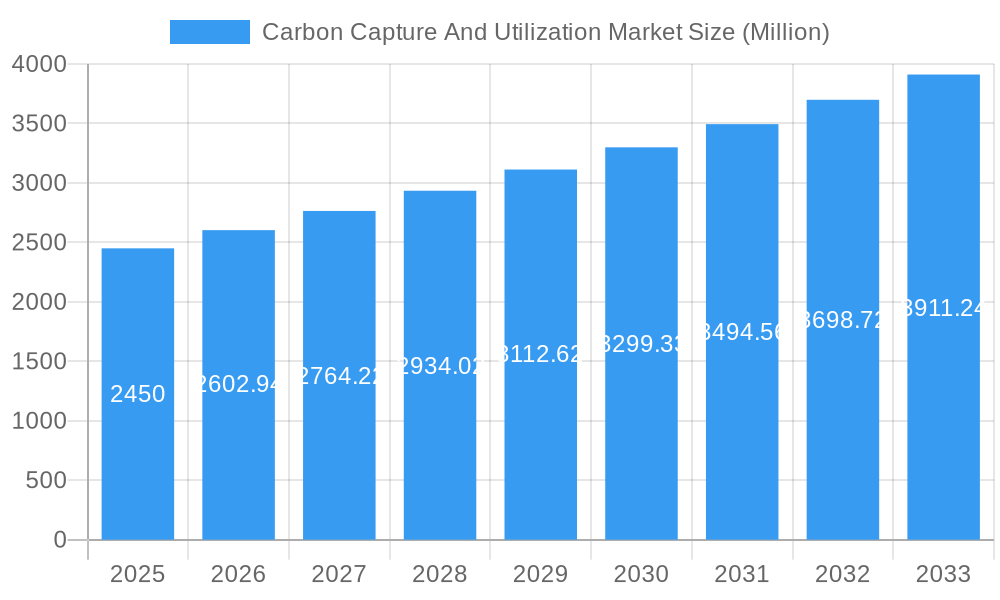
The Carbon Capture and Utilization (CCU) market is experiencing robust growth, projected to reach \$2.45 billion in 2025 and expand significantly over the forecast period (2025-2033). A compound annual growth rate (CAGR) of 6.12% indicates a steady increase in market value, driven by escalating concerns about climate change and the urgent need to reduce greenhouse gas emissions. Government regulations promoting carbon neutrality and substantial investments in renewable energy infrastructure are key catalysts. Technological advancements, leading to more efficient and cost-effective CCU technologies, further contribute to market expansion. The increasing adoption of CCU in various industries, including power generation, cement manufacturing, and industrial processes, fuels market growth. While initial capital investments can be significant, decreasing operational costs and the potential for revenue generation through the utilization of captured carbon as a valuable resource are mitigating factors. Major players like ExxonMobil, Shell, and Chevron are actively investing in research and development, as well as acquiring smaller CCU companies, underscoring the sector's potential.
Carbon Capture And Utilization Market Market Size (In Billion)
The market segmentation is likely diverse, encompassing various capture technologies (e.g., post-combustion, pre-combustion, oxy-fuel), utilization methods (e.g., enhanced oil recovery, production of chemicals and materials), and applications across different industries. Geographic distribution is expected to be skewed towards regions with strong governmental support for climate initiatives and established industrial bases. North America and Europe are currently likely leading markets, with Asia-Pacific poised for significant growth due to rapid industrialization and increasing environmental regulations. Challenges remain, including the high costs associated with deploying CCU technologies at scale and the need for further development of efficient and commercially viable utilization pathways. However, continuous innovation and policy support are anticipated to overcome these hurdles, ensuring the continued expansion of the CCU market in the coming years.
Carbon Capture And Utilization Market Company Market Share
Carbon Capture and Utilization (CCU) Market Report: 2019-2033
This comprehensive report provides an in-depth analysis of the Carbon Capture and Utilization (CCU) market, offering invaluable insights for stakeholders seeking to navigate this rapidly evolving landscape. From market sizing and segmentation to technological advancements and future opportunities, this report delivers a complete picture of the CCU industry, covering the period 2019-2033, with a base year of 2025. The report’s findings are based on rigorous research and data analysis, providing actionable intelligence for strategic decision-making. The market is expected to reach xx Million by 2033, showcasing substantial growth potential.
Carbon Capture And Utilization Market Market Composition & Trends
This section analyzes the competitive landscape, innovation drivers, regulatory frameworks, and market dynamics within the CCU market. The market exhibits a moderately concentrated structure, with key players like ExxonMobil Corporation, Royal Dutch Shell PLC, Chevron Corporation, TotalEnergies SE, BP plc, Equinor ASA, Mitsubishi Heavy Industries Ltd, Air Products and Chemicals Inc, Aker Solutions ASA, and Schlumberger Limited vying for market share. The distribution of market share amongst these players is currently estimated at xx%, with ExxonMobil and Shell holding significant positions.
- Market Concentration: Moderate, with several major players dominating.
- Innovation Catalysts: Government incentives, technological breakthroughs in carbon capture technologies, and growing consumer demand for sustainable solutions.
- Regulatory Landscape: Evolving policies globally aimed at reducing carbon emissions are creating favorable conditions for CCU adoption, though regional variations exist.
- Substitute Products: Limited direct substitutes, but competition comes from alternative emissions reduction strategies.
- End-User Profiles: A diverse range including energy producers, industrial manufacturers, and waste management companies.
- M&A Activities: Significant M&A activity observed in recent years, with deal values totaling xx Million in the past five years, primarily driven by companies seeking to expand their CCU capabilities and portfolios. Examples include TotalEnergies’ joint venture with Vanguard Renewables in April 2024.
Carbon Capture And Utilization Market Industry Evolution
The Carbon Capture and Utilization (CCU) market has experienced a period of dynamic expansion from 2019 to 2024, showcasing an average annual growth rate (AAGR) of [Insert Actual AAGR for 2019-2024]%. This upward trajectory is projected to continue with vigor throughout the forecast period of 2025-2033, anticipating an AAGR of [Insert Projected AAGR for 2025-2033]%. This sustained growth is a direct result of a multifaceted interplay of factors. Paramount among these are continuous and groundbreaking technological advancements, leading to enhanced capture efficiencies and the development of a broader spectrum of innovative utilization pathways. Simultaneously, a discernible shift in consumer preferences towards products and services with a reduced environmental footprint is significantly bolstering demand for CCU solutions. Furthermore, the escalating stringency of environmental regulations across diverse industries is compelling organizations to actively adopt and invest in CCU technologies to meet compliance mandates and corporate sustainability goals. The market adoption rate, as evidenced by the increasing installed CCU capacity, has demonstrated a consistent and promising upward trend over recent years, setting the stage for substantial further expansion in the forthcoming forecast period.
Leading Regions, Countries, or Segments in Carbon Capture And Utilization Market
While the global CCU market exhibits robust growth, certain geographical regions and specific market segments are demonstrating accelerated expansion. North America currently spearheads this growth, driven by a confluence of strong governmental backing, significant private sector investment, and a well-developed energy and industrial infrastructure. Europe is also a key player, exhibiting substantial potential fueled by ambitious emission reduction targets and a steadfast commitment to sustainable development initiatives.
- Key Drivers in North America:
- Robust government incentives, tax credits, and subsidies specifically designed to foster CCU project development and deployment.
- Substantial and sustained private sector investment in cutting-edge research and development of novel CCU technologies and applications.
- Abundant availability of industrial resources and a mature, adaptable energy infrastructure that facilitates integration.
- Key Drivers in Europe:
- Stringent and evolving European Union emission reduction targets and comprehensive regulatory frameworks mandating decarbonization efforts.
- A strong and pervasive emphasis on sustainable development principles and the proactive promotion of green initiatives across industries.
- Heightened consumer awareness regarding climate change and a growing demand for products and services that demonstrate environmental responsibility.
The prominent leadership of these regions is attributable to a synergistic combination of enabling regulatory environments, readily accessible financial capital for CCU projects, and advanced technological infrastructure. The Asia-Pacific region is strategically positioned for accelerated growth in the ensuing years, driven by increasing industrialization and proactive governmental initiatives aimed at effectively curbing carbon emissions.
Carbon Capture And Utilization Market Product Innovations
Recent product innovations have focused on enhancing capture efficiency, expanding utilization pathways, and reducing operational costs. New materials and advanced process designs are leading to more efficient and cost-effective carbon capture technologies. Furthermore, innovations are exploring diverse utilization pathways, transforming captured CO2 into valuable products such as fuels, chemicals, and building materials. These innovations are improving the overall performance metrics of CCU systems, leading to higher capture rates and more economically viable applications. Unique selling propositions now include reduced footprint, modularity for flexible deployment, and integrated monitoring systems.
Propelling Factors for Carbon Capture And Utilization Market Growth
Several factors are accelerating the growth of the CCU market. Technological advancements resulting in more efficient and cost-effective capture and utilization methods are key. Stringent government regulations aimed at reducing carbon emissions are creating a favorable regulatory environment. Moreover, the increasing awareness amongst consumers regarding environmental sustainability fuels demand for products and services derived from CCU processes. Economic incentives, including tax credits and subsidies, further bolster the growth trajectory of this market.
Obstacles in the Carbon Capture And Utilization Market Market
Despite significant growth potential, the CCU market faces certain challenges. High upfront capital costs associated with deploying CCU technologies can be a barrier to entry, particularly for smaller companies. Supply chain disruptions can impact the availability of crucial components and materials. Furthermore, the intense competition from alternative emission reduction strategies puts pressure on CCU technologies to continuously improve their cost-effectiveness and efficiency. Regulatory uncertainties across different regions can also hinder investment decisions. The cumulative effect of these obstacles translates to a xx% decrease in projected market growth in specific sectors.
Future Opportunities in Carbon Capture And Utilization Market
The horizon for the CCU market is replete with significant and diverse future opportunities. Emerging markets are rapidly materializing, particularly within sectors dedicated to the development of sustainable materials and the production of green fuels. Advancements in capture technologies, such as direct air capture (DAC), coupled with the innovation of enhanced and novel utilization pathways, hold immense potential for driving substantial future growth. Furthermore, the persistent evolution of consumer preferences towards environmentally conscious products and services is creating substantial and expanding demand for CCU-derived materials and products. The strategic integration of CCU technologies with a broad spectrum of renewable energy sources presents additional synergistic opportunities for accelerated and mutually beneficial growth, paving the way for a more circular and decarbonized economy.
Major Players in the Carbon Capture And Utilization Market Ecosystem
- ExxonMobil Corporation
- Royal Dutch Shell PLC
- Chevron Corporation
- TotalEnergies SE
- BP plc
- Equinor ASA
- Mitsubishi Heavy Industries Ltd.
- Air Products and Chemicals Inc.
- Aker Solutions ASA
- Schlumberger Limited
- (Add more players as relevant or break down by technology/application if desired)
Key Developments in Carbon Capture And Utilization Market Industry
- April 2024: TotalEnergies and Vanguard Renewables form a joint venture to develop Farm Powered RNG initiatives across the US. This significantly expands the market for biogenic carbon capture and utilization.
- February 2023: Aker Solutions secures a contract for the Draugen project, demonstrating the growing adoption of CCU in offshore oil and gas operations. This project alone is expected to reduce emissions by up to 200,000 tons of CO2 per year.
Strategic Carbon Capture And Utilization Market Market Forecast
The Carbon Capture and Utilization (CCU) market is unequivocally poised for a period of substantial and transformative growth in the coming years. This expansion will be catalyzed by the relentless pace of technological innovation, the continued implementation of supportive governmental policies and incentives, and an increasing number of corporate commitments to ambitious sustainability targets. The development and deployment of new, high-value applications and the broadening of market penetration across a wider array of industries will further fuel this growth, firmly establishing CCU as an indispensable component of global decarbonization strategies. The inherent potential of the CCU market is vast, offering compelling opportunities that span diverse industrial sectors and geographical landscapes, thereby promising a remarkably bright and impactful future for CCU technologies and their strategic investors alike.
Carbon Capture And Utilization Market Segmentation
-
1. Service
- 1.1. Capture
- 1.2. Transportation
- 1.3. Utilization
- 1.4. Storage
-
2. Technology
- 2.1. Pre-combustion Capture
- 2.2. Oxy-fuel Combustion Capture
- 2.3. Post-combustion Capture
-
3. End User
- 3.1. Oil and Gas
- 3.2. Power Generation
- 3.3. Iron and Steel
- 3.4. Chemical and Petrochemical
- 3.5. Cement
- 3.6. Other End Users
Carbon Capture And Utilization Market Segmentation By Geography
-
1. Asia Pacific
- 1.1. India
- 1.2. China
- 1.3. Japan
- 1.4. Australia
- 1.5. Rest of Asia Pacific
-
2. North America
- 2.1. United States
- 2.2. Canada
- 2.3. Rest of North America
-
3. Europe
- 3.1. Germany
- 3.2. United Kingdom
- 3.3. France
- 3.4. Russia
- 3.5. Rest of Europe
-
4. South America
- 4.1. Brazil
- 4.2. Argentina
- 4.3. Rest of South America
-
5. Middle East and Africa
- 5.1. United Arab Emirates
- 5.2. South Africa
- 5.3. Rest of Middle East and Africa

Carbon Capture And Utilization Market Regional Market Share
Geographic Coverage of Carbon Capture And Utilization Market
Carbon Capture And Utilization Market REPORT HIGHLIGHTS
| Aspects | Details |
|---|---|
| Study Period | 2020-2034 |
| Base Year | 2025 |
| Estimated Year | 2026 |
| Forecast Period | 2026-2034 |
| Historical Period | 2020-2025 |
| Growth Rate | CAGR of 6.12% from 2020-2034 |
| Segmentation |
|
Table of Contents
- 1. Introduction
- 1.1. Research Scope
- 1.2. Market Segmentation
- 1.3. Research Objective
- 1.4. Definitions and Assumptions
- 2. Executive Summary
- 2.1. Market Snapshot
- 3. Market Dynamics
- 3.1. Market Drivers
- 3.2. Market Restrains
- 3.3. Market Trends
- 3.4. Market Opportunities
- 4. Market Factor Analysis
- 4.1. Porters Five Forces
- 4.1.1. Bargaining Power of Suppliers
- 4.1.2. Bargaining Power of Buyers
- 4.1.3. Threat of New Entrants
- 4.1.4. Threat of Substitutes
- 4.1.5. Competitive Rivalry
- 4.2. PESTEL analysis
- 4.3. BCG Analysis
- 4.3.1. Stars (High Growth, High Market Share)
- 4.3.2. Cash Cows (Low Growth, High Market Share)
- 4.3.3. Question Mark (High Growth, Low Market Share)
- 4.3.4. Dogs (Low Growth, Low Market Share)
- 4.4. Ansoff Matrix Analysis
- 4.5. Supply Chain Analysis
- 4.6. Regulatory Landscape
- 4.7. Current Market Potential and Opportunity Assessment (TAM–SAM–SOM Framework)
- 4.8. DMV Analyst Note
- 4.1. Porters Five Forces
- 5. Market Analysis, Insights and Forecast 2021-2033
- 5.1. Market Analysis, Insights and Forecast - by Service
- 5.1.1. Capture
- 5.1.2. Transportation
- 5.1.3. Utilization
- 5.1.4. Storage
- 5.2. Market Analysis, Insights and Forecast - by Technology
- 5.2.1. Pre-combustion Capture
- 5.2.2. Oxy-fuel Combustion Capture
- 5.2.3. Post-combustion Capture
- 5.3. Market Analysis, Insights and Forecast - by End User
- 5.3.1. Oil and Gas
- 5.3.2. Power Generation
- 5.3.3. Iron and Steel
- 5.3.4. Chemical and Petrochemical
- 5.3.5. Cement
- 5.3.6. Other End Users
- 5.4. Market Analysis, Insights and Forecast - by Region
- 5.4.1. Asia Pacific
- 5.4.2. North America
- 5.4.3. Europe
- 5.4.4. South America
- 5.4.5. Middle East and Africa
- 5.1. Market Analysis, Insights and Forecast - by Service
- 6. Global Carbon Capture And Utilization Market Analysis, Insights and Forecast, 2021-2033
- 6.1. Market Analysis, Insights and Forecast - by Service
- 6.1.1. Capture
- 6.1.2. Transportation
- 6.1.3. Utilization
- 6.1.4. Storage
- 6.2. Market Analysis, Insights and Forecast - by Technology
- 6.2.1. Pre-combustion Capture
- 6.2.2. Oxy-fuel Combustion Capture
- 6.2.3. Post-combustion Capture
- 6.3. Market Analysis, Insights and Forecast - by End User
- 6.3.1. Oil and Gas
- 6.3.2. Power Generation
- 6.3.3. Iron and Steel
- 6.3.4. Chemical and Petrochemical
- 6.3.5. Cement
- 6.3.6. Other End Users
- 6.1. Market Analysis, Insights and Forecast - by Service
- 7. Asia Pacific Carbon Capture And Utilization Market Analysis, Insights and Forecast, 2020-2032
- 7.1. Market Analysis, Insights and Forecast - by Service
- 7.1.1. Capture
- 7.1.2. Transportation
- 7.1.3. Utilization
- 7.1.4. Storage
- 7.2. Market Analysis, Insights and Forecast - by Technology
- 7.2.1. Pre-combustion Capture
- 7.2.2. Oxy-fuel Combustion Capture
- 7.2.3. Post-combustion Capture
- 7.3. Market Analysis, Insights and Forecast - by End User
- 7.3.1. Oil and Gas
- 7.3.2. Power Generation
- 7.3.3. Iron and Steel
- 7.3.4. Chemical and Petrochemical
- 7.3.5. Cement
- 7.3.6. Other End Users
- 7.1. Market Analysis, Insights and Forecast - by Service
- 8. North America Carbon Capture And Utilization Market Analysis, Insights and Forecast, 2020-2032
- 8.1. Market Analysis, Insights and Forecast - by Service
- 8.1.1. Capture
- 8.1.2. Transportation
- 8.1.3. Utilization
- 8.1.4. Storage
- 8.2. Market Analysis, Insights and Forecast - by Technology
- 8.2.1. Pre-combustion Capture
- 8.2.2. Oxy-fuel Combustion Capture
- 8.2.3. Post-combustion Capture
- 8.3. Market Analysis, Insights and Forecast - by End User
- 8.3.1. Oil and Gas
- 8.3.2. Power Generation
- 8.3.3. Iron and Steel
- 8.3.4. Chemical and Petrochemical
- 8.3.5. Cement
- 8.3.6. Other End Users
- 8.1. Market Analysis, Insights and Forecast - by Service
- 9. Europe Carbon Capture And Utilization Market Analysis, Insights and Forecast, 2020-2032
- 9.1. Market Analysis, Insights and Forecast - by Service
- 9.1.1. Capture
- 9.1.2. Transportation
- 9.1.3. Utilization
- 9.1.4. Storage
- 9.2. Market Analysis, Insights and Forecast - by Technology
- 9.2.1. Pre-combustion Capture
- 9.2.2. Oxy-fuel Combustion Capture
- 9.2.3. Post-combustion Capture
- 9.3. Market Analysis, Insights and Forecast - by End User
- 9.3.1. Oil and Gas
- 9.3.2. Power Generation
- 9.3.3. Iron and Steel
- 9.3.4. Chemical and Petrochemical
- 9.3.5. Cement
- 9.3.6. Other End Users
- 9.1. Market Analysis, Insights and Forecast - by Service
- 10. South America Carbon Capture And Utilization Market Analysis, Insights and Forecast, 2020-2032
- 10.1. Market Analysis, Insights and Forecast - by Service
- 10.1.1. Capture
- 10.1.2. Transportation
- 10.1.3. Utilization
- 10.1.4. Storage
- 10.2. Market Analysis, Insights and Forecast - by Technology
- 10.2.1. Pre-combustion Capture
- 10.2.2. Oxy-fuel Combustion Capture
- 10.2.3. Post-combustion Capture
- 10.3. Market Analysis, Insights and Forecast - by End User
- 10.3.1. Oil and Gas
- 10.3.2. Power Generation
- 10.3.3. Iron and Steel
- 10.3.4. Chemical and Petrochemical
- 10.3.5. Cement
- 10.3.6. Other End Users
- 10.1. Market Analysis, Insights and Forecast - by Service
- 11. Middle East and Africa Carbon Capture And Utilization Market Analysis, Insights and Forecast, 2020-2032
- 11.1. Market Analysis, Insights and Forecast - by Service
- 11.1.1. Capture
- 11.1.2. Transportation
- 11.1.3. Utilization
- 11.1.4. Storage
- 11.2. Market Analysis, Insights and Forecast - by Technology
- 11.2.1. Pre-combustion Capture
- 11.2.2. Oxy-fuel Combustion Capture
- 11.2.3. Post-combustion Capture
- 11.3. Market Analysis, Insights and Forecast - by End User
- 11.3.1. Oil and Gas
- 11.3.2. Power Generation
- 11.3.3. Iron and Steel
- 11.3.4. Chemical and Petrochemical
- 11.3.5. Cement
- 11.3.6. Other End Users
- 11.1. Market Analysis, Insights and Forecast - by Service
- 12. Competitive Analysis
- 12.1. Company Profiles
- 12.1.1 ExxonMobil Corporation
- 12.1.1.1. Company Overview
- 12.1.1.2. Products
- 12.1.1.3. Company Financials
- 12.1.1.4. SWOT Analysis
- 12.1.2 Royal Dutch Shell PLC
- 12.1.2.1. Company Overview
- 12.1.2.2. Products
- 12.1.2.3. Company Financials
- 12.1.2.4. SWOT Analysis
- 12.1.3 Chevron Corporation
- 12.1.3.1. Company Overview
- 12.1.3.2. Products
- 12.1.3.3. Company Financials
- 12.1.3.4. SWOT Analysis
- 12.1.4 TotalEnergies SE
- 12.1.4.1. Company Overview
- 12.1.4.2. Products
- 12.1.4.3. Company Financials
- 12.1.4.4. SWOT Analysis
- 12.1.5 BP plc
- 12.1.5.1. Company Overview
- 12.1.5.2. Products
- 12.1.5.3. Company Financials
- 12.1.5.4. SWOT Analysis
- 12.1.6 Equinor ASA
- 12.1.6.1. Company Overview
- 12.1.6.2. Products
- 12.1.6.3. Company Financials
- 12.1.6.4. SWOT Analysis
- 12.1.7 Mitsubishi Heavy Industries Ltd
- 12.1.7.1. Company Overview
- 12.1.7.2. Products
- 12.1.7.3. Company Financials
- 12.1.7.4. SWOT Analysis
- 12.1.8 Air Products and Chemicals Inc
- 12.1.8.1. Company Overview
- 12.1.8.2. Products
- 12.1.8.3. Company Financials
- 12.1.8.4. SWOT Analysis
- 12.1.9 Aker Solutions ASA
- 12.1.9.1. Company Overview
- 12.1.9.2. Products
- 12.1.9.3. Company Financials
- 12.1.9.4. SWOT Analysis
- 12.1.10 Schlumberger Limited
- 12.1.10.1. Company Overview
- 12.1.10.2. Products
- 12.1.10.3. Company Financials
- 12.1.10.4. SWOT Analysis
- 12.1.1 ExxonMobil Corporation
- 12.2. Market Entropy
- 12.2.1 Company's Key Areas Served
- 12.2.2 Recent Developments
- 12.3. Company Market Share Analysis 2025
- 12.3.1 Top 5 Companies Market Share Analysis
- 12.3.2 Top 3 Companies Market Share Analysis
- 12.4. List of Potential Customers
- 13. Research Methodology
List of Figures
- Figure 1: Global Carbon Capture And Utilization Market Revenue Breakdown (Million, %) by Region 2025 & 2033
- Figure 2: Global Carbon Capture And Utilization Market Volume Breakdown (Billion, %) by Region 2025 & 2033
- Figure 3: Asia Pacific Carbon Capture And Utilization Market Revenue (Million), by Service 2025 & 2033
- Figure 4: Asia Pacific Carbon Capture And Utilization Market Volume (Billion), by Service 2025 & 2033
- Figure 5: Asia Pacific Carbon Capture And Utilization Market Revenue Share (%), by Service 2025 & 2033
- Figure 6: Asia Pacific Carbon Capture And Utilization Market Volume Share (%), by Service 2025 & 2033
- Figure 7: Asia Pacific Carbon Capture And Utilization Market Revenue (Million), by Technology 2025 & 2033
- Figure 8: Asia Pacific Carbon Capture And Utilization Market Volume (Billion), by Technology 2025 & 2033
- Figure 9: Asia Pacific Carbon Capture And Utilization Market Revenue Share (%), by Technology 2025 & 2033
- Figure 10: Asia Pacific Carbon Capture And Utilization Market Volume Share (%), by Technology 2025 & 2033
- Figure 11: Asia Pacific Carbon Capture And Utilization Market Revenue (Million), by End User 2025 & 2033
- Figure 12: Asia Pacific Carbon Capture And Utilization Market Volume (Billion), by End User 2025 & 2033
- Figure 13: Asia Pacific Carbon Capture And Utilization Market Revenue Share (%), by End User 2025 & 2033
- Figure 14: Asia Pacific Carbon Capture And Utilization Market Volume Share (%), by End User 2025 & 2033
- Figure 15: Asia Pacific Carbon Capture And Utilization Market Revenue (Million), by Country 2025 & 2033
- Figure 16: Asia Pacific Carbon Capture And Utilization Market Volume (Billion), by Country 2025 & 2033
- Figure 17: Asia Pacific Carbon Capture And Utilization Market Revenue Share (%), by Country 2025 & 2033
- Figure 18: Asia Pacific Carbon Capture And Utilization Market Volume Share (%), by Country 2025 & 2033
- Figure 19: North America Carbon Capture And Utilization Market Revenue (Million), by Service 2025 & 2033
- Figure 20: North America Carbon Capture And Utilization Market Volume (Billion), by Service 2025 & 2033
- Figure 21: North America Carbon Capture And Utilization Market Revenue Share (%), by Service 2025 & 2033
- Figure 22: North America Carbon Capture And Utilization Market Volume Share (%), by Service 2025 & 2033
- Figure 23: North America Carbon Capture And Utilization Market Revenue (Million), by Technology 2025 & 2033
- Figure 24: North America Carbon Capture And Utilization Market Volume (Billion), by Technology 2025 & 2033
- Figure 25: North America Carbon Capture And Utilization Market Revenue Share (%), by Technology 2025 & 2033
- Figure 26: North America Carbon Capture And Utilization Market Volume Share (%), by Technology 2025 & 2033
- Figure 27: North America Carbon Capture And Utilization Market Revenue (Million), by End User 2025 & 2033
- Figure 28: North America Carbon Capture And Utilization Market Volume (Billion), by End User 2025 & 2033
- Figure 29: North America Carbon Capture And Utilization Market Revenue Share (%), by End User 2025 & 2033
- Figure 30: North America Carbon Capture And Utilization Market Volume Share (%), by End User 2025 & 2033
- Figure 31: North America Carbon Capture And Utilization Market Revenue (Million), by Country 2025 & 2033
- Figure 32: North America Carbon Capture And Utilization Market Volume (Billion), by Country 2025 & 2033
- Figure 33: North America Carbon Capture And Utilization Market Revenue Share (%), by Country 2025 & 2033
- Figure 34: North America Carbon Capture And Utilization Market Volume Share (%), by Country 2025 & 2033
- Figure 35: Europe Carbon Capture And Utilization Market Revenue (Million), by Service 2025 & 2033
- Figure 36: Europe Carbon Capture And Utilization Market Volume (Billion), by Service 2025 & 2033
- Figure 37: Europe Carbon Capture And Utilization Market Revenue Share (%), by Service 2025 & 2033
- Figure 38: Europe Carbon Capture And Utilization Market Volume Share (%), by Service 2025 & 2033
- Figure 39: Europe Carbon Capture And Utilization Market Revenue (Million), by Technology 2025 & 2033
- Figure 40: Europe Carbon Capture And Utilization Market Volume (Billion), by Technology 2025 & 2033
- Figure 41: Europe Carbon Capture And Utilization Market Revenue Share (%), by Technology 2025 & 2033
- Figure 42: Europe Carbon Capture And Utilization Market Volume Share (%), by Technology 2025 & 2033
- Figure 43: Europe Carbon Capture And Utilization Market Revenue (Million), by End User 2025 & 2033
- Figure 44: Europe Carbon Capture And Utilization Market Volume (Billion), by End User 2025 & 2033
- Figure 45: Europe Carbon Capture And Utilization Market Revenue Share (%), by End User 2025 & 2033
- Figure 46: Europe Carbon Capture And Utilization Market Volume Share (%), by End User 2025 & 2033
- Figure 47: Europe Carbon Capture And Utilization Market Revenue (Million), by Country 2025 & 2033
- Figure 48: Europe Carbon Capture And Utilization Market Volume (Billion), by Country 2025 & 2033
- Figure 49: Europe Carbon Capture And Utilization Market Revenue Share (%), by Country 2025 & 2033
- Figure 50: Europe Carbon Capture And Utilization Market Volume Share (%), by Country 2025 & 2033
- Figure 51: South America Carbon Capture And Utilization Market Revenue (Million), by Service 2025 & 2033
- Figure 52: South America Carbon Capture And Utilization Market Volume (Billion), by Service 2025 & 2033
- Figure 53: South America Carbon Capture And Utilization Market Revenue Share (%), by Service 2025 & 2033
- Figure 54: South America Carbon Capture And Utilization Market Volume Share (%), by Service 2025 & 2033
- Figure 55: South America Carbon Capture And Utilization Market Revenue (Million), by Technology 2025 & 2033
- Figure 56: South America Carbon Capture And Utilization Market Volume (Billion), by Technology 2025 & 2033
- Figure 57: South America Carbon Capture And Utilization Market Revenue Share (%), by Technology 2025 & 2033
- Figure 58: South America Carbon Capture And Utilization Market Volume Share (%), by Technology 2025 & 2033
- Figure 59: South America Carbon Capture And Utilization Market Revenue (Million), by End User 2025 & 2033
- Figure 60: South America Carbon Capture And Utilization Market Volume (Billion), by End User 2025 & 2033
- Figure 61: South America Carbon Capture And Utilization Market Revenue Share (%), by End User 2025 & 2033
- Figure 62: South America Carbon Capture And Utilization Market Volume Share (%), by End User 2025 & 2033
- Figure 63: South America Carbon Capture And Utilization Market Revenue (Million), by Country 2025 & 2033
- Figure 64: South America Carbon Capture And Utilization Market Volume (Billion), by Country 2025 & 2033
- Figure 65: South America Carbon Capture And Utilization Market Revenue Share (%), by Country 2025 & 2033
- Figure 66: South America Carbon Capture And Utilization Market Volume Share (%), by Country 2025 & 2033
- Figure 67: Middle East and Africa Carbon Capture And Utilization Market Revenue (Million), by Service 2025 & 2033
- Figure 68: Middle East and Africa Carbon Capture And Utilization Market Volume (Billion), by Service 2025 & 2033
- Figure 69: Middle East and Africa Carbon Capture And Utilization Market Revenue Share (%), by Service 2025 & 2033
- Figure 70: Middle East and Africa Carbon Capture And Utilization Market Volume Share (%), by Service 2025 & 2033
- Figure 71: Middle East and Africa Carbon Capture And Utilization Market Revenue (Million), by Technology 2025 & 2033
- Figure 72: Middle East and Africa Carbon Capture And Utilization Market Volume (Billion), by Technology 2025 & 2033
- Figure 73: Middle East and Africa Carbon Capture And Utilization Market Revenue Share (%), by Technology 2025 & 2033
- Figure 74: Middle East and Africa Carbon Capture And Utilization Market Volume Share (%), by Technology 2025 & 2033
- Figure 75: Middle East and Africa Carbon Capture And Utilization Market Revenue (Million), by End User 2025 & 2033
- Figure 76: Middle East and Africa Carbon Capture And Utilization Market Volume (Billion), by End User 2025 & 2033
- Figure 77: Middle East and Africa Carbon Capture And Utilization Market Revenue Share (%), by End User 2025 & 2033
- Figure 78: Middle East and Africa Carbon Capture And Utilization Market Volume Share (%), by End User 2025 & 2033
- Figure 79: Middle East and Africa Carbon Capture And Utilization Market Revenue (Million), by Country 2025 & 2033
- Figure 80: Middle East and Africa Carbon Capture And Utilization Market Volume (Billion), by Country 2025 & 2033
- Figure 81: Middle East and Africa Carbon Capture And Utilization Market Revenue Share (%), by Country 2025 & 2033
- Figure 82: Middle East and Africa Carbon Capture And Utilization Market Volume Share (%), by Country 2025 & 2033
List of Tables
- Table 1: Global Carbon Capture And Utilization Market Revenue Million Forecast, by Service 2020 & 2033
- Table 2: Global Carbon Capture And Utilization Market Volume Billion Forecast, by Service 2020 & 2033
- Table 3: Global Carbon Capture And Utilization Market Revenue Million Forecast, by Technology 2020 & 2033
- Table 4: Global Carbon Capture And Utilization Market Volume Billion Forecast, by Technology 2020 & 2033
- Table 5: Global Carbon Capture And Utilization Market Revenue Million Forecast, by End User 2020 & 2033
- Table 6: Global Carbon Capture And Utilization Market Volume Billion Forecast, by End User 2020 & 2033
- Table 7: Global Carbon Capture And Utilization Market Revenue Million Forecast, by Region 2020 & 2033
- Table 8: Global Carbon Capture And Utilization Market Volume Billion Forecast, by Region 2020 & 2033
- Table 9: Global Carbon Capture And Utilization Market Revenue Million Forecast, by Service 2020 & 2033
- Table 10: Global Carbon Capture And Utilization Market Volume Billion Forecast, by Service 2020 & 2033
- Table 11: Global Carbon Capture And Utilization Market Revenue Million Forecast, by Technology 2020 & 2033
- Table 12: Global Carbon Capture And Utilization Market Volume Billion Forecast, by Technology 2020 & 2033
- Table 13: Global Carbon Capture And Utilization Market Revenue Million Forecast, by End User 2020 & 2033
- Table 14: Global Carbon Capture And Utilization Market Volume Billion Forecast, by End User 2020 & 2033
- Table 15: Global Carbon Capture And Utilization Market Revenue Million Forecast, by Country 2020 & 2033
- Table 16: Global Carbon Capture And Utilization Market Volume Billion Forecast, by Country 2020 & 2033
- Table 17: India Carbon Capture And Utilization Market Revenue (Million) Forecast, by Application 2020 & 2033
- Table 18: India Carbon Capture And Utilization Market Volume (Billion) Forecast, by Application 2020 & 2033
- Table 19: China Carbon Capture And Utilization Market Revenue (Million) Forecast, by Application 2020 & 2033
- Table 20: China Carbon Capture And Utilization Market Volume (Billion) Forecast, by Application 2020 & 2033
- Table 21: Japan Carbon Capture And Utilization Market Revenue (Million) Forecast, by Application 2020 & 2033
- Table 22: Japan Carbon Capture And Utilization Market Volume (Billion) Forecast, by Application 2020 & 2033
- Table 23: Australia Carbon Capture And Utilization Market Revenue (Million) Forecast, by Application 2020 & 2033
- Table 24: Australia Carbon Capture And Utilization Market Volume (Billion) Forecast, by Application 2020 & 2033
- Table 25: Rest of Asia Pacific Carbon Capture And Utilization Market Revenue (Million) Forecast, by Application 2020 & 2033
- Table 26: Rest of Asia Pacific Carbon Capture And Utilization Market Volume (Billion) Forecast, by Application 2020 & 2033
- Table 27: Global Carbon Capture And Utilization Market Revenue Million Forecast, by Service 2020 & 2033
- Table 28: Global Carbon Capture And Utilization Market Volume Billion Forecast, by Service 2020 & 2033
- Table 29: Global Carbon Capture And Utilization Market Revenue Million Forecast, by Technology 2020 & 2033
- Table 30: Global Carbon Capture And Utilization Market Volume Billion Forecast, by Technology 2020 & 2033
- Table 31: Global Carbon Capture And Utilization Market Revenue Million Forecast, by End User 2020 & 2033
- Table 32: Global Carbon Capture And Utilization Market Volume Billion Forecast, by End User 2020 & 2033
- Table 33: Global Carbon Capture And Utilization Market Revenue Million Forecast, by Country 2020 & 2033
- Table 34: Global Carbon Capture And Utilization Market Volume Billion Forecast, by Country 2020 & 2033
- Table 35: United States Carbon Capture And Utilization Market Revenue (Million) Forecast, by Application 2020 & 2033
- Table 36: United States Carbon Capture And Utilization Market Volume (Billion) Forecast, by Application 2020 & 2033
- Table 37: Canada Carbon Capture And Utilization Market Revenue (Million) Forecast, by Application 2020 & 2033
- Table 38: Canada Carbon Capture And Utilization Market Volume (Billion) Forecast, by Application 2020 & 2033
- Table 39: Rest of North America Carbon Capture And Utilization Market Revenue (Million) Forecast, by Application 2020 & 2033
- Table 40: Rest of North America Carbon Capture And Utilization Market Volume (Billion) Forecast, by Application 2020 & 2033
- Table 41: Global Carbon Capture And Utilization Market Revenue Million Forecast, by Service 2020 & 2033
- Table 42: Global Carbon Capture And Utilization Market Volume Billion Forecast, by Service 2020 & 2033
- Table 43: Global Carbon Capture And Utilization Market Revenue Million Forecast, by Technology 2020 & 2033
- Table 44: Global Carbon Capture And Utilization Market Volume Billion Forecast, by Technology 2020 & 2033
- Table 45: Global Carbon Capture And Utilization Market Revenue Million Forecast, by End User 2020 & 2033
- Table 46: Global Carbon Capture And Utilization Market Volume Billion Forecast, by End User 2020 & 2033
- Table 47: Global Carbon Capture And Utilization Market Revenue Million Forecast, by Country 2020 & 2033
- Table 48: Global Carbon Capture And Utilization Market Volume Billion Forecast, by Country 2020 & 2033
- Table 49: Germany Carbon Capture And Utilization Market Revenue (Million) Forecast, by Application 2020 & 2033
- Table 50: Germany Carbon Capture And Utilization Market Volume (Billion) Forecast, by Application 2020 & 2033
- Table 51: United Kingdom Carbon Capture And Utilization Market Revenue (Million) Forecast, by Application 2020 & 2033
- Table 52: United Kingdom Carbon Capture And Utilization Market Volume (Billion) Forecast, by Application 2020 & 2033
- Table 53: France Carbon Capture And Utilization Market Revenue (Million) Forecast, by Application 2020 & 2033
- Table 54: France Carbon Capture And Utilization Market Volume (Billion) Forecast, by Application 2020 & 2033
- Table 55: Russia Carbon Capture And Utilization Market Revenue (Million) Forecast, by Application 2020 & 2033
- Table 56: Russia Carbon Capture And Utilization Market Volume (Billion) Forecast, by Application 2020 & 2033
- Table 57: Rest of Europe Carbon Capture And Utilization Market Revenue (Million) Forecast, by Application 2020 & 2033
- Table 58: Rest of Europe Carbon Capture And Utilization Market Volume (Billion) Forecast, by Application 2020 & 2033
- Table 59: Global Carbon Capture And Utilization Market Revenue Million Forecast, by Service 2020 & 2033
- Table 60: Global Carbon Capture And Utilization Market Volume Billion Forecast, by Service 2020 & 2033
- Table 61: Global Carbon Capture And Utilization Market Revenue Million Forecast, by Technology 2020 & 2033
- Table 62: Global Carbon Capture And Utilization Market Volume Billion Forecast, by Technology 2020 & 2033
- Table 63: Global Carbon Capture And Utilization Market Revenue Million Forecast, by End User 2020 & 2033
- Table 64: Global Carbon Capture And Utilization Market Volume Billion Forecast, by End User 2020 & 2033
- Table 65: Global Carbon Capture And Utilization Market Revenue Million Forecast, by Country 2020 & 2033
- Table 66: Global Carbon Capture And Utilization Market Volume Billion Forecast, by Country 2020 & 2033
- Table 67: Brazil Carbon Capture And Utilization Market Revenue (Million) Forecast, by Application 2020 & 2033
- Table 68: Brazil Carbon Capture And Utilization Market Volume (Billion) Forecast, by Application 2020 & 2033
- Table 69: Argentina Carbon Capture And Utilization Market Revenue (Million) Forecast, by Application 2020 & 2033
- Table 70: Argentina Carbon Capture And Utilization Market Volume (Billion) Forecast, by Application 2020 & 2033
- Table 71: Rest of South America Carbon Capture And Utilization Market Revenue (Million) Forecast, by Application 2020 & 2033
- Table 72: Rest of South America Carbon Capture And Utilization Market Volume (Billion) Forecast, by Application 2020 & 2033
- Table 73: Global Carbon Capture And Utilization Market Revenue Million Forecast, by Service 2020 & 2033
- Table 74: Global Carbon Capture And Utilization Market Volume Billion Forecast, by Service 2020 & 2033
- Table 75: Global Carbon Capture And Utilization Market Revenue Million Forecast, by Technology 2020 & 2033
- Table 76: Global Carbon Capture And Utilization Market Volume Billion Forecast, by Technology 2020 & 2033
- Table 77: Global Carbon Capture And Utilization Market Revenue Million Forecast, by End User 2020 & 2033
- Table 78: Global Carbon Capture And Utilization Market Volume Billion Forecast, by End User 2020 & 2033
- Table 79: Global Carbon Capture And Utilization Market Revenue Million Forecast, by Country 2020 & 2033
- Table 80: Global Carbon Capture And Utilization Market Volume Billion Forecast, by Country 2020 & 2033
- Table 81: United Arab Emirates Carbon Capture And Utilization Market Revenue (Million) Forecast, by Application 2020 & 2033
- Table 82: United Arab Emirates Carbon Capture And Utilization Market Volume (Billion) Forecast, by Application 2020 & 2033
- Table 83: South Africa Carbon Capture And Utilization Market Revenue (Million) Forecast, by Application 2020 & 2033
- Table 84: South Africa Carbon Capture And Utilization Market Volume (Billion) Forecast, by Application 2020 & 2033
- Table 85: Rest of Middle East and Africa Carbon Capture And Utilization Market Revenue (Million) Forecast, by Application 2020 & 2033
- Table 86: Rest of Middle East and Africa Carbon Capture And Utilization Market Volume (Billion) Forecast, by Application 2020 & 2033
Frequently Asked Questions
1. What is the projected Compound Annual Growth Rate (CAGR) of the Carbon Capture And Utilization Market?
The projected CAGR is approximately 6.12%.
2. Which companies are prominent players in the Carbon Capture And Utilization Market?
Key companies in the market include ExxonMobil Corporation, Royal Dutch Shell PLC, Chevron Corporation, TotalEnergies SE, BP plc, Equinor ASA, Mitsubishi Heavy Industries Ltd, Air Products and Chemicals Inc, Aker Solutions ASA, Schlumberger Limited.
3. What are the main segments of the Carbon Capture And Utilization Market?
The market segments include Service, Technology, End User.
4. Can you provide details about the market size?
The market size is estimated to be USD 2.45 Million as of 2022.
5. What are some drivers contributing to market growth?
Environmental Regulations and Climate Change Goal; Growing Focuse on Reducing Co2 Emission.
6. What are the notable trends driving market growth?
Oil & Gas Industry was the Major End User in Market.
7. Are there any restraints impacting market growth?
Environmental Regulations and Climate Change Goal; Growing Focuse on Reducing Co2 Emission.
8. Can you provide examples of recent developments in the market?
April 2024: TotalEnergies, a prominent global energy firm, and Vanguard Renewables, a leading US player in converting organic farm waste into renewable natural gas (RNG), inked a deal. The agreement establishes a 50-50 joint venture, intending to develop, construct, and manage Farm Powered RNG initiatives across the United States. Vanguard Renewables, incidentally, is a portfolio company under BlackRock's Diversified Infrastructure business.February 2023: Aker Solutions confirmed signing the contract for the Draugen project with OKEA. The project is expected to reduce emissions by up to 200,000 tons of CO2 per year.
9. What pricing options are available for accessing the report?
Pricing options include single-user, multi-user, and enterprise licenses priced at USD 4750, USD 5250, and USD 8750 respectively.
10. Is the market size provided in terms of value or volume?
The market size is provided in terms of value, measured in Million and volume, measured in Billion.
11. Are there any specific market keywords associated with the report?
Yes, the market keyword associated with the report is "Carbon Capture And Utilization Market," which aids in identifying and referencing the specific market segment covered.
12. How do I determine which pricing option suits my needs best?
The pricing options vary based on user requirements and access needs. Individual users may opt for single-user licenses, while businesses requiring broader access may choose multi-user or enterprise licenses for cost-effective access to the report.
13. Are there any additional resources or data provided in the Carbon Capture And Utilization Market report?
While the report offers comprehensive insights, it's advisable to review the specific contents or supplementary materials provided to ascertain if additional resources or data are available.
14. How can I stay updated on further developments or reports in the Carbon Capture And Utilization Market?
To stay informed about further developments, trends, and reports in the Carbon Capture And Utilization Market, consider subscribing to industry newsletters, following relevant companies and organizations, or regularly checking reputable industry news sources and publications.
Methodology
Step 1 - Identification of Relevant Samples Size from Population Database


Step 2 - Approaches for Defining Global Market Size (Value, Volume* & Price*)

Note*: In applicable scenarios
Step 3 - Data Sources
Primary Research
- Web Analytics
- Survey Reports
- Research Institute
- Latest Research Reports
- Opinion Leaders
Secondary Research
- Annual Reports
- White Paper
- Latest Press Release
- Industry Association
- Paid Database
- Investor Presentations

Step 4 - Data Triangulation
Involves using different sources of information in order to increase the validity of a study
These sources are likely to be stakeholders in a program - participants, other researchers, program staff, other community members, and so on.
Then we put all data in single framework & apply various statistical tools to find out the dynamic on the market.
During the analysis stage, feedback from the stakeholder groups would be compared to determine areas of agreement as well as areas of divergence