

Key Insights
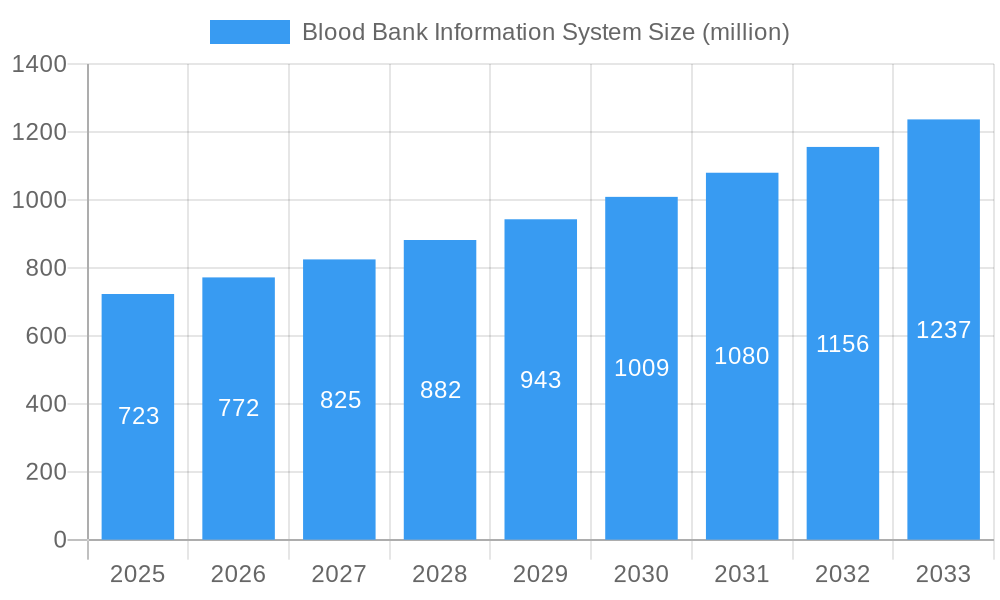
The global Blood Bank Information System (BBIS) market, valued at $723 million in 2025, is poised for significant growth, projected to expand at a Compound Annual Growth Rate (CAGR) of 6.5% from 2025 to 2033. This robust growth is driven by several key factors. Increasing blood transfusion requirements due to rising chronic diseases and an aging population necessitate efficient blood bank management. Simultaneously, stringent regulatory compliance mandates for blood safety and traceability are pushing adoption of sophisticated BBIS solutions. The integration of advanced technologies like artificial intelligence (AI) and machine learning (ML) is further accelerating market expansion, allowing for improved inventory management, predictive modeling of blood supply, and enhanced donor management. Furthermore, the growing adoption of electronic health records (EHRs) and interoperability standards creates opportunities for seamless data exchange and improved healthcare coordination, bolstering BBIS market demand.
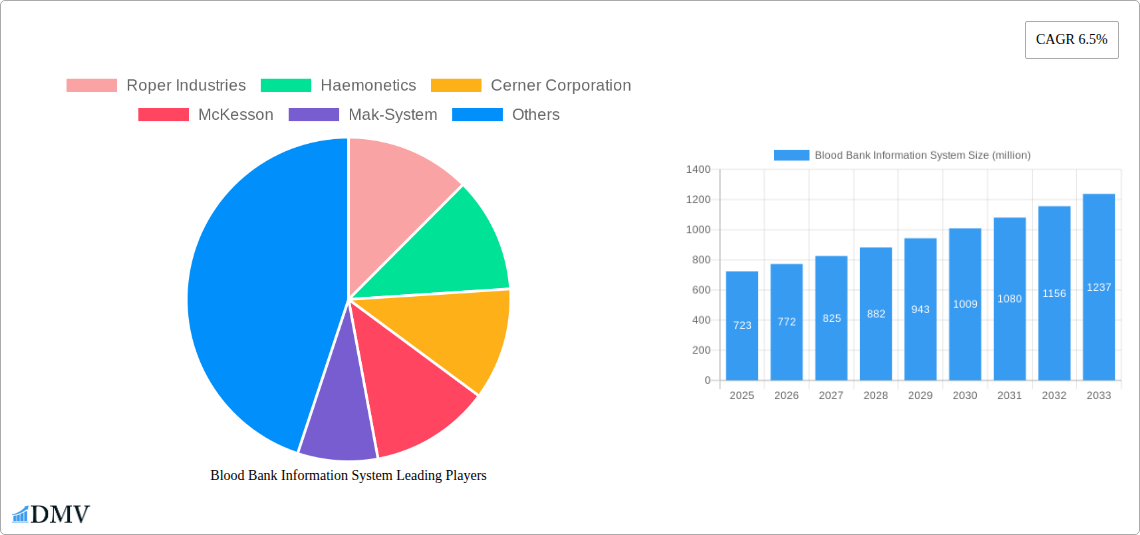
Blood Bank Information System Market Size (In Million)
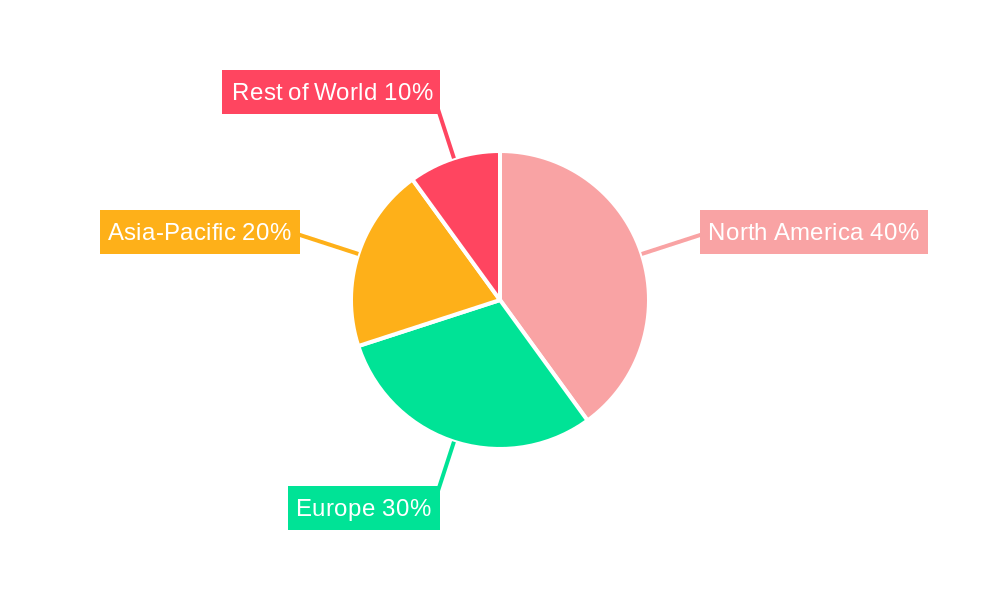
The market segmentation reveals a diverse landscape of players including large multinational corporations like Roper Industries and Haemonetics, alongside specialized software providers and regional players. Competitive dynamics are shaped by factors such as technological innovation, product features, pricing strategies, and service offerings. While the market faces challenges like high initial investment costs and the need for continuous system updates, the long-term benefits of improved efficiency, reduced errors, and enhanced patient safety outweigh these constraints. The North American and European markets currently hold a significant share, but emerging economies in Asia-Pacific and Latin America are showing promising growth potential driven by increasing healthcare spending and infrastructure development. This presents significant opportunities for market expansion and diversification for established and new entrants.
Blood Bank Information System Company Market Share
Blood Bank Information System Market Report: 2019-2033 - A Comprehensive Analysis
This insightful report provides a comprehensive analysis of the global Blood Bank Information System market, projecting a market value exceeding $XX million by 2033. The study meticulously examines market dynamics, technological advancements, and competitive landscapes during the study period (2019-2033), with a focus on the base year 2025 and forecast period 2025-2033. This report is essential for stakeholders including investors, industry professionals, and researchers seeking a deep understanding of this crucial healthcare sector.
Blood Bank Information System Market Composition & Trends
The global Blood Bank Information System market, valued at $XX million in 2025, exhibits a moderately concentrated landscape. Key players like Roper Industries, Haemonetics, and Cerner Corporation hold significant market share, but several smaller players contribute to a dynamic competitive environment. Market share distribution varies across regions, with North America and Europe currently dominating, driven by robust healthcare infrastructure and higher adoption rates. Innovation is primarily driven by advancements in data analytics, automation, and integration with other healthcare systems. Stringent regulatory frameworks, particularly concerning data privacy and security (e.g., HIPAA, GDPR), significantly influence market development. Substitute products are limited, mainly consisting of manual processes which are increasingly inefficient. The primary end-users are blood banks, hospitals, and transfusion centers. Recent M&A activities, totaling an estimated $XX million in deal value over the historical period, reflect market consolidation and the pursuit of technological synergies.
- Market Concentration: Moderately concentrated, with top 5 players holding approximately xx% market share.
- Innovation Catalysts: Advancements in AI, cloud computing, and data analytics.
- Regulatory Landscape: Stringent regulations impacting data security and interoperability.
- Substitute Products: Limited, primarily manual processes.
- End-User Profiles: Blood banks, hospitals, and transfusion centers.
- M&A Activities: $XX million in deal value (2019-2024), indicating market consolidation.
Blood Bank Information System Industry Evolution
The Blood Bank Information System market has witnessed substantial growth since 2019, driven by rising demand for efficient blood management and increasing adoption of digital health solutions. The historical period (2019-2024) saw a compound annual growth rate (CAGR) of xx%, primarily fueled by technological advancements such as improved software functionalities, seamless integration capabilities, and enhanced data analytics tools. The market is expected to maintain a healthy CAGR of xx% during the forecast period (2025-2033). This growth is further bolstered by the increasing prevalence of chronic diseases requiring blood transfusions, stringent regulatory requirements promoting electronic health records (EHR) adoption, and growing investment in healthcare infrastructure in emerging economies. Consumer demand is shifting towards integrated, user-friendly systems that offer real-time data access and improved traceability throughout the blood supply chain. The adoption rate of Blood Bank Information Systems is projected to reach xx% by 2033, reflecting the industry's transformation towards digital blood management.
Leading Regions, Countries, or Segments in Blood Bank Information System
North America currently leads the global Blood Bank Information System market, followed by Europe and Asia Pacific. This dominance is attributed to several factors:
North America:
- High healthcare expenditure and advanced healthcare infrastructure.
- Stringent regulatory mandates promoting EHR adoption.
- Early adoption of innovative technologies.
- Significant investments in research and development.
Europe:
- Strong regulatory framework promoting data privacy and security.
- Growing focus on improving blood supply chain efficiency.
- Increasing demand for integrated hospital information systems.
Asia Pacific:
- Rapidly growing healthcare sector with increasing investments.
- Rising prevalence of chronic diseases.
- Government initiatives promoting digital health transformation.
The continued growth in North America and Europe is anticipated, along with increasing market penetration in the Asia Pacific region, driven by economic development and expanding healthcare infrastructure. This expansion is expected to be further propelled by increasing government funding and the rising prevalence of chronic diseases across the globe, leading to a greater demand for efficient blood management systems.
Blood Bank Information System Product Innovations
Recent innovations focus on enhancing functionalities, including improved inventory management, automated donor tracking, and sophisticated blood component management features. Integration with laboratory information systems (LIS) and EHRs is becoming crucial, streamlining workflow and improving data accuracy. Cloud-based solutions are gaining traction, offering scalability, accessibility, and reduced IT infrastructure costs. Unique selling propositions often include advanced analytics dashboards providing insights into blood supply chain efficiency and predictive modeling capabilities for optimizing inventory management.
Propelling Factors for Blood Bank Information System Growth
Technological advancements like AI-powered predictive analytics for inventory management and automated blood typing systems are significantly driving market growth. Economic factors, including increasing healthcare spending and government investments in healthcare infrastructure, are further boosting adoption. Stringent regulatory mandates focused on blood safety and efficiency, compelling the adoption of advanced information systems, are further propelling market expansion.
Obstacles in the Blood Bank Information System Market
High initial investment costs for implementing new systems can be a barrier to adoption, particularly for smaller blood banks. Supply chain disruptions impacting the availability of hardware and software components can hinder growth. Intense competition among established players and emerging vendors creates pricing pressures and challenges for market penetration. Furthermore, maintaining data security and compliance with evolving regulatory requirements poses significant challenges for blood bank operators.
Future Opportunities in Blood Bank Information System
Emerging opportunities lie in expanding into underserved markets in developing countries, leveraging the potential of AI and machine learning for predictive analytics and automation, and developing integrated solutions that seamlessly connect with other healthcare IT systems. The growing focus on personalized medicine and the need for precise blood component management offer further opportunities for innovation and market expansion.
Major Players in the Blood Bank Information System Ecosystem
- Roper Industries
- Haemonetics
- Cerner Corporation
- McKesson
- Mak-System
- Integrated Medical Systems
- Mediware
- Compugroup
- SCC Soft Computer
- Zhongde Gaoye
- Blood Bank Computer Systems
- Jinfeng Yitong
- Fengde
- IT Synergistics
- Psyche Systems
- Clinisys
Key Developments in Blood Bank Information System Industry
- 2022 Q4: Cerner Corporation launched a new integrated blood management module for its EHR system.
- 2023 Q1: Haemonetics announced a strategic partnership with a leading blood bank to pilot a new AI-powered inventory management system.
- 2023 Q3: Roper Industries acquired a smaller blood bank software company, expanding its market reach.
- (Further developments can be added here as available)
Strategic Blood Bank Information System Market Forecast
The Blood Bank Information System market is poised for continued growth, driven by technological advancements, increasing demand for efficient blood management, and regulatory mandates promoting digital health transformation. The forecast period (2025-2033) anticipates a significant expansion in market size, presenting substantial opportunities for existing players and new entrants. The focus on integration, data security, and AI-powered solutions will be crucial for market leadership in the years to come.
Blood Bank Information System Segmentation
-
1. Application
- 1.1. Hospital
- 1.2. Blood Station
-
2. Type
- 2.1. Blood Donor Management Module
- 2.2. Blood Bank Transfusion Service Module
- 2.3. Other
Blood Bank Information System Segmentation By Geography
-
1. North America
- 1.1. United States
- 1.2. Canada
- 1.3. Mexico
-
2. South America
- 2.1. Brazil
- 2.2. Argentina
- 2.3. Rest of South America
-
3. Europe
- 3.1. United Kingdom
- 3.2. Germany
- 3.3. France
- 3.4. Italy
- 3.5. Spain
- 3.6. Russia
- 3.7. Benelux
- 3.8. Nordics
- 3.9. Rest of Europe
-
4. Middle East & Africa
- 4.1. Turkey
- 4.2. Israel
- 4.3. GCC
- 4.4. North Africa
- 4.5. South Africa
- 4.6. Rest of Middle East & Africa
-
5. Asia Pacific
- 5.1. China
- 5.2. India
- 5.3. Japan
- 5.4. South Korea
- 5.5. ASEAN
- 5.6. Oceania
- 5.7. Rest of Asia Pacific
Blood Bank Information System Regional Market Share
Geographic Coverage of Blood Bank Information System
Blood Bank Information System REPORT HIGHLIGHTS
| Aspects | Details |
|---|---|
| Study Period | 2020-2034 |
| Base Year | 2025 |
| Estimated Year | 2026 |
| Forecast Period | 2026-2034 |
| Historical Period | 2020-2025 |
| Growth Rate | CAGR of 6.5% from 2020-2034 |
| Segmentation |
|
Table of Contents
- 1. Introduction
- 1.1. Research Scope
- 1.2. Market Segmentation
- 1.3. Research Methodology
- 1.4. Definitions and Assumptions
- 2. Executive Summary
- 2.1. Introduction
- 3. Market Dynamics
- 3.1. Introduction
- 3.2. Market Drivers
- 3.3. Market Restrains
- 3.4. Market Trends
- 4. Market Factor Analysis
- 4.1. Porters Five Forces
- 4.2. Supply/Value Chain
- 4.3. PESTEL analysis
- 4.4. Market Entropy
- 4.5. Patent/Trademark Analysis
- 5. Global Blood Bank Information System Analysis, Insights and Forecast, 2020-2032
- 5.1. Market Analysis, Insights and Forecast - by Application
- 5.1.1. Hospital
- 5.1.2. Blood Station
- 5.2. Market Analysis, Insights and Forecast - by Type
- 5.2.1. Blood Donor Management Module
- 5.2.2. Blood Bank Transfusion Service Module
- 5.2.3. Other
- 5.3. Market Analysis, Insights and Forecast - by Region
- 5.3.1. North America
- 5.3.2. South America
- 5.3.3. Europe
- 5.3.4. Middle East & Africa
- 5.3.5. Asia Pacific
- 5.1. Market Analysis, Insights and Forecast - by Application
- 6. North America Blood Bank Information System Analysis, Insights and Forecast, 2020-2032
- 6.1. Market Analysis, Insights and Forecast - by Application
- 6.1.1. Hospital
- 6.1.2. Blood Station
- 6.2. Market Analysis, Insights and Forecast - by Type
- 6.2.1. Blood Donor Management Module
- 6.2.2. Blood Bank Transfusion Service Module
- 6.2.3. Other
- 6.1. Market Analysis, Insights and Forecast - by Application
- 7. South America Blood Bank Information System Analysis, Insights and Forecast, 2020-2032
- 7.1. Market Analysis, Insights and Forecast - by Application
- 7.1.1. Hospital
- 7.1.2. Blood Station
- 7.2. Market Analysis, Insights and Forecast - by Type
- 7.2.1. Blood Donor Management Module
- 7.2.2. Blood Bank Transfusion Service Module
- 7.2.3. Other
- 7.1. Market Analysis, Insights and Forecast - by Application
- 8. Europe Blood Bank Information System Analysis, Insights and Forecast, 2020-2032
- 8.1. Market Analysis, Insights and Forecast - by Application
- 8.1.1. Hospital
- 8.1.2. Blood Station
- 8.2. Market Analysis, Insights and Forecast - by Type
- 8.2.1. Blood Donor Management Module
- 8.2.2. Blood Bank Transfusion Service Module
- 8.2.3. Other
- 8.1. Market Analysis, Insights and Forecast - by Application
- 9. Middle East & Africa Blood Bank Information System Analysis, Insights and Forecast, 2020-2032
- 9.1. Market Analysis, Insights and Forecast - by Application
- 9.1.1. Hospital
- 9.1.2. Blood Station
- 9.2. Market Analysis, Insights and Forecast - by Type
- 9.2.1. Blood Donor Management Module
- 9.2.2. Blood Bank Transfusion Service Module
- 9.2.3. Other
- 9.1. Market Analysis, Insights and Forecast - by Application
- 10. Asia Pacific Blood Bank Information System Analysis, Insights and Forecast, 2020-2032
- 10.1. Market Analysis, Insights and Forecast - by Application
- 10.1.1. Hospital
- 10.1.2. Blood Station
- 10.2. Market Analysis, Insights and Forecast - by Type
- 10.2.1. Blood Donor Management Module
- 10.2.2. Blood Bank Transfusion Service Module
- 10.2.3. Other
- 10.1. Market Analysis, Insights and Forecast - by Application
- 11. Competitive Analysis
- 11.1. Global Market Share Analysis 2025
- 11.2. Company Profiles
- 11.2.1 Roper Industries
- 11.2.1.1. Overview
- 11.2.1.2. Products
- 11.2.1.3. SWOT Analysis
- 11.2.1.4. Recent Developments
- 11.2.1.5. Financials (Based on Availability)
- 11.2.2 Haemonetics
- 11.2.2.1. Overview
- 11.2.2.2. Products
- 11.2.2.3. SWOT Analysis
- 11.2.2.4. Recent Developments
- 11.2.2.5. Financials (Based on Availability)
- 11.2.3 Cerner Corporation
- 11.2.3.1. Overview
- 11.2.3.2. Products
- 11.2.3.3. SWOT Analysis
- 11.2.3.4. Recent Developments
- 11.2.3.5. Financials (Based on Availability)
- 11.2.4 McKesson
- 11.2.4.1. Overview
- 11.2.4.2. Products
- 11.2.4.3. SWOT Analysis
- 11.2.4.4. Recent Developments
- 11.2.4.5. Financials (Based on Availability)
- 11.2.5 Mak-System
- 11.2.5.1. Overview
- 11.2.5.2. Products
- 11.2.5.3. SWOT Analysis
- 11.2.5.4. Recent Developments
- 11.2.5.5. Financials (Based on Availability)
- 11.2.6 Integrated Medical Systems
- 11.2.6.1. Overview
- 11.2.6.2. Products
- 11.2.6.3. SWOT Analysis
- 11.2.6.4. Recent Developments
- 11.2.6.5. Financials (Based on Availability)
- 11.2.7 Mediware
- 11.2.7.1. Overview
- 11.2.7.2. Products
- 11.2.7.3. SWOT Analysis
- 11.2.7.4. Recent Developments
- 11.2.7.5. Financials (Based on Availability)
- 11.2.8 Compugroup
- 11.2.8.1. Overview
- 11.2.8.2. Products
- 11.2.8.3. SWOT Analysis
- 11.2.8.4. Recent Developments
- 11.2.8.5. Financials (Based on Availability)
- 11.2.9 SCC Soft Computer
- 11.2.9.1. Overview
- 11.2.9.2. Products
- 11.2.9.3. SWOT Analysis
- 11.2.9.4. Recent Developments
- 11.2.9.5. Financials (Based on Availability)
- 11.2.10 Zhongde Gaoye
- 11.2.10.1. Overview
- 11.2.10.2. Products
- 11.2.10.3. SWOT Analysis
- 11.2.10.4. Recent Developments
- 11.2.10.5. Financials (Based on Availability)
- 11.2.11 Blood Bank Computer Systems
- 11.2.11.1. Overview
- 11.2.11.2. Products
- 11.2.11.3. SWOT Analysis
- 11.2.11.4. Recent Developments
- 11.2.11.5. Financials (Based on Availability)
- 11.2.12 Jinfeng Yitong
- 11.2.12.1. Overview
- 11.2.12.2. Products
- 11.2.12.3. SWOT Analysis
- 11.2.12.4. Recent Developments
- 11.2.12.5. Financials (Based on Availability)
- 11.2.13 Fengde
- 11.2.13.1. Overview
- 11.2.13.2. Products
- 11.2.13.3. SWOT Analysis
- 11.2.13.4. Recent Developments
- 11.2.13.5. Financials (Based on Availability)
- 11.2.14 IT Synergistics
- 11.2.14.1. Overview
- 11.2.14.2. Products
- 11.2.14.3. SWOT Analysis
- 11.2.14.4. Recent Developments
- 11.2.14.5. Financials (Based on Availability)
- 11.2.15 Psyche Systems
- 11.2.15.1. Overview
- 11.2.15.2. Products
- 11.2.15.3. SWOT Analysis
- 11.2.15.4. Recent Developments
- 11.2.15.5. Financials (Based on Availability)
- 11.2.16 Clinisys
- 11.2.16.1. Overview
- 11.2.16.2. Products
- 11.2.16.3. SWOT Analysis
- 11.2.16.4. Recent Developments
- 11.2.16.5. Financials (Based on Availability)
- 11.2.1 Roper Industries
List of Figures
- Figure 1: Global Blood Bank Information System Revenue Breakdown (million, %) by Region 2025 & 2033
- Figure 2: North America Blood Bank Information System Revenue (million), by Application 2025 & 2033
- Figure 3: North America Blood Bank Information System Revenue Share (%), by Application 2025 & 2033
- Figure 4: North America Blood Bank Information System Revenue (million), by Type 2025 & 2033
- Figure 5: North America Blood Bank Information System Revenue Share (%), by Type 2025 & 2033
- Figure 6: North America Blood Bank Information System Revenue (million), by Country 2025 & 2033
- Figure 7: North America Blood Bank Information System Revenue Share (%), by Country 2025 & 2033
- Figure 8: South America Blood Bank Information System Revenue (million), by Application 2025 & 2033
- Figure 9: South America Blood Bank Information System Revenue Share (%), by Application 2025 & 2033
- Figure 10: South America Blood Bank Information System Revenue (million), by Type 2025 & 2033
- Figure 11: South America Blood Bank Information System Revenue Share (%), by Type 2025 & 2033
- Figure 12: South America Blood Bank Information System Revenue (million), by Country 2025 & 2033
- Figure 13: South America Blood Bank Information System Revenue Share (%), by Country 2025 & 2033
- Figure 14: Europe Blood Bank Information System Revenue (million), by Application 2025 & 2033
- Figure 15: Europe Blood Bank Information System Revenue Share (%), by Application 2025 & 2033
- Figure 16: Europe Blood Bank Information System Revenue (million), by Type 2025 & 2033
- Figure 17: Europe Blood Bank Information System Revenue Share (%), by Type 2025 & 2033
- Figure 18: Europe Blood Bank Information System Revenue (million), by Country 2025 & 2033
- Figure 19: Europe Blood Bank Information System Revenue Share (%), by Country 2025 & 2033
- Figure 20: Middle East & Africa Blood Bank Information System Revenue (million), by Application 2025 & 2033
- Figure 21: Middle East & Africa Blood Bank Information System Revenue Share (%), by Application 2025 & 2033
- Figure 22: Middle East & Africa Blood Bank Information System Revenue (million), by Type 2025 & 2033
- Figure 23: Middle East & Africa Blood Bank Information System Revenue Share (%), by Type 2025 & 2033
- Figure 24: Middle East & Africa Blood Bank Information System Revenue (million), by Country 2025 & 2033
- Figure 25: Middle East & Africa Blood Bank Information System Revenue Share (%), by Country 2025 & 2033
- Figure 26: Asia Pacific Blood Bank Information System Revenue (million), by Application 2025 & 2033
- Figure 27: Asia Pacific Blood Bank Information System Revenue Share (%), by Application 2025 & 2033
- Figure 28: Asia Pacific Blood Bank Information System Revenue (million), by Type 2025 & 2033
- Figure 29: Asia Pacific Blood Bank Information System Revenue Share (%), by Type 2025 & 2033
- Figure 30: Asia Pacific Blood Bank Information System Revenue (million), by Country 2025 & 2033
- Figure 31: Asia Pacific Blood Bank Information System Revenue Share (%), by Country 2025 & 2033
List of Tables
- Table 1: Global Blood Bank Information System Revenue million Forecast, by Application 2020 & 2033
- Table 2: Global Blood Bank Information System Revenue million Forecast, by Type 2020 & 2033
- Table 3: Global Blood Bank Information System Revenue million Forecast, by Region 2020 & 2033
- Table 4: Global Blood Bank Information System Revenue million Forecast, by Application 2020 & 2033
- Table 5: Global Blood Bank Information System Revenue million Forecast, by Type 2020 & 2033
- Table 6: Global Blood Bank Information System Revenue million Forecast, by Country 2020 & 2033
- Table 7: United States Blood Bank Information System Revenue (million) Forecast, by Application 2020 & 2033
- Table 8: Canada Blood Bank Information System Revenue (million) Forecast, by Application 2020 & 2033
- Table 9: Mexico Blood Bank Information System Revenue (million) Forecast, by Application 2020 & 2033
- Table 10: Global Blood Bank Information System Revenue million Forecast, by Application 2020 & 2033
- Table 11: Global Blood Bank Information System Revenue million Forecast, by Type 2020 & 2033
- Table 12: Global Blood Bank Information System Revenue million Forecast, by Country 2020 & 2033
- Table 13: Brazil Blood Bank Information System Revenue (million) Forecast, by Application 2020 & 2033
- Table 14: Argentina Blood Bank Information System Revenue (million) Forecast, by Application 2020 & 2033
- Table 15: Rest of South America Blood Bank Information System Revenue (million) Forecast, by Application 2020 & 2033
- Table 16: Global Blood Bank Information System Revenue million Forecast, by Application 2020 & 2033
- Table 17: Global Blood Bank Information System Revenue million Forecast, by Type 2020 & 2033
- Table 18: Global Blood Bank Information System Revenue million Forecast, by Country 2020 & 2033
- Table 19: United Kingdom Blood Bank Information System Revenue (million) Forecast, by Application 2020 & 2033
- Table 20: Germany Blood Bank Information System Revenue (million) Forecast, by Application 2020 & 2033
- Table 21: France Blood Bank Information System Revenue (million) Forecast, by Application 2020 & 2033
- Table 22: Italy Blood Bank Information System Revenue (million) Forecast, by Application 2020 & 2033
- Table 23: Spain Blood Bank Information System Revenue (million) Forecast, by Application 2020 & 2033
- Table 24: Russia Blood Bank Information System Revenue (million) Forecast, by Application 2020 & 2033
- Table 25: Benelux Blood Bank Information System Revenue (million) Forecast, by Application 2020 & 2033
- Table 26: Nordics Blood Bank Information System Revenue (million) Forecast, by Application 2020 & 2033
- Table 27: Rest of Europe Blood Bank Information System Revenue (million) Forecast, by Application 2020 & 2033
- Table 28: Global Blood Bank Information System Revenue million Forecast, by Application 2020 & 2033
- Table 29: Global Blood Bank Information System Revenue million Forecast, by Type 2020 & 2033
- Table 30: Global Blood Bank Information System Revenue million Forecast, by Country 2020 & 2033
- Table 31: Turkey Blood Bank Information System Revenue (million) Forecast, by Application 2020 & 2033
- Table 32: Israel Blood Bank Information System Revenue (million) Forecast, by Application 2020 & 2033
- Table 33: GCC Blood Bank Information System Revenue (million) Forecast, by Application 2020 & 2033
- Table 34: North Africa Blood Bank Information System Revenue (million) Forecast, by Application 2020 & 2033
- Table 35: South Africa Blood Bank Information System Revenue (million) Forecast, by Application 2020 & 2033
- Table 36: Rest of Middle East & Africa Blood Bank Information System Revenue (million) Forecast, by Application 2020 & 2033
- Table 37: Global Blood Bank Information System Revenue million Forecast, by Application 2020 & 2033
- Table 38: Global Blood Bank Information System Revenue million Forecast, by Type 2020 & 2033
- Table 39: Global Blood Bank Information System Revenue million Forecast, by Country 2020 & 2033
- Table 40: China Blood Bank Information System Revenue (million) Forecast, by Application 2020 & 2033
- Table 41: India Blood Bank Information System Revenue (million) Forecast, by Application 2020 & 2033
- Table 42: Japan Blood Bank Information System Revenue (million) Forecast, by Application 2020 & 2033
- Table 43: South Korea Blood Bank Information System Revenue (million) Forecast, by Application 2020 & 2033
- Table 44: ASEAN Blood Bank Information System Revenue (million) Forecast, by Application 2020 & 2033
- Table 45: Oceania Blood Bank Information System Revenue (million) Forecast, by Application 2020 & 2033
- Table 46: Rest of Asia Pacific Blood Bank Information System Revenue (million) Forecast, by Application 2020 & 2033
Frequently Asked Questions
1. What is the projected Compound Annual Growth Rate (CAGR) of the Blood Bank Information System?
The projected CAGR is approximately 6.5%.
2. Which companies are prominent players in the Blood Bank Information System?
Key companies in the market include Roper Industries, Haemonetics, Cerner Corporation, McKesson, Mak-System, Integrated Medical Systems, Mediware, Compugroup, SCC Soft Computer, Zhongde Gaoye, Blood Bank Computer Systems, Jinfeng Yitong, Fengde, IT Synergistics, Psyche Systems, Clinisys.
3. What are the main segments of the Blood Bank Information System?
The market segments include Application, Type.
4. Can you provide details about the market size?
The market size is estimated to be USD 723 million as of 2022.
5. What are some drivers contributing to market growth?
N/A
6. What are the notable trends driving market growth?
N/A
7. Are there any restraints impacting market growth?
N/A
8. Can you provide examples of recent developments in the market?
N/A
9. What pricing options are available for accessing the report?
Pricing options include single-user, multi-user, and enterprise licenses priced at USD 3950.00, USD 5925.00, and USD 7900.00 respectively.
10. Is the market size provided in terms of value or volume?
The market size is provided in terms of value, measured in million.
11. Are there any specific market keywords associated with the report?
Yes, the market keyword associated with the report is "Blood Bank Information System," which aids in identifying and referencing the specific market segment covered.
12. How do I determine which pricing option suits my needs best?
The pricing options vary based on user requirements and access needs. Individual users may opt for single-user licenses, while businesses requiring broader access may choose multi-user or enterprise licenses for cost-effective access to the report.
13. Are there any additional resources or data provided in the Blood Bank Information System report?
While the report offers comprehensive insights, it's advisable to review the specific contents or supplementary materials provided to ascertain if additional resources or data are available.
14. How can I stay updated on further developments or reports in the Blood Bank Information System?
To stay informed about further developments, trends, and reports in the Blood Bank Information System, consider subscribing to industry newsletters, following relevant companies and organizations, or regularly checking reputable industry news sources and publications.
Methodology
Step 1 - Identification of Relevant Samples Size from Population Database


Step 2 - Approaches for Defining Global Market Size (Value, Volume* & Price*)

Note*: In applicable scenarios
Step 3 - Data Sources
Primary Research
- Web Analytics
- Survey Reports
- Research Institute
- Latest Research Reports
- Opinion Leaders
Secondary Research
- Annual Reports
- White Paper
- Latest Press Release
- Industry Association
- Paid Database
- Investor Presentations

Step 4 - Data Triangulation
Involves using different sources of information in order to increase the validity of a study
These sources are likely to be stakeholders in a program - participants, other researchers, program staff, other community members, and so on.
Then we put all data in single framework & apply various statistical tools to find out the dynamic on the market.
During the analysis stage, feedback from the stakeholder groups would be compared to determine areas of agreement as well as areas of divergence