

Key Insights
The global Biolayer Interferometry (BLI) market is poised for significant expansion, driven by its indispensable role in drug discovery, diagnostics, and fundamental scientific research. The market is projected to reach a substantial $668 million by 2025, exhibiting a robust Compound Annual Growth Rate (CAGR) of 9.4% over the forecast period of 2025-2033. This impressive growth is fueled by the increasing demand for high-throughput screening capabilities, the burgeoning biopharmaceutical industry, and the continuous advancements in BLI instrumentation offering enhanced sensitivity and specificity. The pharmaceutical industry stands out as a primary application, leveraging BLI for crucial tasks such as affinity and kinetic analysis, drug and antibody screening, and discovery. Furthermore, the growing need for accurate protein quantification and the expanding applications in diagnostics and biotechnology are key accelerators for market penetration.
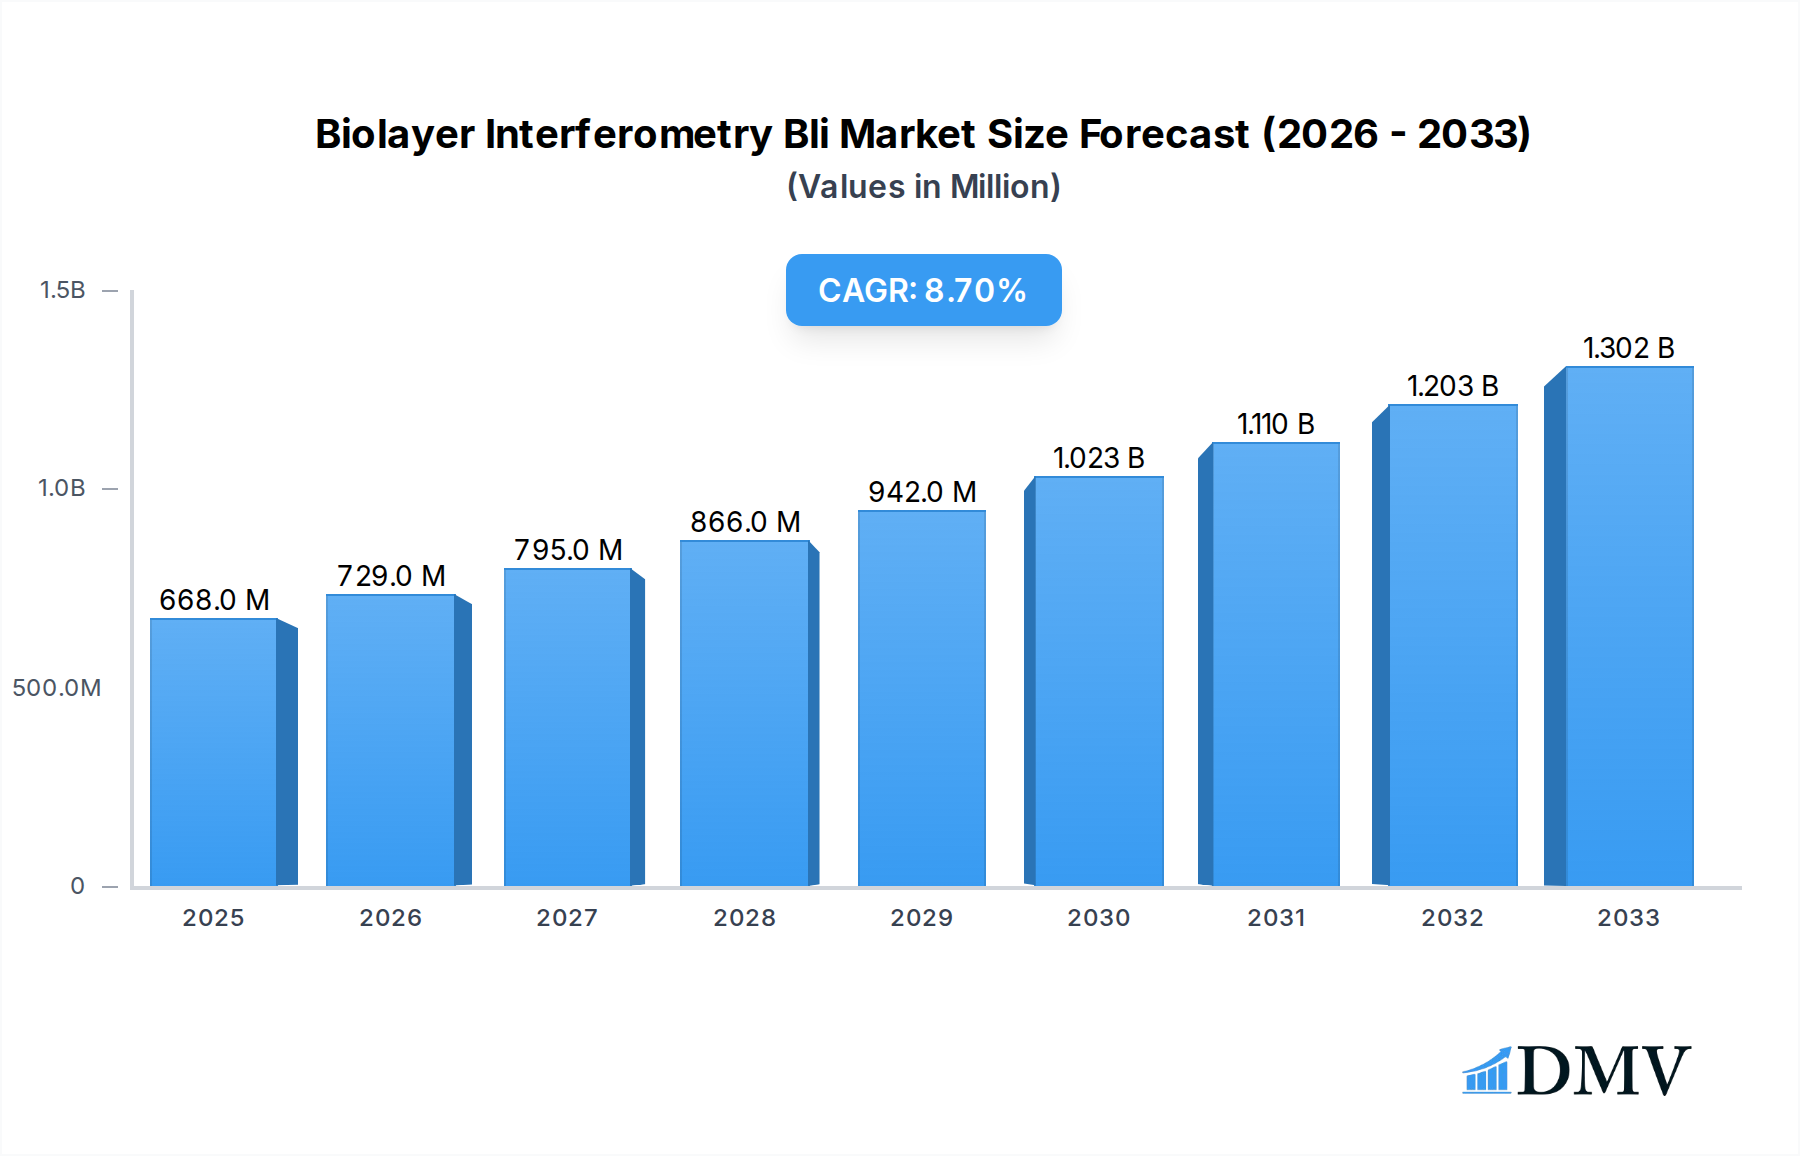
Biolayer Interferometry Bli Market Size (In Million)
Several underlying trends are shaping the trajectory of the BLI market. The rise of precision medicine and personalized therapies necessitates sophisticated tools for molecular interaction analysis, a domain where BLI excels. Innovations in reagent development and assay design are further broadening the scope of BLI applications. While the market presents immense opportunities, certain restraints may influence its growth. The initial cost of sophisticated BLI instruments and the requirement for specialized technical expertise for operation and data interpretation can pose challenges for smaller research institutions and companies. However, the undeniable benefits of label-free detection, real-time monitoring, and versatile application in studying biomolecular interactions are expected to outweigh these limitations, ensuring sustained market growth and wider adoption across various scientific disciplines.

Biolayer Interferometry Bli Company Market Share
Biolayer Interferometry Bli Market Composition & Trends
The global Biolayer Interferometry (BLI) market is characterized by a moderately concentrated competitive landscape, with a notable presence of key players driving innovation and market share. The innovation catalysts in this sector are largely centered around enhancing assay sensitivity, throughput, and the development of novel applications for BLI technology across various life science disciplines. Regulatory landscapes are generally supportive, particularly in the pharmaceutical and diagnostic sectors, where rigorous validation and approval processes indirectly fuel demand for precise analytical tools like BLI. Substitute products, while present in the form of other label-free detection techniques, often lack the specific advantages of BLI, such as real-time kinetic measurements and amenability to automation. End-user profiles are diverse, spanning academic institutions, pharmaceutical giants, and burgeoning biotechnology firms, all seeking to accelerate their research and development pipelines. Merger and acquisition (M&A) activities, though not at an exceptionally high volume, have been strategic, aimed at consolidating market position, acquiring complementary technologies, or expanding geographical reach. For instance, M&A deal values in the past two years have ranged from xx million to xx million, reflecting the strategic importance of BLI platforms. Market share distribution is dynamic, with established players holding significant portions while emerging companies are carving out niches through specialized offerings. The market is poised for further evolution as the intrinsic value of BLI in understanding molecular interactions becomes increasingly recognized.
- Market Share Distribution: Key players collectively hold approximately 70% of the market, with significant individual shares held by companies such as Ichor Life Sciences, Inc and Creative BioMart.
- Innovation Catalysts: Advancements in sensor technology, software integration, and multiplexing capabilities are primary drivers of innovation.
- Regulatory Impact: Favorable regulatory environments in diagnostics and pharmaceuticals are indirectly boosting BLI adoption.
- End-User Segmentation: Academic research constitutes around 35% of BLI usage, followed by the pharmaceutical industry at 30%, and diagnostics at 20%.
- M&A Activities: Strategic acquisitions by larger entities to integrate BLI capabilities into broader platforms have occurred, with estimated deal values in the past two years ranging from xx million to xx million.
Biolayer Interferometry Bli Industry Evolution
The Biolayer Interferometry (BLI) industry has witnessed a significant evolutionary trajectory from its inception, marked by consistent technological advancements and expanding application horizons. The historical period from 2019 to 2024 saw a steady increase in the adoption of BLI platforms, driven by their inherent advantages in label-free, real-time molecular interaction analysis. During this phase, advancements focused on enhancing sensitivity, reducing assay times, and improving the user-friendliness of BLI systems. The base year of 2025 marks a pivotal point, with the market demonstrating robust growth fueled by escalating research and development investments in the pharmaceutical and biotechnology sectors. The market has transitioned from being a niche analytical tool to an indispensable component in drug discovery and development workflows. Technological advancements have been particularly impactful, with the introduction of higher-throughput systems and more sophisticated software for data analysis, enabling researchers to gain deeper insights into protein-protein interactions, antibody-antigen binding kinetics, and small molecule target engagement. The estimated growth rate for the BLI market in 2025 is projected at xx%, reflecting this sustained momentum.
Consumer demand has also shifted, with a greater emphasis on cost-effectiveness, reliability, and the ability to perform complex assays with minimal sample input. This has spurred innovation in microfluidics and miniaturization of BLI devices. The forecast period from 2025 to 2033 anticipates an even more accelerated growth trajectory, driven by the expanding applications of BLI in personalized medicine, diagnostics for infectious diseases, and the burgeoning field of biologics. Adoption metrics indicate a significant rise in BLI usage in academic research, with over xx% of research institutions now employing BLI for various molecular interaction studies. In the commercial sector, particularly within pharmaceutical R&D, the adoption rate has reached approximately xx%, underscoring its critical role in early-stage drug discovery. The evolution of BLI technology, from its initial iterations to the sophisticated, automated platforms available today, exemplifies a successful response to the evolving needs of the scientific community, solidifying its position as a cornerstone technology for understanding complex biological systems.
Leading Regions, Countries, or Segments in Biolayer Interferometry Bli
The global Biolayer Interferometry (BLI) market demonstrates clear leadership within specific regions and application segments, driven by a confluence of factors including robust scientific infrastructure, significant R&D investments, and supportive regulatory frameworks. North America, particularly the United States, stands out as a dominant region, largely due to its extensive network of leading pharmaceutical companies, cutting-edge research institutions, and substantial government funding for scientific endeavors. The presence of major players like Ichor Life Sciences, Inc and BPS Bioscience, Inc, coupled with a high concentration of academic centers at the forefront of biological research, solidifies North America's leadership position.
Within the Application segment, the Pharmaceutical Industry consistently emerges as the primary driver of BLI market growth. This dominance is attributed to the indispensable role of BLI in drug discovery and development pipelines, from target validation and lead optimization to characterization of antibody-drug conjugates and small molecule inhibitors. The need for precise, label-free kinetic and affinity data to accelerate the identification and validation of drug candidates fuels significant demand. Following closely is the Biotechnology sector, where BLI is crucial for understanding protein-protein interactions, enzyme kinetics, and the development of novel biotherapeutics. Diagnostics also represents a rapidly growing application, with BLI being leveraged for the development of sensitive and specific diagnostic assays, particularly for infectious diseases and biomarkers. Scientific Research remains a foundational segment, with academic institutions worldwide utilizing BLI to explore fundamental biological questions, unravel complex molecular pathways, and advance our understanding of disease mechanisms.
In terms of Type, Affinity and Kinetic Analysis is the most prominent category, directly reflecting the core capabilities of BLI technology. This encompasses the detailed characterization of binding events, providing crucial parameters such as binding affinity (KD), association rates (kon), and dissociation rates (koff). These metrics are vital for evaluating drug-target interactions and antibody efficacy. Drug and Antibody Screening and Drug and Antibody Discovery are closely related and highly significant segments, as BLI enables high-throughput screening of compound libraries and the rapid identification and validation of promising drug candidates and therapeutic antibodies. Protein Quantification also plays a role, although it is often an ancillary application compared to kinetic and affinity analysis.
- Dominant Region: North America, driven by the USA's strong pharmaceutical and biotechnology ecosystem.
- Key Drivers: High R&D expenditure by pharmaceutical giants, extensive academic research infrastructure, significant venture capital funding for biotech startups, and a favorable intellectual property landscape.
- Dominant Application Segment: Pharmaceutical Industry.
- Key Drivers: Essential for drug discovery and development, target validation, lead optimization, and biotherapeutic characterization. Demand is driven by the high cost and complexity of bringing new drugs to market.
- Dominant Type: Affinity and Kinetic Analysis.
- Key Drivers: Provides critical real-time, label-free insights into molecular interactions, essential for understanding binding kinetics and affinity.
- Emerging Segments: Diagnostics (rapidly growing for assay development), Biotechnology (biologics development and protein engineering).
- Investment Trends: Continued strong investment in life sciences R&D globally, with a focus on precision medicine and novel therapeutics, directly translating to increased BLI adoption.
- Regulatory Support: Evolving regulatory requirements for drug efficacy and safety necessitate precise analytical tools, favoring BLI's capabilities.
Biolayer Interferometry Bli Product Innovations
Recent product innovations in Biolayer Interferometry (BLI) have significantly expanded its capabilities and accessibility. Advancements in sensor chip technology have led to increased sensitivity and reduced non-specific binding, enabling the detection of weaker interactions and lower concentrations of analytes. High-throughput BLI platforms now offer enhanced automation and multiplexing capabilities, allowing for simultaneous analysis of hundreds of samples, dramatically accelerating screening processes in drug discovery. Furthermore, software enhancements have introduced more sophisticated data analysis algorithms, enabling deeper kinetic profiling and more accurate determination of binding parameters. These innovations are crucial for applications such as antibody characterization, where precise affinity and kinetic data are paramount for selecting optimal therapeutic candidates. The integration of BLI with other analytical techniques is also a growing trend, offering researchers a more comprehensive understanding of molecular interactions.
Propelling Factors for Biolayer Interferometry Bli Growth
The Biolayer Interferometry (BLI) market is propelled by several key factors, underpinning its sustained growth. Technologically, the increasing demand for label-free, real-time analysis of molecular interactions in drug discovery and development is paramount. This inherent advantage of BLI over traditional methods, which often require labeling and are less time-efficient, fuels its adoption. Economically, the escalating R&D investments by pharmaceutical and biotechnology companies worldwide, driven by the need to bring novel therapeutics to market faster and more cost-effectively, directly translates to increased demand for advanced analytical instrumentation like BLI. Regulatory bodies' emphasis on robust data for drug approval also necessitates precise and reliable interaction analysis, favoring BLI's capabilities. The expanding pipeline of biologics and the growing interest in personalized medicine further contribute to the market's expansion, as BLI is crucial for characterizing these complex biomolecules and their interactions.
- Technological Advancements: Continuous improvements in sensor sensitivity, throughput, and automation.
- R&D Investment: Growing expenditure in pharmaceutical and biotechnology sectors for novel drug discovery.
- Regulatory Demands: Stringent requirements for data accuracy and reliability in drug development.
- Biologics Market Growth: Increased development of protein-based therapeutics and vaccines.
- Personalized Medicine: Demand for precise molecular interaction analysis for tailored treatments.
Obstacles in the Biolayer Interferometry Bli Market
Despite its robust growth, the Biolayer Interferometry (BLI) market faces certain obstacles that can temper its expansion. High initial capital expenditure for advanced BLI systems can be a significant barrier for smaller research institutions and emerging biotech companies with limited budgets. While BLI offers label-free analysis, the cost of specialized sensor chips can accumulate, impacting overall experimental economics, especially for high-throughput screening. Furthermore, the competitive landscape, with several established players and emerging technologies, can lead to pricing pressures and market fragmentation. Supply chain disruptions for critical components and reagents, particularly in times of global instability, can also impact manufacturing and availability. Lastly, the need for skilled personnel to operate and interpret data from sophisticated BLI instruments can pose a challenge, requiring ongoing training and expertise development within research organizations.
- High Initial Investment: The substantial cost of BLI instrumentation can deter smaller organizations.
- Sensor Chip Costs: Recurring expenses for consumables can impact long-term cost-effectiveness.
- Competitive Pressures: Intense market competition can lead to price sensitivity.
- Supply Chain Vulnerabilities: Potential disruptions in the availability of key components and reagents.
- Skilled Workforce Requirement: The necessity for trained personnel for operation and data interpretation.
Future Opportunities in Biolayer Interferometry Bli
The Biolayer Interferometry (BLI) market is poised for significant future opportunities driven by several emerging trends. The expansion of BLI applications into the field of cell-based assays and the integration of BLI with single-cell analysis techniques represent a vast untapped potential. The growing emphasis on diagnostics for emerging infectious diseases and chronic conditions will likely spur the development of highly sensitive and rapid BLI-based diagnostic platforms. Furthermore, the burgeoning field of microbiome research and the study of complex multi-protein complexes present new avenues for BLI utilization. Technological advancements in AI-driven data analysis for BLI, enabling predictive modeling of molecular interactions, will also unlock new opportunities for accelerated discovery. The increasing demand for point-of-care diagnostics and portable BLI devices could also open up new market segments.
- Cell-Based Assay Integration: Expanding BLI to analyze interactions within living cells.
- Advanced Diagnostics: Development of rapid, sensitive BLI assays for various diseases.
- Microbiome Research: Application in understanding complex microbial interactions.
- AI-Driven Data Analysis: Predictive modeling and enhanced interpretation of BLI data.
- Point-of-Care Devices: Development of portable BLI instruments for decentralized testing.
Major Players in the Biolayer Interferometry Bli Ecosystem
The Biolayer Interferometry (BLI) market ecosystem is shaped by a number of leading companies that are instrumental in driving innovation and providing essential tools and services. These organizations are at the forefront of developing and supplying BLI instrumentation, consumables, and related software solutions. Their contributions are vital for the advancement of research and development across various life science disciplines.
- Ichor Life Sciences, Inc
- Creative BioMart
- GenScript
- ROCKLAND IMMUNOCHEMICALS, INC
- BPS Bioscience, Inc
- Creative Proteomics
- Creative Biostructure
- Profacgen
- Creative Biolabs
- Biocult
- KMD Bioscience Co., Ltd
Key Developments in Biolayer Interferometry Bli Industry
The Biolayer Interferometry (BLI) industry has experienced several pivotal developments that have significantly shaped its trajectory and market dynamics. These advancements highlight the continuous innovation and strategic moves by key players in the ecosystem.
- 2023: Introduction of next-generation BLI sensors with significantly enhanced sensitivity and reduced background noise by leading manufacturers, enabling detection of even weaker molecular interactions.
- 2023: Expansion of software capabilities for BLI systems, integrating AI-driven algorithms for advanced kinetic modeling and predictive analysis of drug-target binding.
- 2022: Strategic partnerships formed between BLI instrument providers and major pharmaceutical companies to accelerate drug discovery pipelines, involving significant R&D collaborations.
- 2022: Launch of high-throughput, automated BLI platforms capable of analyzing hundreds of samples per day, significantly improving efficiency in compound screening.
- 2021: Increased focus on developing BLI applications for the characterization of bispecific antibodies and antibody-drug conjugates (ADCs), critical for the growing biotherapeutics market.
- 2020: Release of novel BLI sensor chips optimized for specific challenging analytes and complex buffer conditions, enhancing assay robustness.
- 2019: Emergence of integrated BLI solutions that combine real-time kinetic data with other orthogonal detection methods, offering a more comprehensive understanding of molecular interactions.
Strategic Biolayer Interferometry Bli Market Forecast
The strategic outlook for the Biolayer Interferometry (BLI) market remains highly promising, driven by an confluence of sustained technological innovation and an ever-increasing demand for precise molecular interaction analysis. The forecast period anticipates robust growth fueled by the expanding applications in drug discovery, diagnostics, and biotechnology. Opportunities arising from advancements in cell-based BLI assays and the integration with artificial intelligence for data interpretation will further accelerate market penetration. The increasing focus on biologics and personalized medicine will necessitate sophisticated analytical tools like BLI, ensuring a steady demand for advanced instrumentation and consumables. Strategic partnerships and focused R&D by key players will continue to drive market expansion, solidifying BLI's position as an indispensable technology in the life sciences.
Biolayer Interferometry Bli Segmentation
-
1. Application
- 1.1. Pharmaceutical Industry
- 1.2. Diagnostics
- 1.3. Biotechnology
- 1.4. Scientific Research
- 1.5. Others
-
2. Type
- 2.1. Affinity and Kinetic Analysis
- 2.2. Drug and Antibody Screening
- 2.3. Drug and Antibody Discovery
- 2.4. Protein Quantification
- 2.5. Others
Biolayer Interferometry Bli Segmentation By Geography
-
1. North America
- 1.1. United States
- 1.2. Canada
- 1.3. Mexico
-
2. South America
- 2.1. Brazil
- 2.2. Argentina
- 2.3. Rest of South America
-
3. Europe
- 3.1. United Kingdom
- 3.2. Germany
- 3.3. France
- 3.4. Italy
- 3.5. Spain
- 3.6. Russia
- 3.7. Benelux
- 3.8. Nordics
- 3.9. Rest of Europe
-
4. Middle East & Africa
- 4.1. Turkey
- 4.2. Israel
- 4.3. GCC
- 4.4. North Africa
- 4.5. South Africa
- 4.6. Rest of Middle East & Africa
-
5. Asia Pacific
- 5.1. China
- 5.2. India
- 5.3. Japan
- 5.4. South Korea
- 5.5. ASEAN
- 5.6. Oceania
- 5.7. Rest of Asia Pacific
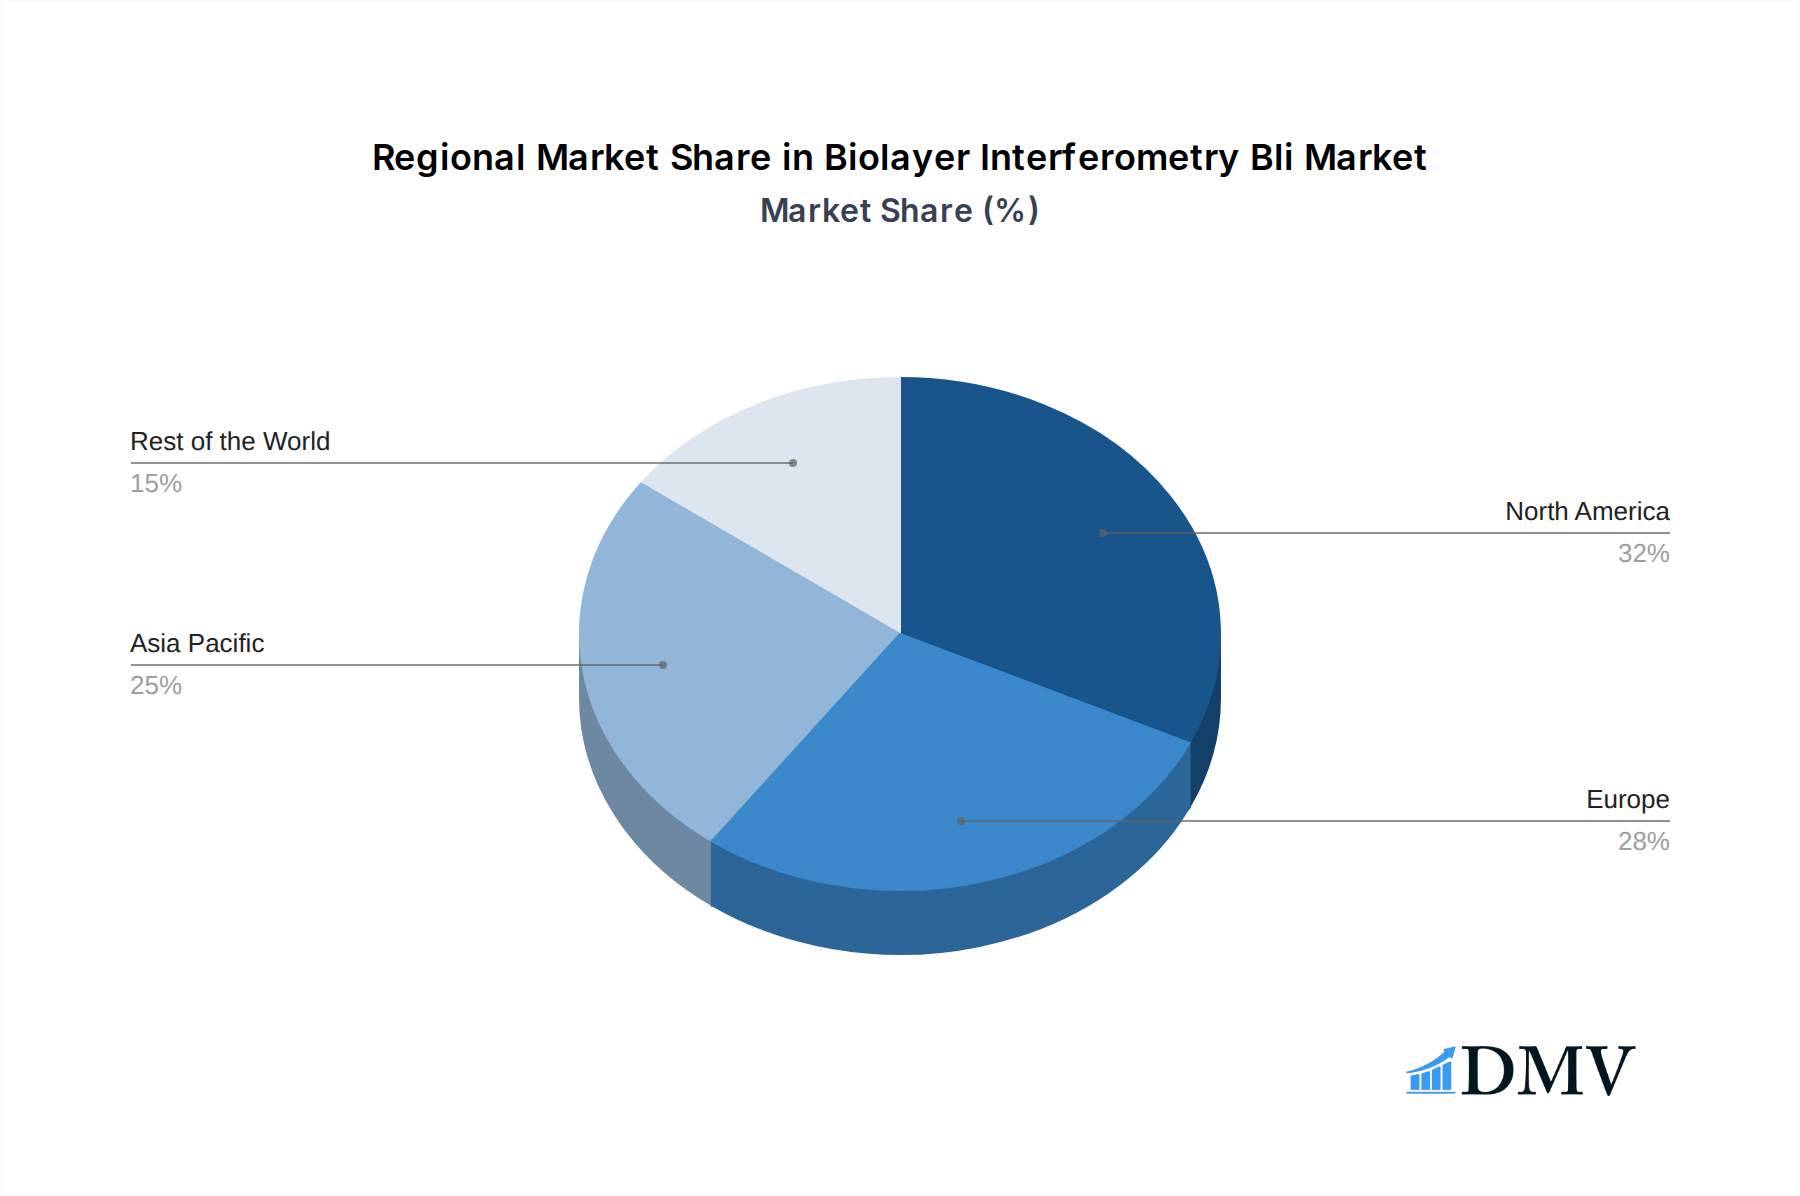
Biolayer Interferometry Bli Regional Market Share
Geographic Coverage of Biolayer Interferometry Bli
Biolayer Interferometry Bli REPORT HIGHLIGHTS
| Aspects | Details |
|---|---|
| Study Period | 2020-2034 |
| Base Year | 2025 |
| Estimated Year | 2026 |
| Forecast Period | 2026-2034 |
| Historical Period | 2020-2025 |
| Growth Rate | CAGR of 9.4% from 2020-2034 |
| Segmentation |
|
Table of Contents
- 1. Introduction
- 1.1. Research Scope
- 1.2. Market Segmentation
- 1.3. Research Methodology
- 1.4. Definitions and Assumptions
- 2. Executive Summary
- 2.1. Introduction
- 3. Market Dynamics
- 3.1. Introduction
- 3.2. Market Drivers
- 3.3. Market Restrains
- 3.4. Market Trends
- 4. Market Factor Analysis
- 4.1. Porters Five Forces
- 4.2. Supply/Value Chain
- 4.3. PESTEL analysis
- 4.4. Market Entropy
- 4.5. Patent/Trademark Analysis
- 5. Global Biolayer Interferometry Bli Analysis, Insights and Forecast, 2020-2032
- 5.1. Market Analysis, Insights and Forecast - by Application
- 5.1.1. Pharmaceutical Industry
- 5.1.2. Diagnostics
- 5.1.3. Biotechnology
- 5.1.4. Scientific Research
- 5.1.5. Others
- 5.2. Market Analysis, Insights and Forecast - by Type
- 5.2.1. Affinity and Kinetic Analysis
- 5.2.2. Drug and Antibody Screening
- 5.2.3. Drug and Antibody Discovery
- 5.2.4. Protein Quantification
- 5.2.5. Others
- 5.3. Market Analysis, Insights and Forecast - by Region
- 5.3.1. North America
- 5.3.2. South America
- 5.3.3. Europe
- 5.3.4. Middle East & Africa
- 5.3.5. Asia Pacific
- 5.1. Market Analysis, Insights and Forecast - by Application
- 6. North America Biolayer Interferometry Bli Analysis, Insights and Forecast, 2020-2032
- 6.1. Market Analysis, Insights and Forecast - by Application
- 6.1.1. Pharmaceutical Industry
- 6.1.2. Diagnostics
- 6.1.3. Biotechnology
- 6.1.4. Scientific Research
- 6.1.5. Others
- 6.2. Market Analysis, Insights and Forecast - by Type
- 6.2.1. Affinity and Kinetic Analysis
- 6.2.2. Drug and Antibody Screening
- 6.2.3. Drug and Antibody Discovery
- 6.2.4. Protein Quantification
- 6.2.5. Others
- 6.1. Market Analysis, Insights and Forecast - by Application
- 7. South America Biolayer Interferometry Bli Analysis, Insights and Forecast, 2020-2032
- 7.1. Market Analysis, Insights and Forecast - by Application
- 7.1.1. Pharmaceutical Industry
- 7.1.2. Diagnostics
- 7.1.3. Biotechnology
- 7.1.4. Scientific Research
- 7.1.5. Others
- 7.2. Market Analysis, Insights and Forecast - by Type
- 7.2.1. Affinity and Kinetic Analysis
- 7.2.2. Drug and Antibody Screening
- 7.2.3. Drug and Antibody Discovery
- 7.2.4. Protein Quantification
- 7.2.5. Others
- 7.1. Market Analysis, Insights and Forecast - by Application
- 8. Europe Biolayer Interferometry Bli Analysis, Insights and Forecast, 2020-2032
- 8.1. Market Analysis, Insights and Forecast - by Application
- 8.1.1. Pharmaceutical Industry
- 8.1.2. Diagnostics
- 8.1.3. Biotechnology
- 8.1.4. Scientific Research
- 8.1.5. Others
- 8.2. Market Analysis, Insights and Forecast - by Type
- 8.2.1. Affinity and Kinetic Analysis
- 8.2.2. Drug and Antibody Screening
- 8.2.3. Drug and Antibody Discovery
- 8.2.4. Protein Quantification
- 8.2.5. Others
- 8.1. Market Analysis, Insights and Forecast - by Application
- 9. Middle East & Africa Biolayer Interferometry Bli Analysis, Insights and Forecast, 2020-2032
- 9.1. Market Analysis, Insights and Forecast - by Application
- 9.1.1. Pharmaceutical Industry
- 9.1.2. Diagnostics
- 9.1.3. Biotechnology
- 9.1.4. Scientific Research
- 9.1.5. Others
- 9.2. Market Analysis, Insights and Forecast - by Type
- 9.2.1. Affinity and Kinetic Analysis
- 9.2.2. Drug and Antibody Screening
- 9.2.3. Drug and Antibody Discovery
- 9.2.4. Protein Quantification
- 9.2.5. Others
- 9.1. Market Analysis, Insights and Forecast - by Application
- 10. Asia Pacific Biolayer Interferometry Bli Analysis, Insights and Forecast, 2020-2032
- 10.1. Market Analysis, Insights and Forecast - by Application
- 10.1.1. Pharmaceutical Industry
- 10.1.2. Diagnostics
- 10.1.3. Biotechnology
- 10.1.4. Scientific Research
- 10.1.5. Others
- 10.2. Market Analysis, Insights and Forecast - by Type
- 10.2.1. Affinity and Kinetic Analysis
- 10.2.2. Drug and Antibody Screening
- 10.2.3. Drug and Antibody Discovery
- 10.2.4. Protein Quantification
- 10.2.5. Others
- 10.1. Market Analysis, Insights and Forecast - by Application
- 11. Competitive Analysis
- 11.1. Global Market Share Analysis 2025
- 11.2. Company Profiles
- 11.2.1 Ichor Life Sciences Inc
- 11.2.1.1. Overview
- 11.2.1.2. Products
- 11.2.1.3. SWOT Analysis
- 11.2.1.4. Recent Developments
- 11.2.1.5. Financials (Based on Availability)
- 11.2.2 Creative BioMart
- 11.2.2.1. Overview
- 11.2.2.2. Products
- 11.2.2.3. SWOT Analysis
- 11.2.2.4. Recent Developments
- 11.2.2.5. Financials (Based on Availability)
- 11.2.3 GenScript
- 11.2.3.1. Overview
- 11.2.3.2. Products
- 11.2.3.3. SWOT Analysis
- 11.2.3.4. Recent Developments
- 11.2.3.5. Financials (Based on Availability)
- 11.2.4 ROCKLAND IMMUNOCHEMICALS INC
- 11.2.4.1. Overview
- 11.2.4.2. Products
- 11.2.4.3. SWOT Analysis
- 11.2.4.4. Recent Developments
- 11.2.4.5. Financials (Based on Availability)
- 11.2.5 BPS Bioscience Inc
- 11.2.5.1. Overview
- 11.2.5.2. Products
- 11.2.5.3. SWOT Analysis
- 11.2.5.4. Recent Developments
- 11.2.5.5. Financials (Based on Availability)
- 11.2.6 Creative Proteomics
- 11.2.6.1. Overview
- 11.2.6.2. Products
- 11.2.6.3. SWOT Analysis
- 11.2.6.4. Recent Developments
- 11.2.6.5. Financials (Based on Availability)
- 11.2.7 Creative Biostructure
- 11.2.7.1. Overview
- 11.2.7.2. Products
- 11.2.7.3. SWOT Analysis
- 11.2.7.4. Recent Developments
- 11.2.7.5. Financials (Based on Availability)
- 11.2.8 Profacgen
- 11.2.8.1. Overview
- 11.2.8.2. Products
- 11.2.8.3. SWOT Analysis
- 11.2.8.4. Recent Developments
- 11.2.8.5. Financials (Based on Availability)
- 11.2.9 Creative Biolabs
- 11.2.9.1. Overview
- 11.2.9.2. Products
- 11.2.9.3. SWOT Analysis
- 11.2.9.4. Recent Developments
- 11.2.9.5. Financials (Based on Availability)
- 11.2.10 Biocult
- 11.2.10.1. Overview
- 11.2.10.2. Products
- 11.2.10.3. SWOT Analysis
- 11.2.10.4. Recent Developments
- 11.2.10.5. Financials (Based on Availability)
- 11.2.11 KMD Bioscience Co. Ltd
- 11.2.11.1. Overview
- 11.2.11.2. Products
- 11.2.11.3. SWOT Analysis
- 11.2.11.4. Recent Developments
- 11.2.11.5. Financials (Based on Availability)
- 11.2.1 Ichor Life Sciences Inc
List of Figures
- Figure 1: Global Biolayer Interferometry Bli Revenue Breakdown (million, %) by Region 2025 & 2033
- Figure 2: North America Biolayer Interferometry Bli Revenue (million), by Application 2025 & 2033
- Figure 3: North America Biolayer Interferometry Bli Revenue Share (%), by Application 2025 & 2033
- Figure 4: North America Biolayer Interferometry Bli Revenue (million), by Type 2025 & 2033
- Figure 5: North America Biolayer Interferometry Bli Revenue Share (%), by Type 2025 & 2033
- Figure 6: North America Biolayer Interferometry Bli Revenue (million), by Country 2025 & 2033
- Figure 7: North America Biolayer Interferometry Bli Revenue Share (%), by Country 2025 & 2033
- Figure 8: South America Biolayer Interferometry Bli Revenue (million), by Application 2025 & 2033
- Figure 9: South America Biolayer Interferometry Bli Revenue Share (%), by Application 2025 & 2033
- Figure 10: South America Biolayer Interferometry Bli Revenue (million), by Type 2025 & 2033
- Figure 11: South America Biolayer Interferometry Bli Revenue Share (%), by Type 2025 & 2033
- Figure 12: South America Biolayer Interferometry Bli Revenue (million), by Country 2025 & 2033
- Figure 13: South America Biolayer Interferometry Bli Revenue Share (%), by Country 2025 & 2033
- Figure 14: Europe Biolayer Interferometry Bli Revenue (million), by Application 2025 & 2033
- Figure 15: Europe Biolayer Interferometry Bli Revenue Share (%), by Application 2025 & 2033
- Figure 16: Europe Biolayer Interferometry Bli Revenue (million), by Type 2025 & 2033
- Figure 17: Europe Biolayer Interferometry Bli Revenue Share (%), by Type 2025 & 2033
- Figure 18: Europe Biolayer Interferometry Bli Revenue (million), by Country 2025 & 2033
- Figure 19: Europe Biolayer Interferometry Bli Revenue Share (%), by Country 2025 & 2033
- Figure 20: Middle East & Africa Biolayer Interferometry Bli Revenue (million), by Application 2025 & 2033
- Figure 21: Middle East & Africa Biolayer Interferometry Bli Revenue Share (%), by Application 2025 & 2033
- Figure 22: Middle East & Africa Biolayer Interferometry Bli Revenue (million), by Type 2025 & 2033
- Figure 23: Middle East & Africa Biolayer Interferometry Bli Revenue Share (%), by Type 2025 & 2033
- Figure 24: Middle East & Africa Biolayer Interferometry Bli Revenue (million), by Country 2025 & 2033
- Figure 25: Middle East & Africa Biolayer Interferometry Bli Revenue Share (%), by Country 2025 & 2033
- Figure 26: Asia Pacific Biolayer Interferometry Bli Revenue (million), by Application 2025 & 2033
- Figure 27: Asia Pacific Biolayer Interferometry Bli Revenue Share (%), by Application 2025 & 2033
- Figure 28: Asia Pacific Biolayer Interferometry Bli Revenue (million), by Type 2025 & 2033
- Figure 29: Asia Pacific Biolayer Interferometry Bli Revenue Share (%), by Type 2025 & 2033
- Figure 30: Asia Pacific Biolayer Interferometry Bli Revenue (million), by Country 2025 & 2033
- Figure 31: Asia Pacific Biolayer Interferometry Bli Revenue Share (%), by Country 2025 & 2033
List of Tables
- Table 1: Global Biolayer Interferometry Bli Revenue million Forecast, by Application 2020 & 2033
- Table 2: Global Biolayer Interferometry Bli Revenue million Forecast, by Type 2020 & 2033
- Table 3: Global Biolayer Interferometry Bli Revenue million Forecast, by Region 2020 & 2033
- Table 4: Global Biolayer Interferometry Bli Revenue million Forecast, by Application 2020 & 2033
- Table 5: Global Biolayer Interferometry Bli Revenue million Forecast, by Type 2020 & 2033
- Table 6: Global Biolayer Interferometry Bli Revenue million Forecast, by Country 2020 & 2033
- Table 7: United States Biolayer Interferometry Bli Revenue (million) Forecast, by Application 2020 & 2033
- Table 8: Canada Biolayer Interferometry Bli Revenue (million) Forecast, by Application 2020 & 2033
- Table 9: Mexico Biolayer Interferometry Bli Revenue (million) Forecast, by Application 2020 & 2033
- Table 10: Global Biolayer Interferometry Bli Revenue million Forecast, by Application 2020 & 2033
- Table 11: Global Biolayer Interferometry Bli Revenue million Forecast, by Type 2020 & 2033
- Table 12: Global Biolayer Interferometry Bli Revenue million Forecast, by Country 2020 & 2033
- Table 13: Brazil Biolayer Interferometry Bli Revenue (million) Forecast, by Application 2020 & 2033
- Table 14: Argentina Biolayer Interferometry Bli Revenue (million) Forecast, by Application 2020 & 2033
- Table 15: Rest of South America Biolayer Interferometry Bli Revenue (million) Forecast, by Application 2020 & 2033
- Table 16: Global Biolayer Interferometry Bli Revenue million Forecast, by Application 2020 & 2033
- Table 17: Global Biolayer Interferometry Bli Revenue million Forecast, by Type 2020 & 2033
- Table 18: Global Biolayer Interferometry Bli Revenue million Forecast, by Country 2020 & 2033
- Table 19: United Kingdom Biolayer Interferometry Bli Revenue (million) Forecast, by Application 2020 & 2033
- Table 20: Germany Biolayer Interferometry Bli Revenue (million) Forecast, by Application 2020 & 2033
- Table 21: France Biolayer Interferometry Bli Revenue (million) Forecast, by Application 2020 & 2033
- Table 22: Italy Biolayer Interferometry Bli Revenue (million) Forecast, by Application 2020 & 2033
- Table 23: Spain Biolayer Interferometry Bli Revenue (million) Forecast, by Application 2020 & 2033
- Table 24: Russia Biolayer Interferometry Bli Revenue (million) Forecast, by Application 2020 & 2033
- Table 25: Benelux Biolayer Interferometry Bli Revenue (million) Forecast, by Application 2020 & 2033
- Table 26: Nordics Biolayer Interferometry Bli Revenue (million) Forecast, by Application 2020 & 2033
- Table 27: Rest of Europe Biolayer Interferometry Bli Revenue (million) Forecast, by Application 2020 & 2033
- Table 28: Global Biolayer Interferometry Bli Revenue million Forecast, by Application 2020 & 2033
- Table 29: Global Biolayer Interferometry Bli Revenue million Forecast, by Type 2020 & 2033
- Table 30: Global Biolayer Interferometry Bli Revenue million Forecast, by Country 2020 & 2033
- Table 31: Turkey Biolayer Interferometry Bli Revenue (million) Forecast, by Application 2020 & 2033
- Table 32: Israel Biolayer Interferometry Bli Revenue (million) Forecast, by Application 2020 & 2033
- Table 33: GCC Biolayer Interferometry Bli Revenue (million) Forecast, by Application 2020 & 2033
- Table 34: North Africa Biolayer Interferometry Bli Revenue (million) Forecast, by Application 2020 & 2033
- Table 35: South Africa Biolayer Interferometry Bli Revenue (million) Forecast, by Application 2020 & 2033
- Table 36: Rest of Middle East & Africa Biolayer Interferometry Bli Revenue (million) Forecast, by Application 2020 & 2033
- Table 37: Global Biolayer Interferometry Bli Revenue million Forecast, by Application 2020 & 2033
- Table 38: Global Biolayer Interferometry Bli Revenue million Forecast, by Type 2020 & 2033
- Table 39: Global Biolayer Interferometry Bli Revenue million Forecast, by Country 2020 & 2033
- Table 40: China Biolayer Interferometry Bli Revenue (million) Forecast, by Application 2020 & 2033
- Table 41: India Biolayer Interferometry Bli Revenue (million) Forecast, by Application 2020 & 2033
- Table 42: Japan Biolayer Interferometry Bli Revenue (million) Forecast, by Application 2020 & 2033
- Table 43: South Korea Biolayer Interferometry Bli Revenue (million) Forecast, by Application 2020 & 2033
- Table 44: ASEAN Biolayer Interferometry Bli Revenue (million) Forecast, by Application 2020 & 2033
- Table 45: Oceania Biolayer Interferometry Bli Revenue (million) Forecast, by Application 2020 & 2033
- Table 46: Rest of Asia Pacific Biolayer Interferometry Bli Revenue (million) Forecast, by Application 2020 & 2033
Frequently Asked Questions
1. What is the projected Compound Annual Growth Rate (CAGR) of the Biolayer Interferometry Bli?
The projected CAGR is approximately 9.4%.
2. Which companies are prominent players in the Biolayer Interferometry Bli?
Key companies in the market include Ichor Life Sciences, Inc, Creative BioMart, GenScript, ROCKLAND IMMUNOCHEMICALS, INC, BPS Bioscience, Inc, Creative Proteomics, Creative Biostructure, Profacgen, Creative Biolabs, Biocult, KMD Bioscience Co., Ltd.
3. What are the main segments of the Biolayer Interferometry Bli?
The market segments include Application, Type.
4. Can you provide details about the market size?
The market size is estimated to be USD 668 million as of 2022.
5. What are some drivers contributing to market growth?
N/A
6. What are the notable trends driving market growth?
N/A
7. Are there any restraints impacting market growth?
N/A
8. Can you provide examples of recent developments in the market?
N/A
9. What pricing options are available for accessing the report?
Pricing options include single-user, multi-user, and enterprise licenses priced at USD 3950.00, USD 5925.00, and USD 7900.00 respectively.
10. Is the market size provided in terms of value or volume?
The market size is provided in terms of value, measured in million.
11. Are there any specific market keywords associated with the report?
Yes, the market keyword associated with the report is "Biolayer Interferometry Bli," which aids in identifying and referencing the specific market segment covered.
12. How do I determine which pricing option suits my needs best?
The pricing options vary based on user requirements and access needs. Individual users may opt for single-user licenses, while businesses requiring broader access may choose multi-user or enterprise licenses for cost-effective access to the report.
13. Are there any additional resources or data provided in the Biolayer Interferometry Bli report?
While the report offers comprehensive insights, it's advisable to review the specific contents or supplementary materials provided to ascertain if additional resources or data are available.
14. How can I stay updated on further developments or reports in the Biolayer Interferometry Bli?
To stay informed about further developments, trends, and reports in the Biolayer Interferometry Bli, consider subscribing to industry newsletters, following relevant companies and organizations, or regularly checking reputable industry news sources and publications.
Methodology
Step 1 - Identification of Relevant Samples Size from Population Database


Step 2 - Approaches for Defining Global Market Size (Value, Volume* & Price*)

Note*: In applicable scenarios
Step 3 - Data Sources
Primary Research
- Web Analytics
- Survey Reports
- Research Institute
- Latest Research Reports
- Opinion Leaders
Secondary Research
- Annual Reports
- White Paper
- Latest Press Release
- Industry Association
- Paid Database
- Investor Presentations

Step 4 - Data Triangulation
Involves using different sources of information in order to increase the validity of a study
These sources are likely to be stakeholders in a program - participants, other researchers, program staff, other community members, and so on.
Then we put all data in single framework & apply various statistical tools to find out the dynamic on the market.
During the analysis stage, feedback from the stakeholder groups would be compared to determine areas of agreement as well as areas of divergence