

Key Insights
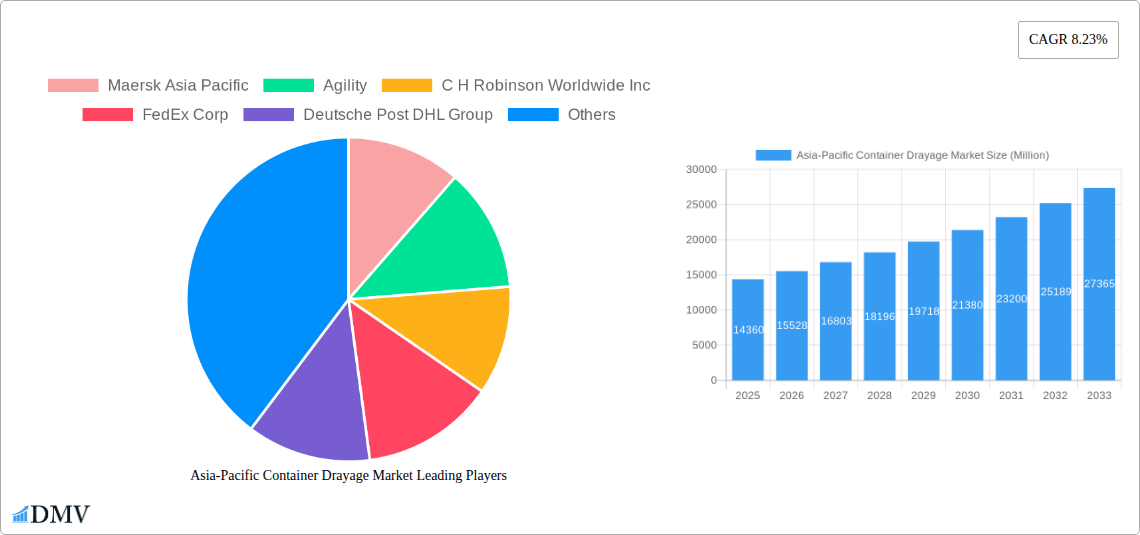
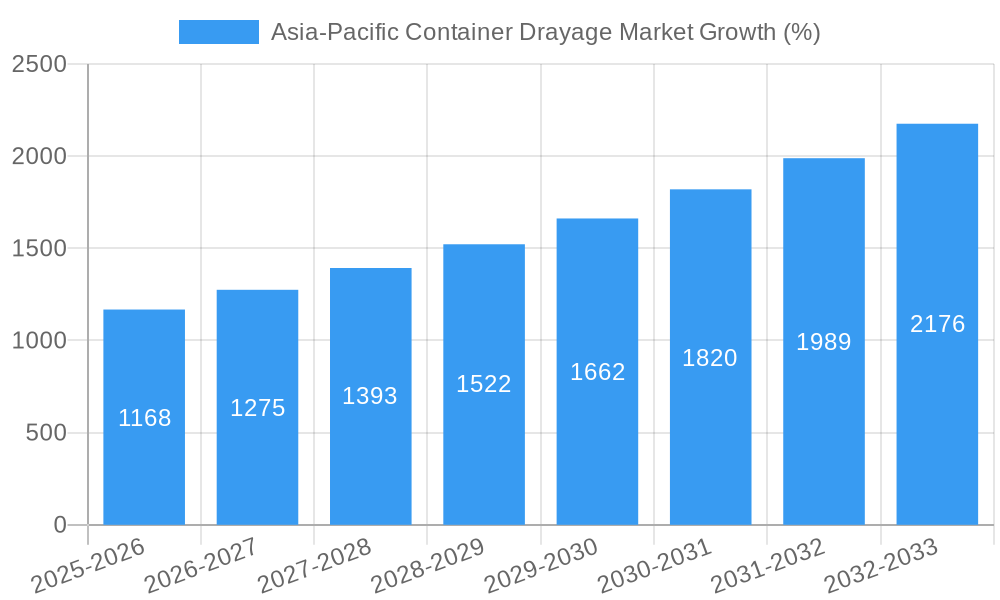
The Asia-Pacific container drayage market, valued at $14.36 billion in 2025, is projected to experience robust growth, driven by the region's expanding e-commerce sector, increasing port congestion, and a rising demand for efficient last-mile delivery solutions. The market's Compound Annual Growth Rate (CAGR) of 8.23% from 2025 to 2033 indicates a significant expansion opportunity. Key growth drivers include the continuous rise in containerized cargo volume, the need for faster and more reliable delivery times to meet consumer expectations, and the increasing adoption of technology-driven solutions like digital freight management platforms and real-time tracking systems within logistics operations. While challenges such as fluctuating fuel prices and driver shortages exist, the overall market outlook remains positive due to strong government initiatives promoting infrastructure development and trade facilitation across the region. The competitive landscape includes both large multinational logistics companies and regional players, fostering innovation and driving down costs. Segmentation analysis, while not provided in detail, would likely reveal significant variations across individual countries based on economic development, port infrastructure, and regulatory environments. The forecast period from 2025-2033 shows continued expansion driven by factors like the burgeoning manufacturing industries and increasing cross-border trade within and outside the Asia-Pacific region.
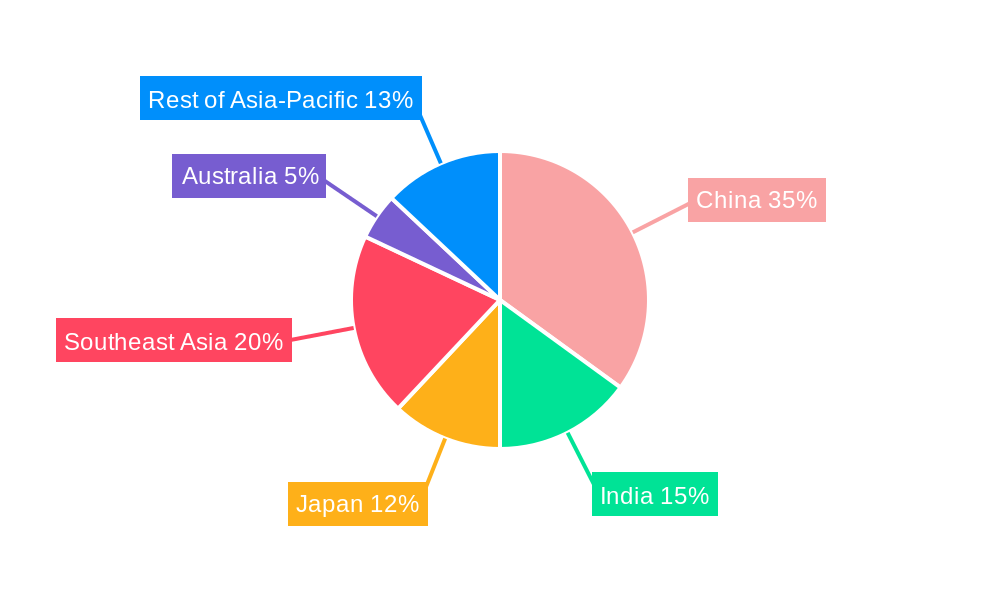
The continued growth of major economies such as China, India, and Japan will significantly fuel the market expansion. Furthermore, the growing adoption of intermodal transportation and the investment in improved infrastructure, including inland terminals and efficient road networks, will contribute to enhanced container drayage services. The emergence of sustainable and eco-friendly drayage solutions, driven by environmental concerns and government regulations, will also shape the market's trajectory in the coming years. Companies are likely to invest in fleet optimization strategies, technological advancements, and strategic partnerships to improve efficiency and gain a competitive edge. Market concentration will likely remain high due to the significant capital investment required and the economies of scale achievable by large operators. However, smaller niche players focusing on specialized services or specific geographic areas will also continue to find success.
Asia-Pacific Container Drayage Market: A Comprehensive Report (2019-2033)
This insightful report provides a detailed analysis of the Asia-Pacific container drayage market, offering a comprehensive overview of its current state, future trends, and growth potential. Spanning the period from 2019 to 2033, with a base year of 2025 and a forecast period of 2025-2033, this report is an invaluable resource for stakeholders seeking to understand and capitalize on the opportunities within this dynamic market. The market is projected to reach xx Million by 2033, showcasing significant growth potential.
Asia-Pacific Container Drayage Market Composition & Trends
This section delves into the intricate composition of the Asia-Pacific container drayage market, examining key aspects influencing its trajectory. We analyze market concentration, revealing the market share distribution among leading players such as Maersk Asia Pacific, Agility, C.H. Robinson Worldwide Inc, FedEx Corp, and others. The report also explores the impact of innovation, regulatory shifts, the presence of substitute products, and evolving end-user profiles. Furthermore, a detailed analysis of mergers and acquisitions (M&A) activities, including deal values and their implications for market dynamics, is presented.
- Market Concentration: Analysis of market share held by top 5 players, revealing a [xx]% combined market share in 2024.
- Innovation Catalysts: Examination of technological advancements driving efficiency and cost reductions in drayage operations.
- Regulatory Landscape: Assessment of the impact of regional regulations and their influence on market growth.
- Substitute Products: Evaluation of alternative transportation modes and their competitive pressures on the market.
- End-User Profiles: Detailed profiling of key industries and their specific drayage requirements.
- M&A Activities: Analysis of significant M&A deals in the historical period (2019-2024) with estimated deal values totaling xx Million.
Asia-Pacific Container Drayage Market Industry Evolution
This section provides a comprehensive analysis of the Asia-Pacific container drayage market’s evolution from 2019 to 2024, projecting trends through 2033. We examine the market's growth trajectories, pinpointing key periods of expansion and contraction. Technological advancements such as the integration of IoT devices, AI-powered route optimization, and autonomous trucking are analyzed for their impact on efficiency and cost-effectiveness. The report further explores the evolving demands of consumers and businesses, examining how these shifts influence drayage services and market segmentation. Specific data points, such as compound annual growth rates (CAGR) and adoption rates for new technologies, are included to provide a nuanced understanding of market evolution. The market is expected to witness a CAGR of xx% during the forecast period.
Leading Regions, Countries, or Segments in Asia-Pacific Container Drayage Market
This section identifies the dominant regions, countries, or segments within the Asia-Pacific container drayage market. A detailed analysis reveals the factors driving the dominance of these specific areas.
- Key Drivers (e.g., investment trends, regulatory support):
- Robust infrastructure development in [Specific Region/Country].
- Favorable government policies promoting logistics and trade.
- High concentration of manufacturing and export activities.
- In-depth Analysis of Dominance Factors: The report explores factors such as port capacity, proximity to major manufacturing hubs, and the availability of skilled labor as key determinants of regional dominance. [Specific Region/Country] emerges as the leading region/country due to [detailed explanation of reasons].
Asia-Pacific Container Drayage Market Product Innovations
This section details recent product innovations, their applications, and associated performance metrics within the Asia-Pacific container drayage market. The focus is on highlighting unique selling propositions (USPs) and the technological advancements that underpin these innovations. Examples include the introduction of specialized drayage equipment optimized for specific cargo types, the adoption of real-time tracking and monitoring systems, and the integration of advanced route optimization software. These innovations contribute to improved efficiency, reduced transit times, and enhanced supply chain visibility.
Propelling Factors for Asia-Pacific Container Drayage Market Growth
Several key factors are driving the growth of the Asia-Pacific container drayage market. Technological advancements such as the implementation of intelligent transportation systems (ITS) and the rise of e-commerce are significantly boosting efficiency and demand. Favorable economic conditions, including rising disposable incomes and increased consumer spending, further fuel market expansion. Supportive government policies and investments in infrastructure, including improved port facilities and road networks, are also crucial growth catalysts.
Obstacles in the Asia-Pacific Container Drayage Market
The Asia-Pacific container drayage market faces several challenges, including stringent regulatory compliance requirements that can increase operational costs. Supply chain disruptions, such as port congestion and labor shortages, can lead to delays and increased expenses. Intense competition among drayage providers puts downward pressure on pricing and profit margins. These factors, along with rising fuel costs, create significant obstacles for market players.
Future Opportunities in Asia-Pacific Container Drayage Market
The Asia-Pacific container drayage market presents several promising future opportunities. The expansion of e-commerce continues to drive demand for efficient last-mile delivery solutions. The increasing adoption of automation and artificial intelligence (AI) in logistics offers opportunities for improved operational efficiency and cost reduction. Moreover, exploring new markets and developing innovative service offerings can create significant growth potential for market players.
Major Players in the Asia-Pacific Container Drayage Market Ecosystem
- Maersk Asia Pacific
- Agility
- C.H. Robinson Worldwide Inc
- FedEx Corp
- Deutsche Post DHL Group
- Hitachi Ltd
- CMA CGM SA Group
- DB Schenker
- United Parcel Services Inc
- Ceva Logistics
- Yusen Logistics Co Ltd
- 63 Other Companies
Key Developments in Asia-Pacific Container Drayage Market Industry
- July 2024: DP World launched 51 new freight forwarding offices across the Asia-Pacific, expanding its reach in air and ocean freight. This significantly increases its market presence and capacity.
- February 2024: HERE Technologies partnered with PSA Singapore to enhance Singapore's container truck ecosystem, improving efficiency within the world's second busiest container port. This collaboration underscores the growing importance of technological advancements in optimizing drayage operations.
Strategic Asia-Pacific Container Drayage Market Forecast
The Asia-Pacific container drayage market is poised for sustained growth, driven by the region's robust economic expansion, burgeoning e-commerce sector, and ongoing investments in infrastructure development. The increasing adoption of technology and innovative logistics solutions will further propel market expansion. The market's potential is significant, with opportunities for both established players and new entrants to capitalize on evolving consumer demands and technological advancements.
Asia-Pacific Container Drayage Market Segmentation
-
1. Mode of Transport
- 1.1. Rail
- 1.2. Road
- 1.3. Other Modes of Transport
-
2. Geography
- 2.1. China
- 2.2. Japan
- 2.3. India
- 2.4. South Korea
- 2.5. Indonesia
- 2.6. Vietnam
- 2.7. Australia
- 2.8. Rest of Asia-Pacific
Asia-Pacific Container Drayage Market Segmentation By Geography
- 1. China
- 2. Japan
- 3. India
- 4. South Korea
- 5. Indonesia
- 6. Vietnam
- 7. Australia
- 8. Rest of Asia Pacific
Asia-Pacific Container Drayage Market REPORT HIGHLIGHTS
| Aspects | Details |
|---|---|
| Study Period | 2019-2033 |
| Base Year | 2024 |
| Estimated Year | 2025 |
| Forecast Period | 2025-2033 |
| Historical Period | 2019-2024 |
| Growth Rate | CAGR of 8.23% from 2019-2033 |
| Segmentation |
|
Table of Contents
- 1. Introduction
- 1.1. Research Scope
- 1.2. Market Segmentation
- 1.3. Research Methodology
- 1.4. Definitions and Assumptions
- 2. Executive Summary
- 2.1. Introduction
- 3. Market Dynamics
- 3.1. Introduction
- 3.2. Market Drivers
- 3.2.1. 4.; Increasing Railway Trade4.; Growing E-commerce Sector
- 3.3. Market Restrains
- 3.3.1. 4.; Increasing Railway Trade4.; Growing E-commerce Sector
- 3.4. Market Trends
- 3.4.1 Port Congestion Easing in Key Asian Hubs
- 3.4.2 Surge in Demand for Container Drayage Driving the Transportation Segment
- 4. Market Factor Analysis
- 4.1. Porters Five Forces
- 4.2. Supply/Value Chain
- 4.3. PESTEL analysis
- 4.4. Market Entropy
- 4.5. Patent/Trademark Analysis
- 5. Global Asia-Pacific Container Drayage Market Analysis, Insights and Forecast, 2019-2031
- 5.1. Market Analysis, Insights and Forecast - by Mode of Transport
- 5.1.1. Rail
- 5.1.2. Road
- 5.1.3. Other Modes of Transport
- 5.2. Market Analysis, Insights and Forecast - by Geography
- 5.2.1. China
- 5.2.2. Japan
- 5.2.3. India
- 5.2.4. South Korea
- 5.2.5. Indonesia
- 5.2.6. Vietnam
- 5.2.7. Australia
- 5.2.8. Rest of Asia-Pacific
- 5.3. Market Analysis, Insights and Forecast - by Region
- 5.3.1. China
- 5.3.2. Japan
- 5.3.3. India
- 5.3.4. South Korea
- 5.3.5. Indonesia
- 5.3.6. Vietnam
- 5.3.7. Australia
- 5.3.8. Rest of Asia Pacific
- 5.1. Market Analysis, Insights and Forecast - by Mode of Transport
- 6. China Asia-Pacific Container Drayage Market Analysis, Insights and Forecast, 2019-2031
- 6.1. Market Analysis, Insights and Forecast - by Mode of Transport
- 6.1.1. Rail
- 6.1.2. Road
- 6.1.3. Other Modes of Transport
- 6.2. Market Analysis, Insights and Forecast - by Geography
- 6.2.1. China
- 6.2.2. Japan
- 6.2.3. India
- 6.2.4. South Korea
- 6.2.5. Indonesia
- 6.2.6. Vietnam
- 6.2.7. Australia
- 6.2.8. Rest of Asia-Pacific
- 6.1. Market Analysis, Insights and Forecast - by Mode of Transport
- 7. Japan Asia-Pacific Container Drayage Market Analysis, Insights and Forecast, 2019-2031
- 7.1. Market Analysis, Insights and Forecast - by Mode of Transport
- 7.1.1. Rail
- 7.1.2. Road
- 7.1.3. Other Modes of Transport
- 7.2. Market Analysis, Insights and Forecast - by Geography
- 7.2.1. China
- 7.2.2. Japan
- 7.2.3. India
- 7.2.4. South Korea
- 7.2.5. Indonesia
- 7.2.6. Vietnam
- 7.2.7. Australia
- 7.2.8. Rest of Asia-Pacific
- 7.1. Market Analysis, Insights and Forecast - by Mode of Transport
- 8. India Asia-Pacific Container Drayage Market Analysis, Insights and Forecast, 2019-2031
- 8.1. Market Analysis, Insights and Forecast - by Mode of Transport
- 8.1.1. Rail
- 8.1.2. Road
- 8.1.3. Other Modes of Transport
- 8.2. Market Analysis, Insights and Forecast - by Geography
- 8.2.1. China
- 8.2.2. Japan
- 8.2.3. India
- 8.2.4. South Korea
- 8.2.5. Indonesia
- 8.2.6. Vietnam
- 8.2.7. Australia
- 8.2.8. Rest of Asia-Pacific
- 8.1. Market Analysis, Insights and Forecast - by Mode of Transport
- 9. South Korea Asia-Pacific Container Drayage Market Analysis, Insights and Forecast, 2019-2031
- 9.1. Market Analysis, Insights and Forecast - by Mode of Transport
- 9.1.1. Rail
- 9.1.2. Road
- 9.1.3. Other Modes of Transport
- 9.2. Market Analysis, Insights and Forecast - by Geography
- 9.2.1. China
- 9.2.2. Japan
- 9.2.3. India
- 9.2.4. South Korea
- 9.2.5. Indonesia
- 9.2.6. Vietnam
- 9.2.7. Australia
- 9.2.8. Rest of Asia-Pacific
- 9.1. Market Analysis, Insights and Forecast - by Mode of Transport
- 10. Indonesia Asia-Pacific Container Drayage Market Analysis, Insights and Forecast, 2019-2031
- 10.1. Market Analysis, Insights and Forecast - by Mode of Transport
- 10.1.1. Rail
- 10.1.2. Road
- 10.1.3. Other Modes of Transport
- 10.2. Market Analysis, Insights and Forecast - by Geography
- 10.2.1. China
- 10.2.2. Japan
- 10.2.3. India
- 10.2.4. South Korea
- 10.2.5. Indonesia
- 10.2.6. Vietnam
- 10.2.7. Australia
- 10.2.8. Rest of Asia-Pacific
- 10.1. Market Analysis, Insights and Forecast - by Mode of Transport
- 11. Vietnam Asia-Pacific Container Drayage Market Analysis, Insights and Forecast, 2019-2031
- 11.1. Market Analysis, Insights and Forecast - by Mode of Transport
- 11.1.1. Rail
- 11.1.2. Road
- 11.1.3. Other Modes of Transport
- 11.2. Market Analysis, Insights and Forecast - by Geography
- 11.2.1. China
- 11.2.2. Japan
- 11.2.3. India
- 11.2.4. South Korea
- 11.2.5. Indonesia
- 11.2.6. Vietnam
- 11.2.7. Australia
- 11.2.8. Rest of Asia-Pacific
- 11.1. Market Analysis, Insights and Forecast - by Mode of Transport
- 12. Australia Asia-Pacific Container Drayage Market Analysis, Insights and Forecast, 2019-2031
- 12.1. Market Analysis, Insights and Forecast - by Mode of Transport
- 12.1.1. Rail
- 12.1.2. Road
- 12.1.3. Other Modes of Transport
- 12.2. Market Analysis, Insights and Forecast - by Geography
- 12.2.1. China
- 12.2.2. Japan
- 12.2.3. India
- 12.2.4. South Korea
- 12.2.5. Indonesia
- 12.2.6. Vietnam
- 12.2.7. Australia
- 12.2.8. Rest of Asia-Pacific
- 12.1. Market Analysis, Insights and Forecast - by Mode of Transport
- 13. Rest of Asia Pacific Asia-Pacific Container Drayage Market Analysis, Insights and Forecast, 2019-2031
- 13.1. Market Analysis, Insights and Forecast - by Mode of Transport
- 13.1.1. Rail
- 13.1.2. Road
- 13.1.3. Other Modes of Transport
- 13.2. Market Analysis, Insights and Forecast - by Geography
- 13.2.1. China
- 13.2.2. Japan
- 13.2.3. India
- 13.2.4. South Korea
- 13.2.5. Indonesia
- 13.2.6. Vietnam
- 13.2.7. Australia
- 13.2.8. Rest of Asia-Pacific
- 13.1. Market Analysis, Insights and Forecast - by Mode of Transport
- 14. Competitive Analysis
- 14.1. Global Market Share Analysis 2024
- 14.2. Company Profiles
- 14.2.1 Maersk Asia Pacific
- 14.2.1.1. Overview
- 14.2.1.2. Products
- 14.2.1.3. SWOT Analysis
- 14.2.1.4. Recent Developments
- 14.2.1.5. Financials (Based on Availability)
- 14.2.2 Agility
- 14.2.2.1. Overview
- 14.2.2.2. Products
- 14.2.2.3. SWOT Analysis
- 14.2.2.4. Recent Developments
- 14.2.2.5. Financials (Based on Availability)
- 14.2.3 C H Robinson Worldwide Inc
- 14.2.3.1. Overview
- 14.2.3.2. Products
- 14.2.3.3. SWOT Analysis
- 14.2.3.4. Recent Developments
- 14.2.3.5. Financials (Based on Availability)
- 14.2.4 FedEx Corp
- 14.2.4.1. Overview
- 14.2.4.2. Products
- 14.2.4.3. SWOT Analysis
- 14.2.4.4. Recent Developments
- 14.2.4.5. Financials (Based on Availability)
- 14.2.5 Deutsche Post DHL Group
- 14.2.5.1. Overview
- 14.2.5.2. Products
- 14.2.5.3. SWOT Analysis
- 14.2.5.4. Recent Developments
- 14.2.5.5. Financials (Based on Availability)
- 14.2.6 Hitachi Ltd
- 14.2.6.1. Overview
- 14.2.6.2. Products
- 14.2.6.3. SWOT Analysis
- 14.2.6.4. Recent Developments
- 14.2.6.5. Financials (Based on Availability)
- 14.2.7 CMA CGM SA Group
- 14.2.7.1. Overview
- 14.2.7.2. Products
- 14.2.7.3. SWOT Analysis
- 14.2.7.4. Recent Developments
- 14.2.7.5. Financials (Based on Availability)
- 14.2.8 DB Schenker
- 14.2.8.1. Overview
- 14.2.8.2. Products
- 14.2.8.3. SWOT Analysis
- 14.2.8.4. Recent Developments
- 14.2.8.5. Financials (Based on Availability)
- 14.2.9 United Parcel Services Inc
- 14.2.9.1. Overview
- 14.2.9.2. Products
- 14.2.9.3. SWOT Analysis
- 14.2.9.4. Recent Developments
- 14.2.9.5. Financials (Based on Availability)
- 14.2.10 Ceva Logistics
- 14.2.10.1. Overview
- 14.2.10.2. Products
- 14.2.10.3. SWOT Analysis
- 14.2.10.4. Recent Developments
- 14.2.10.5. Financials (Based on Availability)
- 14.2.11 Yusen Logistics Co Ltd**List Not Exhaustive 6 3 Other Companie
- 14.2.11.1. Overview
- 14.2.11.2. Products
- 14.2.11.3. SWOT Analysis
- 14.2.11.4. Recent Developments
- 14.2.11.5. Financials (Based on Availability)
- 14.2.1 Maersk Asia Pacific
List of Figures
- Figure 1: Global Asia-Pacific Container Drayage Market Revenue Breakdown (Million, %) by Region 2024 & 2032
- Figure 2: Global Asia-Pacific Container Drayage Market Volume Breakdown (Billion, %) by Region 2024 & 2032
- Figure 3: China Asia-Pacific Container Drayage Market Revenue (Million), by Mode of Transport 2024 & 2032
- Figure 4: China Asia-Pacific Container Drayage Market Volume (Billion), by Mode of Transport 2024 & 2032
- Figure 5: China Asia-Pacific Container Drayage Market Revenue Share (%), by Mode of Transport 2024 & 2032
- Figure 6: China Asia-Pacific Container Drayage Market Volume Share (%), by Mode of Transport 2024 & 2032
- Figure 7: China Asia-Pacific Container Drayage Market Revenue (Million), by Geography 2024 & 2032
- Figure 8: China Asia-Pacific Container Drayage Market Volume (Billion), by Geography 2024 & 2032
- Figure 9: China Asia-Pacific Container Drayage Market Revenue Share (%), by Geography 2024 & 2032
- Figure 10: China Asia-Pacific Container Drayage Market Volume Share (%), by Geography 2024 & 2032
- Figure 11: China Asia-Pacific Container Drayage Market Revenue (Million), by Country 2024 & 2032
- Figure 12: China Asia-Pacific Container Drayage Market Volume (Billion), by Country 2024 & 2032
- Figure 13: China Asia-Pacific Container Drayage Market Revenue Share (%), by Country 2024 & 2032
- Figure 14: China Asia-Pacific Container Drayage Market Volume Share (%), by Country 2024 & 2032
- Figure 15: Japan Asia-Pacific Container Drayage Market Revenue (Million), by Mode of Transport 2024 & 2032
- Figure 16: Japan Asia-Pacific Container Drayage Market Volume (Billion), by Mode of Transport 2024 & 2032
- Figure 17: Japan Asia-Pacific Container Drayage Market Revenue Share (%), by Mode of Transport 2024 & 2032
- Figure 18: Japan Asia-Pacific Container Drayage Market Volume Share (%), by Mode of Transport 2024 & 2032
- Figure 19: Japan Asia-Pacific Container Drayage Market Revenue (Million), by Geography 2024 & 2032
- Figure 20: Japan Asia-Pacific Container Drayage Market Volume (Billion), by Geography 2024 & 2032
- Figure 21: Japan Asia-Pacific Container Drayage Market Revenue Share (%), by Geography 2024 & 2032
- Figure 22: Japan Asia-Pacific Container Drayage Market Volume Share (%), by Geography 2024 & 2032
- Figure 23: Japan Asia-Pacific Container Drayage Market Revenue (Million), by Country 2024 & 2032
- Figure 24: Japan Asia-Pacific Container Drayage Market Volume (Billion), by Country 2024 & 2032
- Figure 25: Japan Asia-Pacific Container Drayage Market Revenue Share (%), by Country 2024 & 2032
- Figure 26: Japan Asia-Pacific Container Drayage Market Volume Share (%), by Country 2024 & 2032
- Figure 27: India Asia-Pacific Container Drayage Market Revenue (Million), by Mode of Transport 2024 & 2032
- Figure 28: India Asia-Pacific Container Drayage Market Volume (Billion), by Mode of Transport 2024 & 2032
- Figure 29: India Asia-Pacific Container Drayage Market Revenue Share (%), by Mode of Transport 2024 & 2032
- Figure 30: India Asia-Pacific Container Drayage Market Volume Share (%), by Mode of Transport 2024 & 2032
- Figure 31: India Asia-Pacific Container Drayage Market Revenue (Million), by Geography 2024 & 2032
- Figure 32: India Asia-Pacific Container Drayage Market Volume (Billion), by Geography 2024 & 2032
- Figure 33: India Asia-Pacific Container Drayage Market Revenue Share (%), by Geography 2024 & 2032
- Figure 34: India Asia-Pacific Container Drayage Market Volume Share (%), by Geography 2024 & 2032
- Figure 35: India Asia-Pacific Container Drayage Market Revenue (Million), by Country 2024 & 2032
- Figure 36: India Asia-Pacific Container Drayage Market Volume (Billion), by Country 2024 & 2032
- Figure 37: India Asia-Pacific Container Drayage Market Revenue Share (%), by Country 2024 & 2032
- Figure 38: India Asia-Pacific Container Drayage Market Volume Share (%), by Country 2024 & 2032
- Figure 39: South Korea Asia-Pacific Container Drayage Market Revenue (Million), by Mode of Transport 2024 & 2032
- Figure 40: South Korea Asia-Pacific Container Drayage Market Volume (Billion), by Mode of Transport 2024 & 2032
- Figure 41: South Korea Asia-Pacific Container Drayage Market Revenue Share (%), by Mode of Transport 2024 & 2032
- Figure 42: South Korea Asia-Pacific Container Drayage Market Volume Share (%), by Mode of Transport 2024 & 2032
- Figure 43: South Korea Asia-Pacific Container Drayage Market Revenue (Million), by Geography 2024 & 2032
- Figure 44: South Korea Asia-Pacific Container Drayage Market Volume (Billion), by Geography 2024 & 2032
- Figure 45: South Korea Asia-Pacific Container Drayage Market Revenue Share (%), by Geography 2024 & 2032
- Figure 46: South Korea Asia-Pacific Container Drayage Market Volume Share (%), by Geography 2024 & 2032
- Figure 47: South Korea Asia-Pacific Container Drayage Market Revenue (Million), by Country 2024 & 2032
- Figure 48: South Korea Asia-Pacific Container Drayage Market Volume (Billion), by Country 2024 & 2032
- Figure 49: South Korea Asia-Pacific Container Drayage Market Revenue Share (%), by Country 2024 & 2032
- Figure 50: South Korea Asia-Pacific Container Drayage Market Volume Share (%), by Country 2024 & 2032
- Figure 51: Indonesia Asia-Pacific Container Drayage Market Revenue (Million), by Mode of Transport 2024 & 2032
- Figure 52: Indonesia Asia-Pacific Container Drayage Market Volume (Billion), by Mode of Transport 2024 & 2032
- Figure 53: Indonesia Asia-Pacific Container Drayage Market Revenue Share (%), by Mode of Transport 2024 & 2032
- Figure 54: Indonesia Asia-Pacific Container Drayage Market Volume Share (%), by Mode of Transport 2024 & 2032
- Figure 55: Indonesia Asia-Pacific Container Drayage Market Revenue (Million), by Geography 2024 & 2032
- Figure 56: Indonesia Asia-Pacific Container Drayage Market Volume (Billion), by Geography 2024 & 2032
- Figure 57: Indonesia Asia-Pacific Container Drayage Market Revenue Share (%), by Geography 2024 & 2032
- Figure 58: Indonesia Asia-Pacific Container Drayage Market Volume Share (%), by Geography 2024 & 2032
- Figure 59: Indonesia Asia-Pacific Container Drayage Market Revenue (Million), by Country 2024 & 2032
- Figure 60: Indonesia Asia-Pacific Container Drayage Market Volume (Billion), by Country 2024 & 2032
- Figure 61: Indonesia Asia-Pacific Container Drayage Market Revenue Share (%), by Country 2024 & 2032
- Figure 62: Indonesia Asia-Pacific Container Drayage Market Volume Share (%), by Country 2024 & 2032
- Figure 63: Vietnam Asia-Pacific Container Drayage Market Revenue (Million), by Mode of Transport 2024 & 2032
- Figure 64: Vietnam Asia-Pacific Container Drayage Market Volume (Billion), by Mode of Transport 2024 & 2032
- Figure 65: Vietnam Asia-Pacific Container Drayage Market Revenue Share (%), by Mode of Transport 2024 & 2032
- Figure 66: Vietnam Asia-Pacific Container Drayage Market Volume Share (%), by Mode of Transport 2024 & 2032
- Figure 67: Vietnam Asia-Pacific Container Drayage Market Revenue (Million), by Geography 2024 & 2032
- Figure 68: Vietnam Asia-Pacific Container Drayage Market Volume (Billion), by Geography 2024 & 2032
- Figure 69: Vietnam Asia-Pacific Container Drayage Market Revenue Share (%), by Geography 2024 & 2032
- Figure 70: Vietnam Asia-Pacific Container Drayage Market Volume Share (%), by Geography 2024 & 2032
- Figure 71: Vietnam Asia-Pacific Container Drayage Market Revenue (Million), by Country 2024 & 2032
- Figure 72: Vietnam Asia-Pacific Container Drayage Market Volume (Billion), by Country 2024 & 2032
- Figure 73: Vietnam Asia-Pacific Container Drayage Market Revenue Share (%), by Country 2024 & 2032
- Figure 74: Vietnam Asia-Pacific Container Drayage Market Volume Share (%), by Country 2024 & 2032
- Figure 75: Australia Asia-Pacific Container Drayage Market Revenue (Million), by Mode of Transport 2024 & 2032
- Figure 76: Australia Asia-Pacific Container Drayage Market Volume (Billion), by Mode of Transport 2024 & 2032
- Figure 77: Australia Asia-Pacific Container Drayage Market Revenue Share (%), by Mode of Transport 2024 & 2032
- Figure 78: Australia Asia-Pacific Container Drayage Market Volume Share (%), by Mode of Transport 2024 & 2032
- Figure 79: Australia Asia-Pacific Container Drayage Market Revenue (Million), by Geography 2024 & 2032
- Figure 80: Australia Asia-Pacific Container Drayage Market Volume (Billion), by Geography 2024 & 2032
- Figure 81: Australia Asia-Pacific Container Drayage Market Revenue Share (%), by Geography 2024 & 2032
- Figure 82: Australia Asia-Pacific Container Drayage Market Volume Share (%), by Geography 2024 & 2032
- Figure 83: Australia Asia-Pacific Container Drayage Market Revenue (Million), by Country 2024 & 2032
- Figure 84: Australia Asia-Pacific Container Drayage Market Volume (Billion), by Country 2024 & 2032
- Figure 85: Australia Asia-Pacific Container Drayage Market Revenue Share (%), by Country 2024 & 2032
- Figure 86: Australia Asia-Pacific Container Drayage Market Volume Share (%), by Country 2024 & 2032
- Figure 87: Rest of Asia Pacific Asia-Pacific Container Drayage Market Revenue (Million), by Mode of Transport 2024 & 2032
- Figure 88: Rest of Asia Pacific Asia-Pacific Container Drayage Market Volume (Billion), by Mode of Transport 2024 & 2032
- Figure 89: Rest of Asia Pacific Asia-Pacific Container Drayage Market Revenue Share (%), by Mode of Transport 2024 & 2032
- Figure 90: Rest of Asia Pacific Asia-Pacific Container Drayage Market Volume Share (%), by Mode of Transport 2024 & 2032
- Figure 91: Rest of Asia Pacific Asia-Pacific Container Drayage Market Revenue (Million), by Geography 2024 & 2032
- Figure 92: Rest of Asia Pacific Asia-Pacific Container Drayage Market Volume (Billion), by Geography 2024 & 2032
- Figure 93: Rest of Asia Pacific Asia-Pacific Container Drayage Market Revenue Share (%), by Geography 2024 & 2032
- Figure 94: Rest of Asia Pacific Asia-Pacific Container Drayage Market Volume Share (%), by Geography 2024 & 2032
- Figure 95: Rest of Asia Pacific Asia-Pacific Container Drayage Market Revenue (Million), by Country 2024 & 2032
- Figure 96: Rest of Asia Pacific Asia-Pacific Container Drayage Market Volume (Billion), by Country 2024 & 2032
- Figure 97: Rest of Asia Pacific Asia-Pacific Container Drayage Market Revenue Share (%), by Country 2024 & 2032
- Figure 98: Rest of Asia Pacific Asia-Pacific Container Drayage Market Volume Share (%), by Country 2024 & 2032
List of Tables
- Table 1: Global Asia-Pacific Container Drayage Market Revenue Million Forecast, by Region 2019 & 2032
- Table 2: Global Asia-Pacific Container Drayage Market Volume Billion Forecast, by Region 2019 & 2032
- Table 3: Global Asia-Pacific Container Drayage Market Revenue Million Forecast, by Mode of Transport 2019 & 2032
- Table 4: Global Asia-Pacific Container Drayage Market Volume Billion Forecast, by Mode of Transport 2019 & 2032
- Table 5: Global Asia-Pacific Container Drayage Market Revenue Million Forecast, by Geography 2019 & 2032
- Table 6: Global Asia-Pacific Container Drayage Market Volume Billion Forecast, by Geography 2019 & 2032
- Table 7: Global Asia-Pacific Container Drayage Market Revenue Million Forecast, by Region 2019 & 2032
- Table 8: Global Asia-Pacific Container Drayage Market Volume Billion Forecast, by Region 2019 & 2032
- Table 9: Global Asia-Pacific Container Drayage Market Revenue Million Forecast, by Mode of Transport 2019 & 2032
- Table 10: Global Asia-Pacific Container Drayage Market Volume Billion Forecast, by Mode of Transport 2019 & 2032
- Table 11: Global Asia-Pacific Container Drayage Market Revenue Million Forecast, by Geography 2019 & 2032
- Table 12: Global Asia-Pacific Container Drayage Market Volume Billion Forecast, by Geography 2019 & 2032
- Table 13: Global Asia-Pacific Container Drayage Market Revenue Million Forecast, by Country 2019 & 2032
- Table 14: Global Asia-Pacific Container Drayage Market Volume Billion Forecast, by Country 2019 & 2032
- Table 15: Global Asia-Pacific Container Drayage Market Revenue Million Forecast, by Mode of Transport 2019 & 2032
- Table 16: Global Asia-Pacific Container Drayage Market Volume Billion Forecast, by Mode of Transport 2019 & 2032
- Table 17: Global Asia-Pacific Container Drayage Market Revenue Million Forecast, by Geography 2019 & 2032
- Table 18: Global Asia-Pacific Container Drayage Market Volume Billion Forecast, by Geography 2019 & 2032
- Table 19: Global Asia-Pacific Container Drayage Market Revenue Million Forecast, by Country 2019 & 2032
- Table 20: Global Asia-Pacific Container Drayage Market Volume Billion Forecast, by Country 2019 & 2032
- Table 21: Global Asia-Pacific Container Drayage Market Revenue Million Forecast, by Mode of Transport 2019 & 2032
- Table 22: Global Asia-Pacific Container Drayage Market Volume Billion Forecast, by Mode of Transport 2019 & 2032
- Table 23: Global Asia-Pacific Container Drayage Market Revenue Million Forecast, by Geography 2019 & 2032
- Table 24: Global Asia-Pacific Container Drayage Market Volume Billion Forecast, by Geography 2019 & 2032
- Table 25: Global Asia-Pacific Container Drayage Market Revenue Million Forecast, by Country 2019 & 2032
- Table 26: Global Asia-Pacific Container Drayage Market Volume Billion Forecast, by Country 2019 & 2032
- Table 27: Global Asia-Pacific Container Drayage Market Revenue Million Forecast, by Mode of Transport 2019 & 2032
- Table 28: Global Asia-Pacific Container Drayage Market Volume Billion Forecast, by Mode of Transport 2019 & 2032
- Table 29: Global Asia-Pacific Container Drayage Market Revenue Million Forecast, by Geography 2019 & 2032
- Table 30: Global Asia-Pacific Container Drayage Market Volume Billion Forecast, by Geography 2019 & 2032
- Table 31: Global Asia-Pacific Container Drayage Market Revenue Million Forecast, by Country 2019 & 2032
- Table 32: Global Asia-Pacific Container Drayage Market Volume Billion Forecast, by Country 2019 & 2032
- Table 33: Global Asia-Pacific Container Drayage Market Revenue Million Forecast, by Mode of Transport 2019 & 2032
- Table 34: Global Asia-Pacific Container Drayage Market Volume Billion Forecast, by Mode of Transport 2019 & 2032
- Table 35: Global Asia-Pacific Container Drayage Market Revenue Million Forecast, by Geography 2019 & 2032
- Table 36: Global Asia-Pacific Container Drayage Market Volume Billion Forecast, by Geography 2019 & 2032
- Table 37: Global Asia-Pacific Container Drayage Market Revenue Million Forecast, by Country 2019 & 2032
- Table 38: Global Asia-Pacific Container Drayage Market Volume Billion Forecast, by Country 2019 & 2032
- Table 39: Global Asia-Pacific Container Drayage Market Revenue Million Forecast, by Mode of Transport 2019 & 2032
- Table 40: Global Asia-Pacific Container Drayage Market Volume Billion Forecast, by Mode of Transport 2019 & 2032
- Table 41: Global Asia-Pacific Container Drayage Market Revenue Million Forecast, by Geography 2019 & 2032
- Table 42: Global Asia-Pacific Container Drayage Market Volume Billion Forecast, by Geography 2019 & 2032
- Table 43: Global Asia-Pacific Container Drayage Market Revenue Million Forecast, by Country 2019 & 2032
- Table 44: Global Asia-Pacific Container Drayage Market Volume Billion Forecast, by Country 2019 & 2032
- Table 45: Global Asia-Pacific Container Drayage Market Revenue Million Forecast, by Mode of Transport 2019 & 2032
- Table 46: Global Asia-Pacific Container Drayage Market Volume Billion Forecast, by Mode of Transport 2019 & 2032
- Table 47: Global Asia-Pacific Container Drayage Market Revenue Million Forecast, by Geography 2019 & 2032
- Table 48: Global Asia-Pacific Container Drayage Market Volume Billion Forecast, by Geography 2019 & 2032
- Table 49: Global Asia-Pacific Container Drayage Market Revenue Million Forecast, by Country 2019 & 2032
- Table 50: Global Asia-Pacific Container Drayage Market Volume Billion Forecast, by Country 2019 & 2032
- Table 51: Global Asia-Pacific Container Drayage Market Revenue Million Forecast, by Mode of Transport 2019 & 2032
- Table 52: Global Asia-Pacific Container Drayage Market Volume Billion Forecast, by Mode of Transport 2019 & 2032
- Table 53: Global Asia-Pacific Container Drayage Market Revenue Million Forecast, by Geography 2019 & 2032
- Table 54: Global Asia-Pacific Container Drayage Market Volume Billion Forecast, by Geography 2019 & 2032
- Table 55: Global Asia-Pacific Container Drayage Market Revenue Million Forecast, by Country 2019 & 2032
- Table 56: Global Asia-Pacific Container Drayage Market Volume Billion Forecast, by Country 2019 & 2032
Frequently Asked Questions
1. What is the projected Compound Annual Growth Rate (CAGR) of the Asia-Pacific Container Drayage Market?
The projected CAGR is approximately 8.23%.
2. Which companies are prominent players in the Asia-Pacific Container Drayage Market?
Key companies in the market include Maersk Asia Pacific, Agility, C H Robinson Worldwide Inc, FedEx Corp, Deutsche Post DHL Group, Hitachi Ltd, CMA CGM SA Group, DB Schenker, United Parcel Services Inc, Ceva Logistics, Yusen Logistics Co Ltd**List Not Exhaustive 6 3 Other Companie.
3. What are the main segments of the Asia-Pacific Container Drayage Market?
The market segments include Mode of Transport, Geography.
4. Can you provide details about the market size?
The market size is estimated to be USD 14.36 Million as of 2022.
5. What are some drivers contributing to market growth?
4.; Increasing Railway Trade4.; Growing E-commerce Sector.
6. What are the notable trends driving market growth?
Port Congestion Easing in Key Asian Hubs. Surge in Demand for Container Drayage Driving the Transportation Segment.
7. Are there any restraints impacting market growth?
4.; Increasing Railway Trade4.; Growing E-commerce Sector.
8. Can you provide examples of recent developments in the market?
July 2024: DP World, the Dubai-based ports and logistics leader, unveiled 51 fresh freight forwarding offices in the Asia-Pacific. These new offices, specializing in air and ocean freight, leverage DP World's robust infrastructure, spanning ports, terminals, warehouses, trucks, rail, and vessels.February 2024: HERE Technologies, a leading provider of location data and technology solutions, partnered with PSA Singapore, the operator of the world's largest transshipment hub, to transform Singapore's container truck ecosystem. Their goal is to boost the efficiency of goods transportation within Singapore's terminals. Singapore, a global maritime leader, hosts the world's second busiest container port, the Port of Singapore. PSA's network spans 600+ ports globally, and in the previous year, it managed an impressive 38.8 million TEUs.
9. What pricing options are available for accessing the report?
Pricing options include single-user, multi-user, and enterprise licenses priced at USD 4750, USD 5250, and USD 8750 respectively.
10. Is the market size provided in terms of value or volume?
The market size is provided in terms of value, measured in Million and volume, measured in Billion.
11. Are there any specific market keywords associated with the report?
Yes, the market keyword associated with the report is "Asia-Pacific Container Drayage Market," which aids in identifying and referencing the specific market segment covered.
12. How do I determine which pricing option suits my needs best?
The pricing options vary based on user requirements and access needs. Individual users may opt for single-user licenses, while businesses requiring broader access may choose multi-user or enterprise licenses for cost-effective access to the report.
13. Are there any additional resources or data provided in the Asia-Pacific Container Drayage Market report?
While the report offers comprehensive insights, it's advisable to review the specific contents or supplementary materials provided to ascertain if additional resources or data are available.
14. How can I stay updated on further developments or reports in the Asia-Pacific Container Drayage Market?
To stay informed about further developments, trends, and reports in the Asia-Pacific Container Drayage Market, consider subscribing to industry newsletters, following relevant companies and organizations, or regularly checking reputable industry news sources and publications.
Methodology
Step 1 - Identification of Relevant Samples Size from Population Database


Step 2 - Approaches for Defining Global Market Size (Value, Volume* & Price*)

Note*: In applicable scenarios
Step 3 - Data Sources
Primary Research
- Web Analytics
- Survey Reports
- Research Institute
- Latest Research Reports
- Opinion Leaders
Secondary Research
- Annual Reports
- White Paper
- Latest Press Release
- Industry Association
- Paid Database
- Investor Presentations

Step 4 - Data Triangulation
Involves using different sources of information in order to increase the validity of a study
These sources are likely to be stakeholders in a program - participants, other researchers, program staff, other community members, and so on.
Then we put all data in single framework & apply various statistical tools to find out the dynamic on the market.
During the analysis stage, feedback from the stakeholder groups would be compared to determine areas of agreement as well as areas of divergence
