

Key Insights
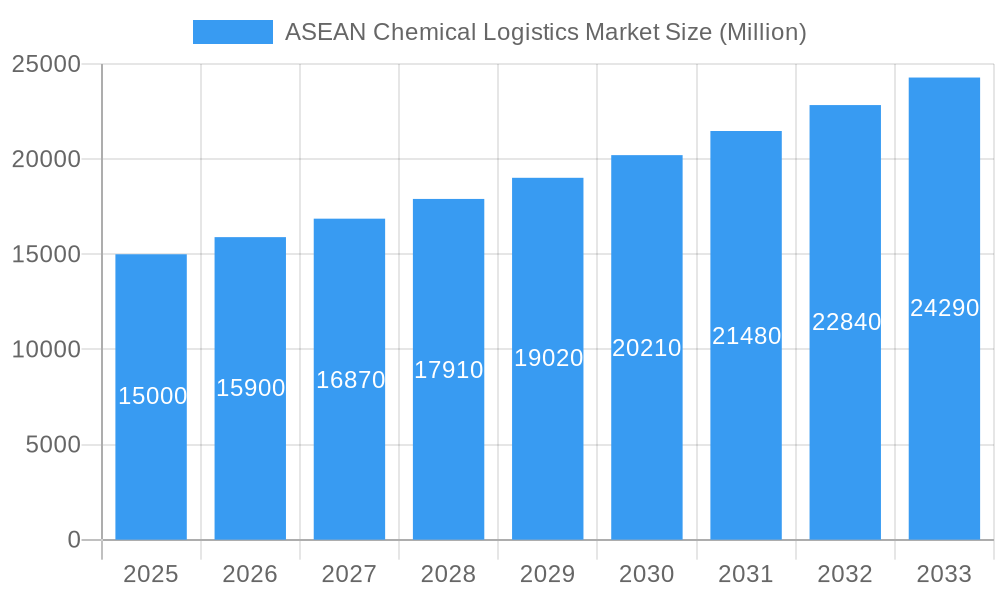
The ASEAN chemical logistics market is poised for substantial expansion, propelled by a robustly growing regional chemical industry, surging cross-border trade, and an escalating demand for specialized transportation and warehousing solutions. The market is projected to achieve a Compound Annual Growth Rate (CAGR) of 9.53%, expanding from a market size of 47.53 billion in the base year 2025 to reach a significant valuation by 2033. Key growth catalysts include the flourishing pharmaceutical, specialty chemical, and cosmetic sectors within ASEAN, which necessitate efficient and secure chemical logistics. Furthermore, the increasing adoption of sustainable logistics practices to mitigate environmental impact presents a considerable opportunity for market participants. However, the market navigates challenges such as stringent regulatory compliance and localized infrastructure deficits, which can affect operational efficiency and cost structures.
ASEAN Chemical Logistics Market Market Size (In Billion)
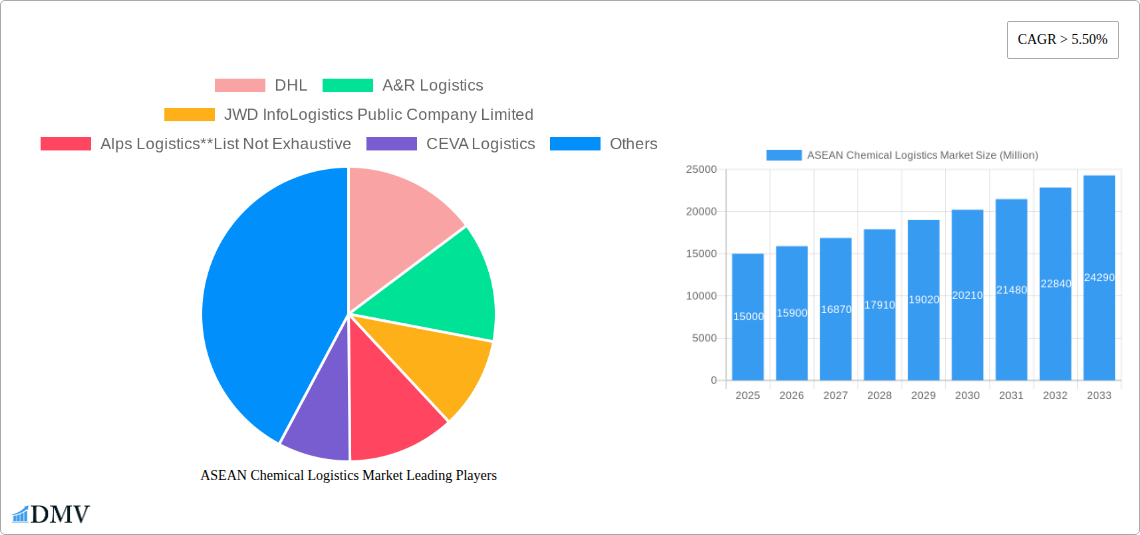
Segmentation analysis indicates road transport as the predominant mode, though air and sea freight remain critical for long-haul shipments. Leading entities like DHL, A&R Logistics, and JWD InfoLogistics are actively integrating advanced technologies and forging strategic alliances to solidify their market positions. The market anticipates continued consolidation and strategic infrastructure investments in the forthcoming years.
ASEAN Chemical Logistics Market Company Market Share
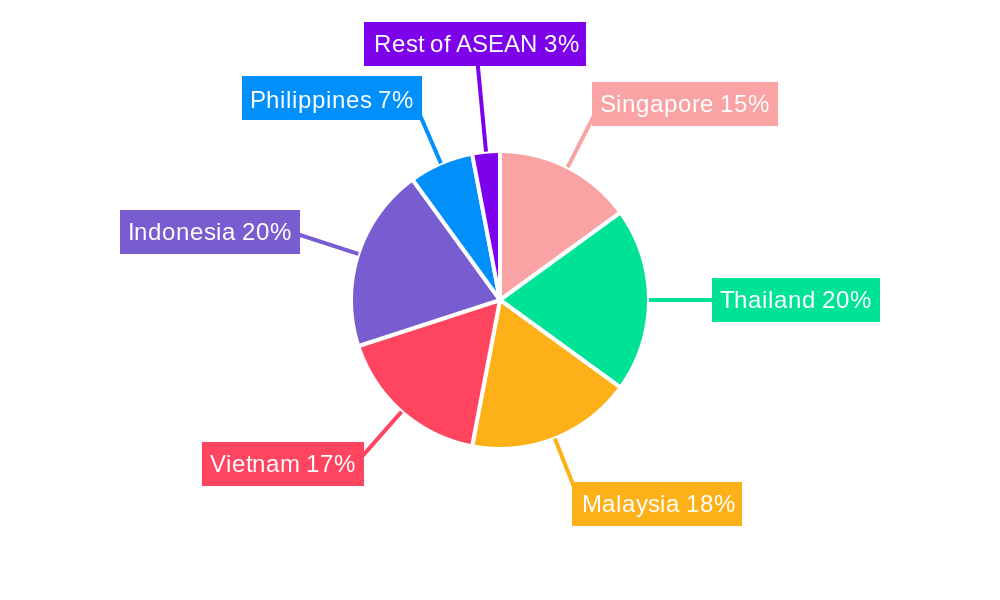
The comprehensive suite of services, encompassing transportation, warehousing, consulting, and customs brokerage, addresses the intricate requirements of the chemical industry. While road transport currently dominates, the escalating need for expedited deliveries and seamless cross-border transit is driving accelerated growth in air and sea freight segments. Prominent markets within ASEAN, including Indonesia, Vietnam, Thailand, and Singapore, exhibit high growth potential driven by expanding chemical production and consumption. Market expansion varies regionally, influenced by economic development, infrastructure quality, and regulatory environments. Continued investment in infrastructure, particularly in port modernization and transportation networks, is paramount to realizing the market's full potential and optimizing chemical logistics efficiency across ASEAN.
Future expansion will be significantly influenced by the increasing integration of digital technologies, such as blockchain and AI-driven logistics solutions, to enhance supply chain optimization and transparency.
ASEAN Chemical Logistics Market: A Comprehensive Report (2019-2033)
This insightful report provides a detailed analysis of the ASEAN Chemical Logistics Market, encompassing market size, trends, key players, and future growth prospects. Covering the period from 2019 to 2033, with a base year of 2025, this study offers invaluable insights for stakeholders seeking to navigate this dynamic sector. The market is projected to reach xx Million by 2033, fueled by strong growth in key segments and increasing demand from diverse end-user industries.
ASEAN Chemical Logistics Market Composition & Trends
This section delves into the intricate structure of the ASEAN chemical logistics market, examining market concentration, innovation drivers, regulatory landscapes, and competitive dynamics. We analyze the interplay of various factors shaping the market's trajectory, including substitution effects, evolving end-user needs, and the impact of mergers and acquisitions (M&A).
Market Concentration & Share Distribution: The ASEAN chemical logistics market exhibits a moderately concentrated landscape, with a few major players holding significant market share. DHL, CEVA Logistics, and Agility Logistics are among the prominent players, but numerous regional and local companies also contribute to the market's dynamism. The precise market share distribution is analyzed within the full report.
- Top 5 Players: Hold approximately xx% of the market share.
- Regional Players: Contribute significantly to overall market volume, particularly in specific niches.
- Market Fragmentation: Moderate, with opportunities for both consolidation and niche specialization.
Innovation Catalysts & Regulatory Landscape: Technological advancements, such as real-time tracking and blockchain implementation, are driving efficiency and transparency. However, navigating diverse regulatory frameworks across ASEAN nations presents both challenges and opportunities. Stringent safety regulations for hazardous materials and evolving environmental standards necessitate continuous adaptation.
Substitute Products & End-User Profiles: The report examines substitute products and the varying needs of end-users across key segments, including pharmaceuticals, specialty chemicals, oil & gas, and cosmetics. Understanding the demands of each segment is crucial for strategizing effectively within this market.
M&A Activities: The section analyzes recent and projected M&A activity, detailing transaction values and their impact on market consolidation. We explore the strategic motivations behind these deals and their influence on future market dynamics. The total value of M&A deals in the past five years is estimated at xx Million.
ASEAN Chemical Logistics Market Industry Evolution
This section analyzes the evolutionary trajectory of the ASEAN chemical logistics market, examining growth trajectories, technological advancements, and shifts in consumer demands from 2019 to 2024. The market is expected to experience a compound annual growth rate (CAGR) of xx% during the forecast period (2025-2033).
- Technological Advancements: Adoption of IoT, AI, and automation is driving efficiency gains and cost reductions. The penetration rate of these technologies is expected to reach xx% by 2033.
- Market Growth Trajectories: Significant growth is expected, driven by rising industrialization, expanding e-commerce, and increasing cross-border trade.
- Shifting Consumer Demands: The increasing focus on sustainability and green logistics is shaping the industry's approach to transportation, warehousing, and distribution.
- Specific Data Points: Detailed growth rates and adoption metrics for various technologies and services are provided in the full report.
Leading Regions, Countries, or Segments in ASEAN Chemical Logistics Market
This segment identifies the leading regions, countries, and market segments within the ASEAN chemical logistics landscape. The analysis highlights key drivers for dominance, exploring investment trends and regulatory support.
By Service: Transportation currently dominates, followed by warehousing and distribution. The growth of green logistics and consulting services presents significant opportunities.
- Key Drivers (Transportation): Robust infrastructure development, increased cross-border trade.
- Key Drivers (Warehousing): Growing demand for efficient storage solutions for hazardous materials.
- Key Drivers (Green Logistics): Increasing regulatory pressures and growing consumer awareness of environmental sustainability.
By Mode of Transportation: Roadways currently hold the largest market share, but railways and waterways are expected to experience growth due to their cost-effectiveness and environmental benefits.
- Roadways: Dominates due to its flexibility and widespread accessibility.
- Railways: Growing importance in long-haul transportation of bulk chemicals.
- Waterways: Cost-effective for large-scale transportation, particularly in coastal regions.
By End User: The pharmaceutical and specialty chemical industries are significant drivers, followed by the oil & gas and cosmetic sectors.
- Pharmaceutical Industry: Stringent regulatory requirements and the need for specialized handling drive market growth.
- Specialty Chemical Industry: Demand for specialized transportation and storage solutions fuels segment growth.
ASEAN Chemical Logistics Market Product Innovations
Recent years have seen notable product innovations focused on enhancing safety, efficiency, and sustainability in chemical logistics. Smart warehousing systems, advanced tracking technologies, and eco-friendly transportation solutions are gaining traction. These innovations enhance the safety of handling hazardous materials, optimize delivery times, and reduce the environmental impact of logistics operations. The adoption of these technologies promises significant improvements in overall efficiency and cost reduction.
Propelling Factors for ASEAN Chemical Logistics Market Growth
The ASEAN chemical logistics market is poised for substantial growth, propelled by several key factors. Rapid industrialization across the region fuels demand for efficient logistics solutions. Government investments in infrastructure, particularly transportation networks, facilitate smoother operations. E-commerce expansion also drives the demand for reliable and timely delivery services. Moreover, evolving regulatory frameworks, while posing certain challenges, also encourage investment in safer and more sustainable practices.
Obstacles in the ASEAN Chemical Logistics Market
Despite its growth potential, the ASEAN chemical logistics market faces several challenges. Varying regulatory standards across different ASEAN countries create complexities for seamless operations. Supply chain disruptions, especially given the global nature of chemical trade, can impact delivery timelines and costs. Intense competition among established and emerging players intensifies pricing pressures and necessitates continuous innovation. The high cost of implementing advanced technologies also presents a barrier to entry for smaller players.
Future Opportunities in ASEAN Chemical Logistics Market
Emerging trends highlight significant opportunities for growth. The increasing demand for specialized logistics for temperature-sensitive chemicals opens avenues for specialized service providers. The growing adoption of digital technologies and the development of smart logistics solutions promise greater efficiency and cost savings. The increasing focus on sustainability offers opportunities for providers focusing on green logistics, including the use of alternative fuels and eco-friendly packaging materials. Expansion into less developed regions within ASEAN also presents untapped potential.
Major Players in the ASEAN Chemical Logistics Market Ecosystem
- DHL
- A&R Logistics
- JWD InfoLogistics Public Company Limited
- Alps Logistics
- CEVA Logistics
- Agility Logistics
- CT Logistics
- Tiong Nam Logistics Holdings BhD
- Eagles Air & Sea
- BDP International
- Rinchem
- Rhenus Logistics
Key Developments in ASEAN Chemical Logistics Market Industry
- October 2022: Rinchem completes a new 45,000 sq. ft. chemical warehouse in Malaysia, expanding its capacity for dangerous goods storage to 3100 pallet positions. This marks its first facility in Malaysia.
- February 2022: Leschaco opens a new 120,000 sq. ft. chemical and dangerous goods warehouse in Port Klang, Malaysia, capable of storing up to 13,000 pallets. This underscores the growing demand for contract logistics in Malaysia.
- October 2021: Ratanakorn Asset and FLS form a joint venture, FLS Supply Chain Centers, to develop specialized warehouse complexes in Thailand, starting with a 10,000-square-meter hazardous chemical warehouse in Maptaphut, Rayong. This signifies significant investments in chemical logistics infrastructure within Thailand.
Strategic ASEAN Chemical Logistics Market Forecast
The ASEAN chemical logistics market is projected for robust growth, driven by escalating industrial activity, increased cross-border trade, and sustained investment in infrastructure. The rising adoption of advanced technologies such as automation and digitalization will enhance efficiency and traceability. Moreover, a growing emphasis on sustainable practices will further shape the market, creating opportunities for environmentally conscious logistics providers. The market's potential is significant, with considerable room for expansion and consolidation in the coming years.
ASEAN Chemical Logistics Market Segmentation
-
1. Service
- 1.1. Transportation
- 1.2. Warehous
- 1.3. Consulting & Management Services
- 1.4. Customs & Security
- 1.5. Green Logistics
- 1.6. Others
-
2. Mode of Transportation
- 2.1. Roadways
- 2.2. Railways
- 2.3. Airways
- 2.4. Waterways
- 2.5. Pipelines
-
3. End User
- 3.1. Pharmaceutical Industry
- 3.2. Specialty Chemical Industry
- 3.3. Oil and Gas Industry
- 3.4. Cosmetic Industry
- 3.5. Others
-
4. Geography
- 4.1. Singapore
- 4.2. Thailand
- 4.3. Malaysia
- 4.4. Vietnam
- 4.5. Indonesia
- 4.6. Philippines
- 4.7. Rest of ASEAN
ASEAN Chemical Logistics Market Segmentation By Geography
- 1. Singapore
- 2. Thailand
- 3. Malaysia
- 4. Vietnam
- 5. Indonesia
- 6. Philippines
- 7. Rest of ASEAN
ASEAN Chemical Logistics Market Regional Market Share
Geographic Coverage of ASEAN Chemical Logistics Market
ASEAN Chemical Logistics Market REPORT HIGHLIGHTS
| Aspects | Details |
|---|---|
| Study Period | 2020-2034 |
| Base Year | 2025 |
| Estimated Year | 2026 |
| Forecast Period | 2026-2034 |
| Historical Period | 2020-2025 |
| Growth Rate | CAGR of 9.53% from 2020-2034 |
| Segmentation |
|
Table of Contents
- 1. Introduction
- 1.1. Research Scope
- 1.2. Market Segmentation
- 1.3. Research Methodology
- 1.4. Definitions and Assumptions
- 2. Executive Summary
- 2.1. Introduction
- 3. Market Dynamics
- 3.1. Introduction
- 3.2. Market Drivers
- 3.2.1. The Rise in Demand for Specialty Chemicals in ASEAN Countries Increasing Trade Logistics Activity; Partnerships and Collaborations Between Major Players in the Chemical Logistics Market are Being Formed for the Creation of Innovative Goods and Technologically Enhanced Services
- 3.3. Market Restrains
- 3.3.1. Complexities Related to Chemical Logistics; High Cost Involved in the Transportation of Chemicals
- 3.4. Market Trends
- 3.4.1. The Rise in Chemical Production is Expected to Propel the Growth of the Chemical Logistics Market
- 4. Market Factor Analysis
- 4.1. Porters Five Forces
- 4.2. Supply/Value Chain
- 4.3. PESTEL analysis
- 4.4. Market Entropy
- 4.5. Patent/Trademark Analysis
- 5. Global ASEAN Chemical Logistics Market Analysis, Insights and Forecast, 2020-2032
- 5.1. Market Analysis, Insights and Forecast - by Service
- 5.1.1. Transportation
- 5.1.2. Warehous
- 5.1.3. Consulting & Management Services
- 5.1.4. Customs & Security
- 5.1.5. Green Logistics
- 5.1.6. Others
- 5.2. Market Analysis, Insights and Forecast - by Mode of Transportation
- 5.2.1. Roadways
- 5.2.2. Railways
- 5.2.3. Airways
- 5.2.4. Waterways
- 5.2.5. Pipelines
- 5.3. Market Analysis, Insights and Forecast - by End User
- 5.3.1. Pharmaceutical Industry
- 5.3.2. Specialty Chemical Industry
- 5.3.3. Oil and Gas Industry
- 5.3.4. Cosmetic Industry
- 5.3.5. Others
- 5.4. Market Analysis, Insights and Forecast - by Geography
- 5.4.1. Singapore
- 5.4.2. Thailand
- 5.4.3. Malaysia
- 5.4.4. Vietnam
- 5.4.5. Indonesia
- 5.4.6. Philippines
- 5.4.7. Rest of ASEAN
- 5.5. Market Analysis, Insights and Forecast - by Region
- 5.5.1. Singapore
- 5.5.2. Thailand
- 5.5.3. Malaysia
- 5.5.4. Vietnam
- 5.5.5. Indonesia
- 5.5.6. Philippines
- 5.5.7. Rest of ASEAN
- 5.1. Market Analysis, Insights and Forecast - by Service
- 6. Singapore ASEAN Chemical Logistics Market Analysis, Insights and Forecast, 2020-2032
- 6.1. Market Analysis, Insights and Forecast - by Service
- 6.1.1. Transportation
- 6.1.2. Warehous
- 6.1.3. Consulting & Management Services
- 6.1.4. Customs & Security
- 6.1.5. Green Logistics
- 6.1.6. Others
- 6.2. Market Analysis, Insights and Forecast - by Mode of Transportation
- 6.2.1. Roadways
- 6.2.2. Railways
- 6.2.3. Airways
- 6.2.4. Waterways
- 6.2.5. Pipelines
- 6.3. Market Analysis, Insights and Forecast - by End User
- 6.3.1. Pharmaceutical Industry
- 6.3.2. Specialty Chemical Industry
- 6.3.3. Oil and Gas Industry
- 6.3.4. Cosmetic Industry
- 6.3.5. Others
- 6.4. Market Analysis, Insights and Forecast - by Geography
- 6.4.1. Singapore
- 6.4.2. Thailand
- 6.4.3. Malaysia
- 6.4.4. Vietnam
- 6.4.5. Indonesia
- 6.4.6. Philippines
- 6.4.7. Rest of ASEAN
- 6.1. Market Analysis, Insights and Forecast - by Service
- 7. Thailand ASEAN Chemical Logistics Market Analysis, Insights and Forecast, 2020-2032
- 7.1. Market Analysis, Insights and Forecast - by Service
- 7.1.1. Transportation
- 7.1.2. Warehous
- 7.1.3. Consulting & Management Services
- 7.1.4. Customs & Security
- 7.1.5. Green Logistics
- 7.1.6. Others
- 7.2. Market Analysis, Insights and Forecast - by Mode of Transportation
- 7.2.1. Roadways
- 7.2.2. Railways
- 7.2.3. Airways
- 7.2.4. Waterways
- 7.2.5. Pipelines
- 7.3. Market Analysis, Insights and Forecast - by End User
- 7.3.1. Pharmaceutical Industry
- 7.3.2. Specialty Chemical Industry
- 7.3.3. Oil and Gas Industry
- 7.3.4. Cosmetic Industry
- 7.3.5. Others
- 7.4. Market Analysis, Insights and Forecast - by Geography
- 7.4.1. Singapore
- 7.4.2. Thailand
- 7.4.3. Malaysia
- 7.4.4. Vietnam
- 7.4.5. Indonesia
- 7.4.6. Philippines
- 7.4.7. Rest of ASEAN
- 7.1. Market Analysis, Insights and Forecast - by Service
- 8. Malaysia ASEAN Chemical Logistics Market Analysis, Insights and Forecast, 2020-2032
- 8.1. Market Analysis, Insights and Forecast - by Service
- 8.1.1. Transportation
- 8.1.2. Warehous
- 8.1.3. Consulting & Management Services
- 8.1.4. Customs & Security
- 8.1.5. Green Logistics
- 8.1.6. Others
- 8.2. Market Analysis, Insights and Forecast - by Mode of Transportation
- 8.2.1. Roadways
- 8.2.2. Railways
- 8.2.3. Airways
- 8.2.4. Waterways
- 8.2.5. Pipelines
- 8.3. Market Analysis, Insights and Forecast - by End User
- 8.3.1. Pharmaceutical Industry
- 8.3.2. Specialty Chemical Industry
- 8.3.3. Oil and Gas Industry
- 8.3.4. Cosmetic Industry
- 8.3.5. Others
- 8.4. Market Analysis, Insights and Forecast - by Geography
- 8.4.1. Singapore
- 8.4.2. Thailand
- 8.4.3. Malaysia
- 8.4.4. Vietnam
- 8.4.5. Indonesia
- 8.4.6. Philippines
- 8.4.7. Rest of ASEAN
- 8.1. Market Analysis, Insights and Forecast - by Service
- 9. Vietnam ASEAN Chemical Logistics Market Analysis, Insights and Forecast, 2020-2032
- 9.1. Market Analysis, Insights and Forecast - by Service
- 9.1.1. Transportation
- 9.1.2. Warehous
- 9.1.3. Consulting & Management Services
- 9.1.4. Customs & Security
- 9.1.5. Green Logistics
- 9.1.6. Others
- 9.2. Market Analysis, Insights and Forecast - by Mode of Transportation
- 9.2.1. Roadways
- 9.2.2. Railways
- 9.2.3. Airways
- 9.2.4. Waterways
- 9.2.5. Pipelines
- 9.3. Market Analysis, Insights and Forecast - by End User
- 9.3.1. Pharmaceutical Industry
- 9.3.2. Specialty Chemical Industry
- 9.3.3. Oil and Gas Industry
- 9.3.4. Cosmetic Industry
- 9.3.5. Others
- 9.4. Market Analysis, Insights and Forecast - by Geography
- 9.4.1. Singapore
- 9.4.2. Thailand
- 9.4.3. Malaysia
- 9.4.4. Vietnam
- 9.4.5. Indonesia
- 9.4.6. Philippines
- 9.4.7. Rest of ASEAN
- 9.1. Market Analysis, Insights and Forecast - by Service
- 10. Indonesia ASEAN Chemical Logistics Market Analysis, Insights and Forecast, 2020-2032
- 10.1. Market Analysis, Insights and Forecast - by Service
- 10.1.1. Transportation
- 10.1.2. Warehous
- 10.1.3. Consulting & Management Services
- 10.1.4. Customs & Security
- 10.1.5. Green Logistics
- 10.1.6. Others
- 10.2. Market Analysis, Insights and Forecast - by Mode of Transportation
- 10.2.1. Roadways
- 10.2.2. Railways
- 10.2.3. Airways
- 10.2.4. Waterways
- 10.2.5. Pipelines
- 10.3. Market Analysis, Insights and Forecast - by End User
- 10.3.1. Pharmaceutical Industry
- 10.3.2. Specialty Chemical Industry
- 10.3.3. Oil and Gas Industry
- 10.3.4. Cosmetic Industry
- 10.3.5. Others
- 10.4. Market Analysis, Insights and Forecast - by Geography
- 10.4.1. Singapore
- 10.4.2. Thailand
- 10.4.3. Malaysia
- 10.4.4. Vietnam
- 10.4.5. Indonesia
- 10.4.6. Philippines
- 10.4.7. Rest of ASEAN
- 10.1. Market Analysis, Insights and Forecast - by Service
- 11. Philippines ASEAN Chemical Logistics Market Analysis, Insights and Forecast, 2020-2032
- 11.1. Market Analysis, Insights and Forecast - by Service
- 11.1.1. Transportation
- 11.1.2. Warehous
- 11.1.3. Consulting & Management Services
- 11.1.4. Customs & Security
- 11.1.5. Green Logistics
- 11.1.6. Others
- 11.2. Market Analysis, Insights and Forecast - by Mode of Transportation
- 11.2.1. Roadways
- 11.2.2. Railways
- 11.2.3. Airways
- 11.2.4. Waterways
- 11.2.5. Pipelines
- 11.3. Market Analysis, Insights and Forecast - by End User
- 11.3.1. Pharmaceutical Industry
- 11.3.2. Specialty Chemical Industry
- 11.3.3. Oil and Gas Industry
- 11.3.4. Cosmetic Industry
- 11.3.5. Others
- 11.4. Market Analysis, Insights and Forecast - by Geography
- 11.4.1. Singapore
- 11.4.2. Thailand
- 11.4.3. Malaysia
- 11.4.4. Vietnam
- 11.4.5. Indonesia
- 11.4.6. Philippines
- 11.4.7. Rest of ASEAN
- 11.1. Market Analysis, Insights and Forecast - by Service
- 12. Rest of ASEAN ASEAN Chemical Logistics Market Analysis, Insights and Forecast, 2020-2032
- 12.1. Market Analysis, Insights and Forecast - by Service
- 12.1.1. Transportation
- 12.1.2. Warehous
- 12.1.3. Consulting & Management Services
- 12.1.4. Customs & Security
- 12.1.5. Green Logistics
- 12.1.6. Others
- 12.2. Market Analysis, Insights and Forecast - by Mode of Transportation
- 12.2.1. Roadways
- 12.2.2. Railways
- 12.2.3. Airways
- 12.2.4. Waterways
- 12.2.5. Pipelines
- 12.3. Market Analysis, Insights and Forecast - by End User
- 12.3.1. Pharmaceutical Industry
- 12.3.2. Specialty Chemical Industry
- 12.3.3. Oil and Gas Industry
- 12.3.4. Cosmetic Industry
- 12.3.5. Others
- 12.4. Market Analysis, Insights and Forecast - by Geography
- 12.4.1. Singapore
- 12.4.2. Thailand
- 12.4.3. Malaysia
- 12.4.4. Vietnam
- 12.4.5. Indonesia
- 12.4.6. Philippines
- 12.4.7. Rest of ASEAN
- 12.1. Market Analysis, Insights and Forecast - by Service
- 13. Competitive Analysis
- 13.1. Global Market Share Analysis 2025
- 13.2. Company Profiles
- 13.2.1 DHL
- 13.2.1.1. Overview
- 13.2.1.2. Products
- 13.2.1.3. SWOT Analysis
- 13.2.1.4. Recent Developments
- 13.2.1.5. Financials (Based on Availability)
- 13.2.2 A&R Logistics
- 13.2.2.1. Overview
- 13.2.2.2. Products
- 13.2.2.3. SWOT Analysis
- 13.2.2.4. Recent Developments
- 13.2.2.5. Financials (Based on Availability)
- 13.2.3 JWD InfoLogistics Public Company Limited
- 13.2.3.1. Overview
- 13.2.3.2. Products
- 13.2.3.3. SWOT Analysis
- 13.2.3.4. Recent Developments
- 13.2.3.5. Financials (Based on Availability)
- 13.2.4 Alps Logistics**List Not Exhaustive
- 13.2.4.1. Overview
- 13.2.4.2. Products
- 13.2.4.3. SWOT Analysis
- 13.2.4.4. Recent Developments
- 13.2.4.5. Financials (Based on Availability)
- 13.2.5 CEVA Logistics
- 13.2.5.1. Overview
- 13.2.5.2. Products
- 13.2.5.3. SWOT Analysis
- 13.2.5.4. Recent Developments
- 13.2.5.5. Financials (Based on Availability)
- 13.2.6 Agility Logistics
- 13.2.6.1. Overview
- 13.2.6.2. Products
- 13.2.6.3. SWOT Analysis
- 13.2.6.4. Recent Developments
- 13.2.6.5. Financials (Based on Availability)
- 13.2.7 CT Logistics
- 13.2.7.1. Overview
- 13.2.7.2. Products
- 13.2.7.3. SWOT Analysis
- 13.2.7.4. Recent Developments
- 13.2.7.5. Financials (Based on Availability)
- 13.2.8 Tiong Nam Logistics Holdings BhD
- 13.2.8.1. Overview
- 13.2.8.2. Products
- 13.2.8.3. SWOT Analysis
- 13.2.8.4. Recent Developments
- 13.2.8.5. Financials (Based on Availability)
- 13.2.9 Eagles Air & Sea
- 13.2.9.1. Overview
- 13.2.9.2. Products
- 13.2.9.3. SWOT Analysis
- 13.2.9.4. Recent Developments
- 13.2.9.5. Financials (Based on Availability)
- 13.2.10 BDP International
- 13.2.10.1. Overview
- 13.2.10.2. Products
- 13.2.10.3. SWOT Analysis
- 13.2.10.4. Recent Developments
- 13.2.10.5. Financials (Based on Availability)
- 13.2.11 Rinchem
- 13.2.11.1. Overview
- 13.2.11.2. Products
- 13.2.11.3. SWOT Analysis
- 13.2.11.4. Recent Developments
- 13.2.11.5. Financials (Based on Availability)
- 13.2.12 Rhenus Logistics
- 13.2.12.1. Overview
- 13.2.12.2. Products
- 13.2.12.3. SWOT Analysis
- 13.2.12.4. Recent Developments
- 13.2.12.5. Financials (Based on Availability)
- 13.2.1 DHL
List of Figures
- Figure 1: Global ASEAN Chemical Logistics Market Revenue Breakdown (billion, %) by Region 2025 & 2033
- Figure 2: Singapore ASEAN Chemical Logistics Market Revenue (billion), by Service 2025 & 2033
- Figure 3: Singapore ASEAN Chemical Logistics Market Revenue Share (%), by Service 2025 & 2033
- Figure 4: Singapore ASEAN Chemical Logistics Market Revenue (billion), by Mode of Transportation 2025 & 2033
- Figure 5: Singapore ASEAN Chemical Logistics Market Revenue Share (%), by Mode of Transportation 2025 & 2033
- Figure 6: Singapore ASEAN Chemical Logistics Market Revenue (billion), by End User 2025 & 2033
- Figure 7: Singapore ASEAN Chemical Logistics Market Revenue Share (%), by End User 2025 & 2033
- Figure 8: Singapore ASEAN Chemical Logistics Market Revenue (billion), by Geography 2025 & 2033
- Figure 9: Singapore ASEAN Chemical Logistics Market Revenue Share (%), by Geography 2025 & 2033
- Figure 10: Singapore ASEAN Chemical Logistics Market Revenue (billion), by Country 2025 & 2033
- Figure 11: Singapore ASEAN Chemical Logistics Market Revenue Share (%), by Country 2025 & 2033
- Figure 12: Thailand ASEAN Chemical Logistics Market Revenue (billion), by Service 2025 & 2033
- Figure 13: Thailand ASEAN Chemical Logistics Market Revenue Share (%), by Service 2025 & 2033
- Figure 14: Thailand ASEAN Chemical Logistics Market Revenue (billion), by Mode of Transportation 2025 & 2033
- Figure 15: Thailand ASEAN Chemical Logistics Market Revenue Share (%), by Mode of Transportation 2025 & 2033
- Figure 16: Thailand ASEAN Chemical Logistics Market Revenue (billion), by End User 2025 & 2033
- Figure 17: Thailand ASEAN Chemical Logistics Market Revenue Share (%), by End User 2025 & 2033
- Figure 18: Thailand ASEAN Chemical Logistics Market Revenue (billion), by Geography 2025 & 2033
- Figure 19: Thailand ASEAN Chemical Logistics Market Revenue Share (%), by Geography 2025 & 2033
- Figure 20: Thailand ASEAN Chemical Logistics Market Revenue (billion), by Country 2025 & 2033
- Figure 21: Thailand ASEAN Chemical Logistics Market Revenue Share (%), by Country 2025 & 2033
- Figure 22: Malaysia ASEAN Chemical Logistics Market Revenue (billion), by Service 2025 & 2033
- Figure 23: Malaysia ASEAN Chemical Logistics Market Revenue Share (%), by Service 2025 & 2033
- Figure 24: Malaysia ASEAN Chemical Logistics Market Revenue (billion), by Mode of Transportation 2025 & 2033
- Figure 25: Malaysia ASEAN Chemical Logistics Market Revenue Share (%), by Mode of Transportation 2025 & 2033
- Figure 26: Malaysia ASEAN Chemical Logistics Market Revenue (billion), by End User 2025 & 2033
- Figure 27: Malaysia ASEAN Chemical Logistics Market Revenue Share (%), by End User 2025 & 2033
- Figure 28: Malaysia ASEAN Chemical Logistics Market Revenue (billion), by Geography 2025 & 2033
- Figure 29: Malaysia ASEAN Chemical Logistics Market Revenue Share (%), by Geography 2025 & 2033
- Figure 30: Malaysia ASEAN Chemical Logistics Market Revenue (billion), by Country 2025 & 2033
- Figure 31: Malaysia ASEAN Chemical Logistics Market Revenue Share (%), by Country 2025 & 2033
- Figure 32: Vietnam ASEAN Chemical Logistics Market Revenue (billion), by Service 2025 & 2033
- Figure 33: Vietnam ASEAN Chemical Logistics Market Revenue Share (%), by Service 2025 & 2033
- Figure 34: Vietnam ASEAN Chemical Logistics Market Revenue (billion), by Mode of Transportation 2025 & 2033
- Figure 35: Vietnam ASEAN Chemical Logistics Market Revenue Share (%), by Mode of Transportation 2025 & 2033
- Figure 36: Vietnam ASEAN Chemical Logistics Market Revenue (billion), by End User 2025 & 2033
- Figure 37: Vietnam ASEAN Chemical Logistics Market Revenue Share (%), by End User 2025 & 2033
- Figure 38: Vietnam ASEAN Chemical Logistics Market Revenue (billion), by Geography 2025 & 2033
- Figure 39: Vietnam ASEAN Chemical Logistics Market Revenue Share (%), by Geography 2025 & 2033
- Figure 40: Vietnam ASEAN Chemical Logistics Market Revenue (billion), by Country 2025 & 2033
- Figure 41: Vietnam ASEAN Chemical Logistics Market Revenue Share (%), by Country 2025 & 2033
- Figure 42: Indonesia ASEAN Chemical Logistics Market Revenue (billion), by Service 2025 & 2033
- Figure 43: Indonesia ASEAN Chemical Logistics Market Revenue Share (%), by Service 2025 & 2033
- Figure 44: Indonesia ASEAN Chemical Logistics Market Revenue (billion), by Mode of Transportation 2025 & 2033
- Figure 45: Indonesia ASEAN Chemical Logistics Market Revenue Share (%), by Mode of Transportation 2025 & 2033
- Figure 46: Indonesia ASEAN Chemical Logistics Market Revenue (billion), by End User 2025 & 2033
- Figure 47: Indonesia ASEAN Chemical Logistics Market Revenue Share (%), by End User 2025 & 2033
- Figure 48: Indonesia ASEAN Chemical Logistics Market Revenue (billion), by Geography 2025 & 2033
- Figure 49: Indonesia ASEAN Chemical Logistics Market Revenue Share (%), by Geography 2025 & 2033
- Figure 50: Indonesia ASEAN Chemical Logistics Market Revenue (billion), by Country 2025 & 2033
- Figure 51: Indonesia ASEAN Chemical Logistics Market Revenue Share (%), by Country 2025 & 2033
- Figure 52: Philippines ASEAN Chemical Logistics Market Revenue (billion), by Service 2025 & 2033
- Figure 53: Philippines ASEAN Chemical Logistics Market Revenue Share (%), by Service 2025 & 2033
- Figure 54: Philippines ASEAN Chemical Logistics Market Revenue (billion), by Mode of Transportation 2025 & 2033
- Figure 55: Philippines ASEAN Chemical Logistics Market Revenue Share (%), by Mode of Transportation 2025 & 2033
- Figure 56: Philippines ASEAN Chemical Logistics Market Revenue (billion), by End User 2025 & 2033
- Figure 57: Philippines ASEAN Chemical Logistics Market Revenue Share (%), by End User 2025 & 2033
- Figure 58: Philippines ASEAN Chemical Logistics Market Revenue (billion), by Geography 2025 & 2033
- Figure 59: Philippines ASEAN Chemical Logistics Market Revenue Share (%), by Geography 2025 & 2033
- Figure 60: Philippines ASEAN Chemical Logistics Market Revenue (billion), by Country 2025 & 2033
- Figure 61: Philippines ASEAN Chemical Logistics Market Revenue Share (%), by Country 2025 & 2033
- Figure 62: Rest of ASEAN ASEAN Chemical Logistics Market Revenue (billion), by Service 2025 & 2033
- Figure 63: Rest of ASEAN ASEAN Chemical Logistics Market Revenue Share (%), by Service 2025 & 2033
- Figure 64: Rest of ASEAN ASEAN Chemical Logistics Market Revenue (billion), by Mode of Transportation 2025 & 2033
- Figure 65: Rest of ASEAN ASEAN Chemical Logistics Market Revenue Share (%), by Mode of Transportation 2025 & 2033
- Figure 66: Rest of ASEAN ASEAN Chemical Logistics Market Revenue (billion), by End User 2025 & 2033
- Figure 67: Rest of ASEAN ASEAN Chemical Logistics Market Revenue Share (%), by End User 2025 & 2033
- Figure 68: Rest of ASEAN ASEAN Chemical Logistics Market Revenue (billion), by Geography 2025 & 2033
- Figure 69: Rest of ASEAN ASEAN Chemical Logistics Market Revenue Share (%), by Geography 2025 & 2033
- Figure 70: Rest of ASEAN ASEAN Chemical Logistics Market Revenue (billion), by Country 2025 & 2033
- Figure 71: Rest of ASEAN ASEAN Chemical Logistics Market Revenue Share (%), by Country 2025 & 2033
List of Tables
- Table 1: Global ASEAN Chemical Logistics Market Revenue billion Forecast, by Service 2020 & 2033
- Table 2: Global ASEAN Chemical Logistics Market Revenue billion Forecast, by Mode of Transportation 2020 & 2033
- Table 3: Global ASEAN Chemical Logistics Market Revenue billion Forecast, by End User 2020 & 2033
- Table 4: Global ASEAN Chemical Logistics Market Revenue billion Forecast, by Geography 2020 & 2033
- Table 5: Global ASEAN Chemical Logistics Market Revenue billion Forecast, by Region 2020 & 2033
- Table 6: Global ASEAN Chemical Logistics Market Revenue billion Forecast, by Service 2020 & 2033
- Table 7: Global ASEAN Chemical Logistics Market Revenue billion Forecast, by Mode of Transportation 2020 & 2033
- Table 8: Global ASEAN Chemical Logistics Market Revenue billion Forecast, by End User 2020 & 2033
- Table 9: Global ASEAN Chemical Logistics Market Revenue billion Forecast, by Geography 2020 & 2033
- Table 10: Global ASEAN Chemical Logistics Market Revenue billion Forecast, by Country 2020 & 2033
- Table 11: Global ASEAN Chemical Logistics Market Revenue billion Forecast, by Service 2020 & 2033
- Table 12: Global ASEAN Chemical Logistics Market Revenue billion Forecast, by Mode of Transportation 2020 & 2033
- Table 13: Global ASEAN Chemical Logistics Market Revenue billion Forecast, by End User 2020 & 2033
- Table 14: Global ASEAN Chemical Logistics Market Revenue billion Forecast, by Geography 2020 & 2033
- Table 15: Global ASEAN Chemical Logistics Market Revenue billion Forecast, by Country 2020 & 2033
- Table 16: Global ASEAN Chemical Logistics Market Revenue billion Forecast, by Service 2020 & 2033
- Table 17: Global ASEAN Chemical Logistics Market Revenue billion Forecast, by Mode of Transportation 2020 & 2033
- Table 18: Global ASEAN Chemical Logistics Market Revenue billion Forecast, by End User 2020 & 2033
- Table 19: Global ASEAN Chemical Logistics Market Revenue billion Forecast, by Geography 2020 & 2033
- Table 20: Global ASEAN Chemical Logistics Market Revenue billion Forecast, by Country 2020 & 2033
- Table 21: Global ASEAN Chemical Logistics Market Revenue billion Forecast, by Service 2020 & 2033
- Table 22: Global ASEAN Chemical Logistics Market Revenue billion Forecast, by Mode of Transportation 2020 & 2033
- Table 23: Global ASEAN Chemical Logistics Market Revenue billion Forecast, by End User 2020 & 2033
- Table 24: Global ASEAN Chemical Logistics Market Revenue billion Forecast, by Geography 2020 & 2033
- Table 25: Global ASEAN Chemical Logistics Market Revenue billion Forecast, by Country 2020 & 2033
- Table 26: Global ASEAN Chemical Logistics Market Revenue billion Forecast, by Service 2020 & 2033
- Table 27: Global ASEAN Chemical Logistics Market Revenue billion Forecast, by Mode of Transportation 2020 & 2033
- Table 28: Global ASEAN Chemical Logistics Market Revenue billion Forecast, by End User 2020 & 2033
- Table 29: Global ASEAN Chemical Logistics Market Revenue billion Forecast, by Geography 2020 & 2033
- Table 30: Global ASEAN Chemical Logistics Market Revenue billion Forecast, by Country 2020 & 2033
- Table 31: Global ASEAN Chemical Logistics Market Revenue billion Forecast, by Service 2020 & 2033
- Table 32: Global ASEAN Chemical Logistics Market Revenue billion Forecast, by Mode of Transportation 2020 & 2033
- Table 33: Global ASEAN Chemical Logistics Market Revenue billion Forecast, by End User 2020 & 2033
- Table 34: Global ASEAN Chemical Logistics Market Revenue billion Forecast, by Geography 2020 & 2033
- Table 35: Global ASEAN Chemical Logistics Market Revenue billion Forecast, by Country 2020 & 2033
- Table 36: Global ASEAN Chemical Logistics Market Revenue billion Forecast, by Service 2020 & 2033
- Table 37: Global ASEAN Chemical Logistics Market Revenue billion Forecast, by Mode of Transportation 2020 & 2033
- Table 38: Global ASEAN Chemical Logistics Market Revenue billion Forecast, by End User 2020 & 2033
- Table 39: Global ASEAN Chemical Logistics Market Revenue billion Forecast, by Geography 2020 & 2033
- Table 40: Global ASEAN Chemical Logistics Market Revenue billion Forecast, by Country 2020 & 2033
Frequently Asked Questions
1. What is the projected Compound Annual Growth Rate (CAGR) of the ASEAN Chemical Logistics Market?
The projected CAGR is approximately 9.53%.
2. Which companies are prominent players in the ASEAN Chemical Logistics Market?
Key companies in the market include DHL, A&R Logistics, JWD InfoLogistics Public Company Limited, Alps Logistics**List Not Exhaustive, CEVA Logistics, Agility Logistics, CT Logistics, Tiong Nam Logistics Holdings BhD, Eagles Air & Sea, BDP International, Rinchem, Rhenus Logistics.
3. What are the main segments of the ASEAN Chemical Logistics Market?
The market segments include Service, Mode of Transportation, End User, Geography.
4. Can you provide details about the market size?
The market size is estimated to be USD 47.53 billion as of 2022.
5. What are some drivers contributing to market growth?
The Rise in Demand for Specialty Chemicals in ASEAN Countries Increasing Trade Logistics Activity; Partnerships and Collaborations Between Major Players in the Chemical Logistics Market are Being Formed for the Creation of Innovative Goods and Technologically Enhanced Services.
6. What are the notable trends driving market growth?
The Rise in Chemical Production is Expected to Propel the Growth of the Chemical Logistics Market.
7. Are there any restraints impacting market growth?
Complexities Related to Chemical Logistics; High Cost Involved in the Transportation of Chemicals.
8. Can you provide examples of recent developments in the market?
October 2022: Rinchem is nearing the completion of a brand-new chemical warehouse based in Malaysia slated to be ready in Q2 of 2023. While the company currently has two other warehouses in the Asia Pacific (Taiwan & South Korea), this will be Rinchem's first warehouse located in Malaysia. The 45,000 sq. ft. dangerous goods warehouse will have the capacity to store 3100 pallet positions. Rinchem's warehouses are custom-built to support the proper segregation of various hazard classes and to offer multiple temperature zones.
9. What pricing options are available for accessing the report?
Pricing options include single-user, multi-user, and enterprise licenses priced at USD 4750, USD 5250, and USD 8750 respectively.
10. Is the market size provided in terms of value or volume?
The market size is provided in terms of value, measured in billion.
11. Are there any specific market keywords associated with the report?
Yes, the market keyword associated with the report is "ASEAN Chemical Logistics Market," which aids in identifying and referencing the specific market segment covered.
12. How do I determine which pricing option suits my needs best?
The pricing options vary based on user requirements and access needs. Individual users may opt for single-user licenses, while businesses requiring broader access may choose multi-user or enterprise licenses for cost-effective access to the report.
13. Are there any additional resources or data provided in the ASEAN Chemical Logistics Market report?
While the report offers comprehensive insights, it's advisable to review the specific contents or supplementary materials provided to ascertain if additional resources or data are available.
14. How can I stay updated on further developments or reports in the ASEAN Chemical Logistics Market?
To stay informed about further developments, trends, and reports in the ASEAN Chemical Logistics Market, consider subscribing to industry newsletters, following relevant companies and organizations, or regularly checking reputable industry news sources and publications.
Methodology
Step 1 - Identification of Relevant Samples Size from Population Database


Step 2 - Approaches for Defining Global Market Size (Value, Volume* & Price*)

Note*: In applicable scenarios
Step 3 - Data Sources
Primary Research
- Web Analytics
- Survey Reports
- Research Institute
- Latest Research Reports
- Opinion Leaders
Secondary Research
- Annual Reports
- White Paper
- Latest Press Release
- Industry Association
- Paid Database
- Investor Presentations

Step 4 - Data Triangulation
Involves using different sources of information in order to increase the validity of a study
These sources are likely to be stakeholders in a program - participants, other researchers, program staff, other community members, and so on.
Then we put all data in single framework & apply various statistical tools to find out the dynamic on the market.
During the analysis stage, feedback from the stakeholder groups would be compared to determine areas of agreement as well as areas of divergence