

Key Insights
The Augmented Reality (AR) and Virtual Reality (VR) solutions market for commercial applications is poised for explosive growth, with an estimated market size of $40.62 billion in 2025. This remarkable expansion is fueled by a CAGR of 39.62% over the forecast period. The primary drivers behind this surge are the increasing adoption of AR/VR in retail and e-commerce for immersive shopping experiences, the transformative potential of e-learning platforms that offer engaging and interactive educational content, and the revolution in tourism and sightseeing, enabling virtual exploration and planning. Furthermore, advertising sectors are leveraging AR/VR for novel and impactful campaigns, while a wide array of "Other" applications are emerging across various industries, showcasing the technology's versatility. The market is characterized by continuous innovation in both hardware and software segments, with advancements in headsets, haptic feedback devices, AR glasses, and sophisticated AR/VR software platforms and services driving deeper integration into commercial workflows.
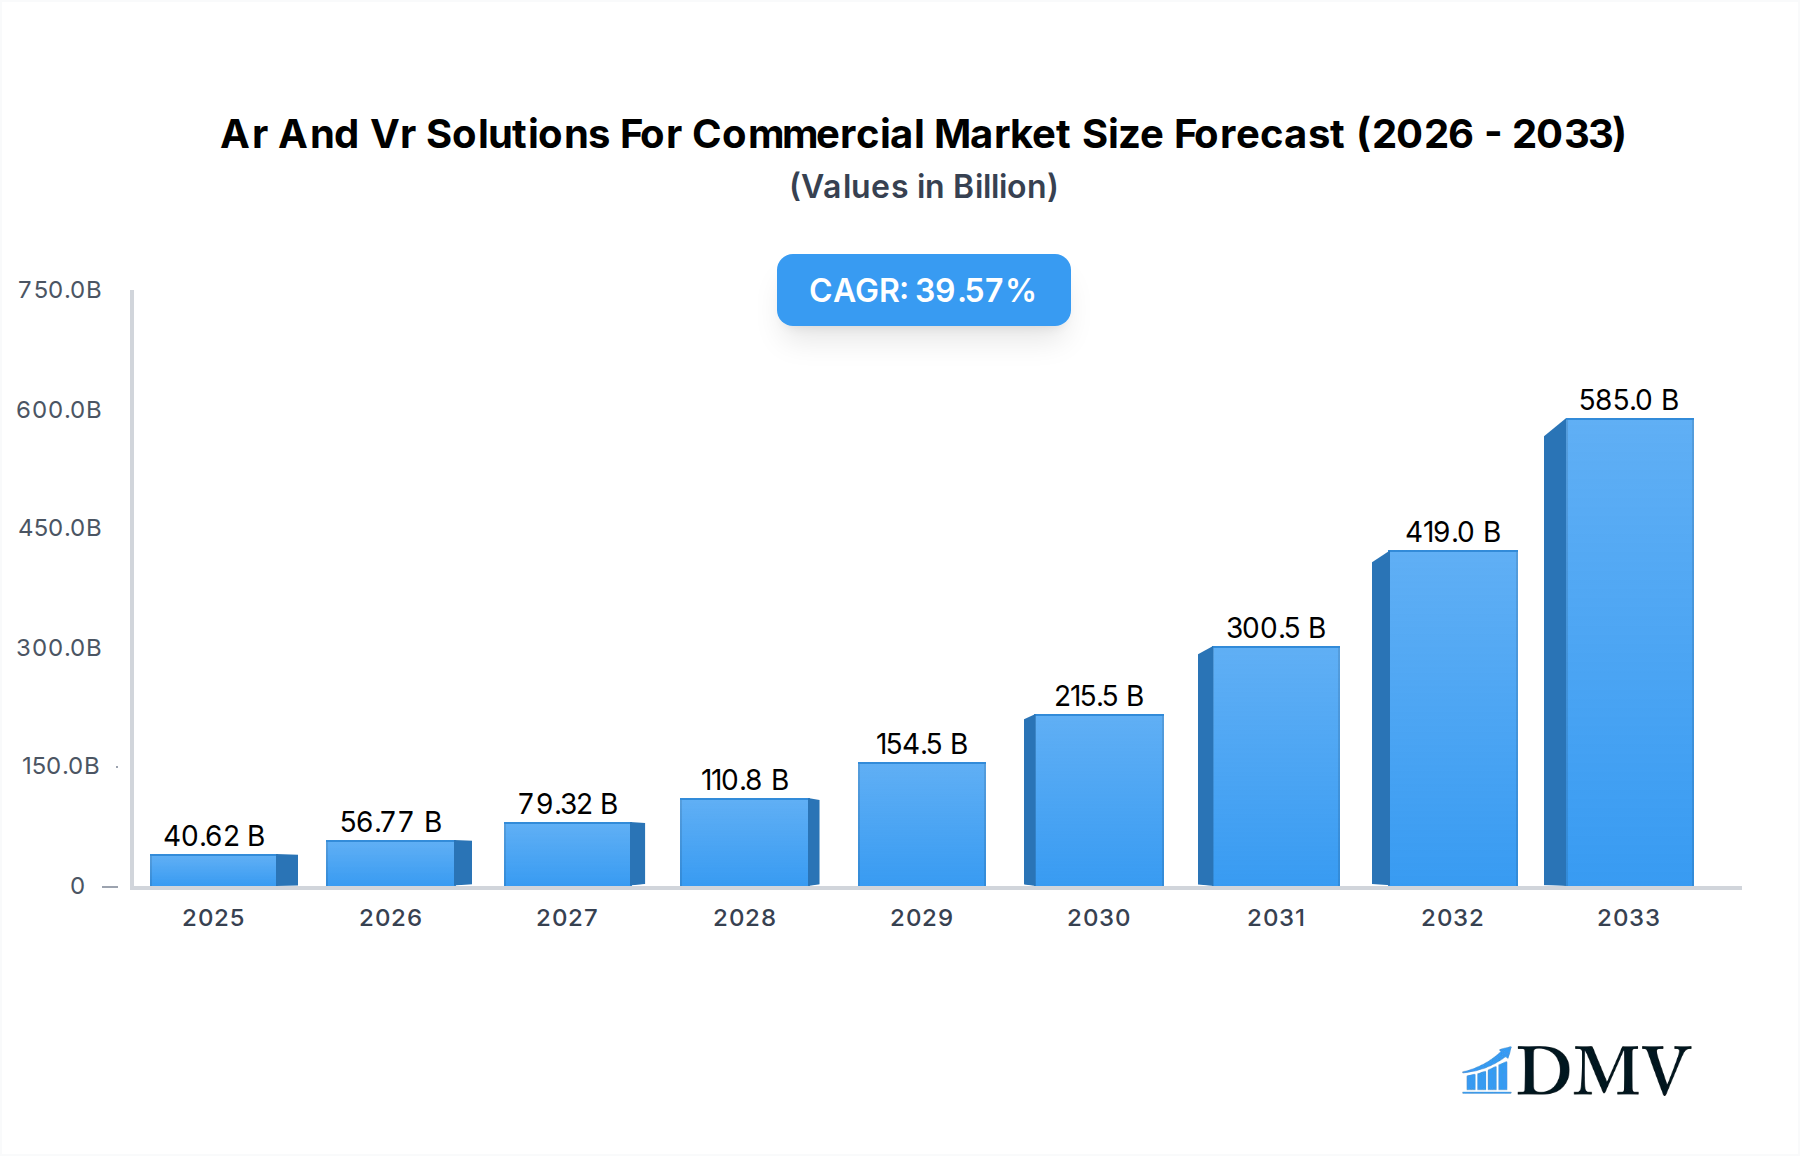
Ar And Vr Solutions For Commercial Market Size (In Billion)
The AR/VR solutions market for commercial use is expected to witness significant progress, with projected revenue reaching substantial figures by 2033, building upon the $40.62 billion valuation in 2025. While the demand for advanced hardware and sophisticated software solutions is a strong growth catalyst, certain restraints, such as the initial high cost of implementation for some enterprises and the need for robust infrastructure to support complex AR/VR experiences, could temper the pace of adoption in specific niche segments. However, these challenges are steadily being addressed through technological advancements and increasing economies of scale. Key players like Google, Microsoft, Oculus VR (Facebook), Sony, and Samsung Electronics are leading the charge with innovative product development and strategic partnerships, pushing the boundaries of what's possible. The geographical landscape is dominated by North America and Asia Pacific, with Europe also showing strong adoption rates, indicating a global appetite for these transformative commercial solutions.

Ar And Vr Solutions For Commercial Company Market Share
Ar And Vr Solutions For Commercial Market Composition & Trends
The Ar and VR solutions for commercial market is characterized by a dynamic and evolving landscape, projected to reach an estimated valuation of $475.6 billion by 2025. This burgeoning market's composition is shaped by intense innovation, driven by technology giants like Google, Microsoft, Oculus VR (Facebook), Sony, Samsung Electronics, and Apple, alongside specialized players such as Magic Leap and HTC. Market concentration is moderately high, with these key entities investing billions in research and development. Innovation catalysts are abundant, fueled by the relentless pursuit of immersive experiences and practical business applications. Regulatory landscapes, while still forming, are beginning to address data privacy and content moderation, impacting the ethical deployment of these technologies. Substitute products, primarily traditional digital solutions, are steadily being displaced by the superior engagement and efficiency offered by AR and VR. End-user profiles are diverse, encompassing businesses across retail, e-learning, tourism, advertising, and a broad spectrum of other industries seeking transformative operational improvements. Mergers and acquisitions (M&A) are a significant feature, with deal values in the billions constantly reshaping the competitive arena. For instance, key M&A activities in the historical period (2019-2024) have seen strategic acquisitions aimed at consolidating market share and acquiring critical intellectual property, with estimated deal values reaching in excess of $10 billion annually. The market share distribution is increasingly tilting towards integrated hardware and software providers, offering end-to-end solutions.
- Market Concentration: Moderately high, with significant investment from major tech corporations.
- Innovation Catalysts: Driven by the quest for immersive experiences and practical business applications.
- Regulatory Landscapes: Emerging, with initial focus on data privacy and content.
- Substitute Products: Traditional digital solutions, increasingly being outperformed.
- End-User Profiles: Diverse, spanning retail, education, tourism, advertising, and beyond.
- M&A Activities: Frequent and significant, with billion-dollar deals reshaping the market.
Ar And Vr Solutions For Commercial Industry Evolution
The evolution of Ar and VR solutions for commercial applications has been nothing short of revolutionary, demonstrating robust market growth trajectories and profound technological advancements that are fundamentally reshaping industries. From its nascent stages, the market has witnessed an exponential increase in adoption rates across various sectors. The historical period from 2019 to 2024 saw the market mature from niche applications to mainstream commercial viability, with a Compound Annual Growth Rate (CAGR) estimated at an impressive 35.8%. This growth has been propelled by continuous innovation in hardware, including the development of more sophisticated headsets, AR glasses, and haptic feedback devices by companies like Oculus VR (Facebook), HTC, and Vuzix, alongside advancements in mobile AR capabilities by Google and Apple. Simultaneously, software development has surged, with platforms and tools from Microsoft, PTC, and Wikitude GmbH enabling richer, more interactive experiences. Consumer demand is increasingly shifting towards immersive and personalized interactions, pushing businesses to invest in AR and VR for enhanced customer engagement, training, and operational efficiency. For example, the retail and e-commerce segment has seen a remarkable surge, with virtual try-on features and immersive product demonstrations leading to an estimated 20% increase in conversion rates for early adopters. E-learning platforms are leveraging VR for realistic simulations, improving knowledge retention by an estimated 25%. The tourism and sightseeing industry is experiencing a revival through virtual tours and augmented reality overlays, offering a new dimension to exploration. Advertising is also embracing AR/VR for captivating campaigns, leading to higher engagement metrics and brand recall. The estimated market size in the base year of 2025 is projected to be $475.6 billion, a testament to the rapid and widespread integration of these technologies. Looking ahead, the forecast period of 2025–2033 anticipates continued exponential growth, with projections indicating a market valuation potentially exceeding $1.2 trillion by the end of the forecast period, driven by further technological breakthroughs and broader industry adoption. The increasing affordability and accessibility of AR/VR hardware, coupled with the development of user-friendly software development kits (SDKs), are key factors contributing to this sustained upward trend.
Leading Regions, Countries, or Segments in Ar And Vr Solutions For Commercial
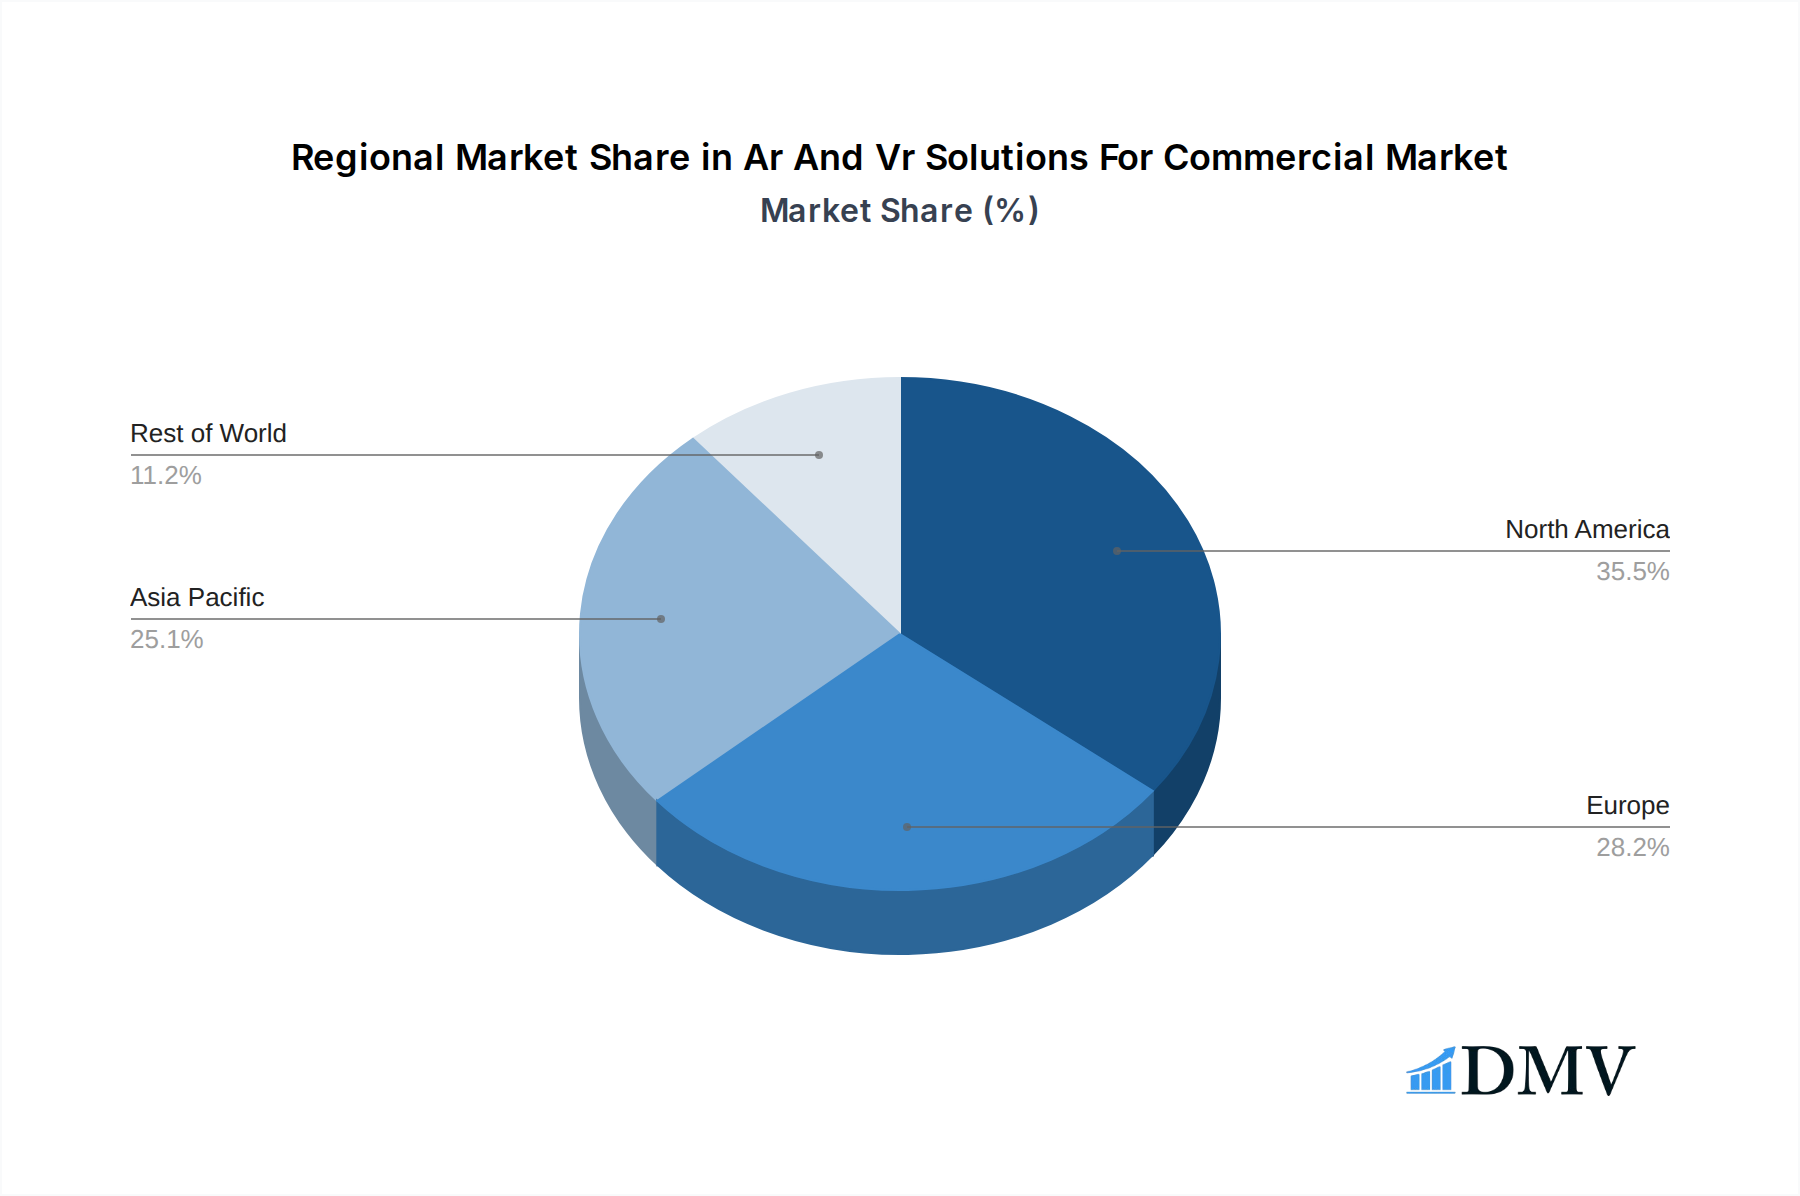
The global Ar and VR solutions for commercial market exhibits distinct leadership across specific regions, countries, and industry segments, driven by a confluence of investment trends, technological adoption rates, and supportive regulatory frameworks. North America, particularly the United States, has consistently emerged as a dominant region. This leadership is underpinned by substantial venture capital investments exceeding billions annually, a high concentration of leading technology companies like Google, Microsoft, Oculus VR (Facebook), Magic Leap, and Apple, and a proactive approach to embracing new technologies across diverse commercial sectors. The robust ecosystem of startups and established players fosters rapid innovation and market penetration.
Among the segments, Retail & E-commerce stands out as a primary driver of AR/VR adoption. The ability of these technologies to provide immersive product experiences, virtual try-ons, and personalized shopping journeys has led to significant investment and demonstrable ROI for businesses. Companies are leveraging AR/VR to bridge the gap between online and offline retail, offering customers unparalleled convenience and engagement. The estimated market share for Retail & E-commerce in the AR/VR solutions for commercial sector is projected to reach over 25% by 2025, with an estimated market value of over $100 billion.
Another rapidly growing segment is E-Learning. The immersive and interactive nature of AR/VR is revolutionizing educational and corporate training programs. These solutions enable realistic simulations for hands-on learning, skill development, and complex scenario training, leading to improved knowledge retention and reduced training costs. Investment in this segment has seen substantial growth, with educational institutions and corporations alike investing billions in VR-based training modules.
The Type: Software and Services segment is also experiencing significant leadership. As hardware becomes more commoditized, the value creation is increasingly shifting towards sophisticated software platforms, content creation tools, and integration services. Companies like PTC, Wikitude GmbH, and Eon Reality are at the forefront of developing these critical software solutions that enable businesses to unlock the full potential of AR/VR. The demand for specialized AR/VR development services, consultancy, and content creation is escalating, with service revenues projected to grow by over 40% annually in the coming years.
Key drivers for this dominance include:
- Investment Trends: Billions in venture capital funding and corporate R&D, particularly in North America and by leading companies such as Google, Microsoft, and Apple.
- Technological Infrastructure: Availability of high-speed internet, advanced mobile devices, and early adoption of cutting-edge hardware from companies like Oculus VR (Facebook) and HTC.
- Regulatory Support & Favorable Policies: Government initiatives promoting technological innovation and adoption, though specific AR/VR regulations are still evolving.
- Consumer Demand for Immersive Experiences: A growing appetite for interactive and engaging content in retail, entertainment, and education, driving adoption in segments like Retail & E-commerce and E-Learning.
- Industry-Specific Applications: The clear utility and demonstrable ROI of AR/VR solutions in sectors like manufacturing (virtual prototyping), healthcare (surgical training), and logistics (warehouse navigation), further solidifying the dominance of software and services.
Ar And Vr Solutions For Commercial Product Innovations
Product innovation in Ar and VR solutions for commercial applications is characterized by a relentless drive towards enhancing immersion, utility, and accessibility. Recent advancements include the development of lightweight, high-resolution AR glasses by companies like Vuzix and Osterhout Design Group, offering seamless integration of digital information into the real world. Concurrently, VR headsets are becoming more powerful and comfortable, exemplified by Sony's offerings and Oculus VR's (Facebook) continuous upgrades, enabling sophisticated virtual environments for training, design, and collaboration. Software innovations are equally critical, with platforms from PTC and MAXST enabling easier development of AR applications, while Blippar and Wikitude GmbH focus on intuitive content creation tools. Performance metrics such as reduced latency, increased field of view, and improved spatial tracking are key differentiators, with leading solutions achieving near-real-time interaction. Unique selling propositions often lie in industry-specific functionalities, such as Upskill's AR solutions for industrial workers or Continental's AR-powered navigation systems for automotive.
Propelling Factors for Ar And Vr Solutions For Commercial Growth
The growth of Ar and VR solutions for commercial applications is propelled by a potent combination of technological advancements, economic drivers, and evolving industry needs. The continuous refinement of hardware, including lighter, more powerful headsets and AR glasses from players like Oculus VR (Facebook), HTC, and Vuzix, coupled with the increasing processing power of mobile devices, makes these solutions more accessible and practical. Economic factors such as the demonstrable ROI in training and operational efficiency, with companies like Upskill showcasing significant productivity gains, are driving substantial investment. Furthermore, the increasing demand for enhanced customer engagement in sectors like Retail & E-commerce, with companies exploring virtual try-ons and immersive product displays, acts as a significant catalyst. Government initiatives and industry consortia are also playing a role in fostering adoption and setting standards.
Obstacles in the Ar And Vr Solutions For Commercial Market
Despite the immense potential, the Ar and VR solutions for commercial market faces several significant obstacles. The initial high cost of advanced hardware, particularly for enterprise-grade VR systems from companies like Sony and Magic Leap, can be a barrier to widespread adoption for smaller businesses, with initial deployment costs potentially running into millions for large-scale implementations. Technical limitations, such as limited battery life, motion sickness for some users, and the need for robust computing power, still exist. Furthermore, the development of compelling and scalable content requires specialized skills and significant investment, hindering the creation of a rich content ecosystem. Regulatory uncertainties surrounding data privacy, intellectual property, and ethical usage of AR/VR technologies also present challenges, creating a complex compliance landscape for companies like Google and Microsoft. Supply chain disruptions for specialized components can also impact production and availability, leading to extended lead times and increased costs, potentially delaying projects valued in the hundreds of millions.
Future Opportunities in Ar And Vr Solutions For Commercial
The future for Ar and VR solutions for commercial applications is rife with burgeoning opportunities, driven by emerging markets and evolving consumer and business needs. The expansion of the metaverse concept presents a significant new frontier for immersive digital interactions, collaborative workspaces, and virtual commerce, creating a demand for sophisticated AR/VR solutions from companies like Meta (Oculus VR) and Microsoft. Advancements in AI and machine learning will further enhance the intelligence and responsiveness of AR/VR environments, enabling more personalized and predictive experiences. The increasing adoption of 5G technology will facilitate seamless, high-bandwidth AR/VR experiences, overcoming current connectivity limitations. Emerging markets in Asia and Africa are poised for rapid growth as the technology becomes more affordable and accessible. Furthermore, the integration of AR/VR with IoT devices will unlock new possibilities in industrial automation, smart cities, and remote healthcare, creating multi-billion dollar revenue streams.
Major Players in the Ar And Vr Solutions For Commercial Ecosystem
- Microsoft
- Oculus VR (Facebook)
- Sony
- Samsung Electronics
- HTC
- PTC
- Wikitude GmbH
- Magic Leap
- Osterhout Design Group
- Daqri
- Blippar
- Upskill
- Continental
- Visteon
- Eon Reality
- Vuzix
- Zugara
- MAXST
- Infinity Augmented Reality
- Apple
- Intel
Key Developments in Ar And Vr Solutions For Commercial Industry
- 2023/08: Apple unveils its highly anticipated Vision Pro headset, signaling a significant push into the spatial computing market, potentially worth billions in future hardware sales.
- 2023/07: Microsoft announces further integration of its Mixed Reality Toolkit (MRTK) with Azure, enhancing enterprise AR/VR development capabilities and aiming for multi-billion dollar enterprise solutions.
- 2023/05: Meta (Oculus VR) releases Quest 3, a more affordable and powerful VR headset, aiming to drive wider consumer and commercial adoption, with sales projected to reach millions of units.
- 2022/11: Google demonstrates advanced AR capabilities within its Search and Maps applications, showcasing the potential for billions of users to access augmented information daily.
- 2022/09: HTC launches Vive XR Elite, a versatile headset designed for both VR and AR, targeting enterprise use cases with an estimated market potential in the billions.
- 2021/12: PTC acquires a leading AR analytics platform, bolstering its Vuforia suite and strengthening its position in the industrial AR market, a sector valued in the billions.
- 2021/07: Samsung Electronics announces its strategy to integrate AR features into its flagship smartphones, expanding the reach of AR to hundreds of millions of users and generating billions in associated service revenue.
Strategic Ar And Vr Solutions For Commercial Market Forecast
The strategic outlook for Ar and VR solutions for commercial applications is exceptionally promising, driven by an accelerating pace of innovation and increasing enterprise adoption across diverse sectors. The forecast period of 2025–2033 anticipates robust growth, with market expansion fueled by the ongoing development of more intuitive and powerful hardware from giants like Apple and Meta (Oculus VR), and sophisticated software platforms from leaders like Microsoft and PTC. The continuous emergence of compelling use cases in retail, e-learning, tourism, and advertising, coupled with significant investments in the underlying technological infrastructure, will solidify AR/VR's position as a transformative force. As these technologies become more integrated into daily business operations, the market is projected to not only meet but exceed current estimations, unlocking billions in new revenue streams and operational efficiencies for businesses worldwide.
Ar And Vr Solutions For Commercial Segmentation
-
1. Application
- 1.1. Retail & E-commerce
- 1.2. E- Learning
- 1.3. Tourism and Sight Seeing
- 1.4. Advertising
- 1.5. Others
-
2. Type
- 2.1. Hardware and Devices
- 2.2. Software and Services
Ar And Vr Solutions For Commercial Segmentation By Geography
-
1. North America
- 1.1. United States
- 1.2. Canada
- 1.3. Mexico
-
2. South America
- 2.1. Brazil
- 2.2. Argentina
- 2.3. Rest of South America
-
3. Europe
- 3.1. United Kingdom
- 3.2. Germany
- 3.3. France
- 3.4. Italy
- 3.5. Spain
- 3.6. Russia
- 3.7. Benelux
- 3.8. Nordics
- 3.9. Rest of Europe
-
4. Middle East & Africa
- 4.1. Turkey
- 4.2. Israel
- 4.3. GCC
- 4.4. North Africa
- 4.5. South Africa
- 4.6. Rest of Middle East & Africa
-
5. Asia Pacific
- 5.1. China
- 5.2. India
- 5.3. Japan
- 5.4. South Korea
- 5.5. ASEAN
- 5.6. Oceania
- 5.7. Rest of Asia Pacific
Ar And Vr Solutions For Commercial Regional Market Share
Geographic Coverage of Ar And Vr Solutions For Commercial
Ar And Vr Solutions For Commercial REPORT HIGHLIGHTS
| Aspects | Details |
|---|---|
| Study Period | 2020-2034 |
| Base Year | 2025 |
| Estimated Year | 2026 |
| Forecast Period | 2026-2034 |
| Historical Period | 2020-2025 |
| Growth Rate | CAGR of 39.62% from 2020-2034 |
| Segmentation |
|
Table of Contents
- 1. Introduction
- 1.1. Research Scope
- 1.2. Market Segmentation
- 1.3. Research Methodology
- 1.4. Definitions and Assumptions
- 2. Executive Summary
- 2.1. Introduction
- 3. Market Dynamics
- 3.1. Introduction
- 3.2. Market Drivers
- 3.3. Market Restrains
- 3.4. Market Trends
- 4. Market Factor Analysis
- 4.1. Porters Five Forces
- 4.2. Supply/Value Chain
- 4.3. PESTEL analysis
- 4.4. Market Entropy
- 4.5. Patent/Trademark Analysis
- 5. Global Ar And Vr Solutions For Commercial Analysis, Insights and Forecast, 2020-2032
- 5.1. Market Analysis, Insights and Forecast - by Application
- 5.1.1. Retail & E-commerce
- 5.1.2. E- Learning
- 5.1.3. Tourism and Sight Seeing
- 5.1.4. Advertising
- 5.1.5. Others
- 5.2. Market Analysis, Insights and Forecast - by Type
- 5.2.1. Hardware and Devices
- 5.2.2. Software and Services
- 5.3. Market Analysis, Insights and Forecast - by Region
- 5.3.1. North America
- 5.3.2. South America
- 5.3.3. Europe
- 5.3.4. Middle East & Africa
- 5.3.5. Asia Pacific
- 5.1. Market Analysis, Insights and Forecast - by Application
- 6. North America Ar And Vr Solutions For Commercial Analysis, Insights and Forecast, 2020-2032
- 6.1. Market Analysis, Insights and Forecast - by Application
- 6.1.1. Retail & E-commerce
- 6.1.2. E- Learning
- 6.1.3. Tourism and Sight Seeing
- 6.1.4. Advertising
- 6.1.5. Others
- 6.2. Market Analysis, Insights and Forecast - by Type
- 6.2.1. Hardware and Devices
- 6.2.2. Software and Services
- 6.1. Market Analysis, Insights and Forecast - by Application
- 7. South America Ar And Vr Solutions For Commercial Analysis, Insights and Forecast, 2020-2032
- 7.1. Market Analysis, Insights and Forecast - by Application
- 7.1.1. Retail & E-commerce
- 7.1.2. E- Learning
- 7.1.3. Tourism and Sight Seeing
- 7.1.4. Advertising
- 7.1.5. Others
- 7.2. Market Analysis, Insights and Forecast - by Type
- 7.2.1. Hardware and Devices
- 7.2.2. Software and Services
- 7.1. Market Analysis, Insights and Forecast - by Application
- 8. Europe Ar And Vr Solutions For Commercial Analysis, Insights and Forecast, 2020-2032
- 8.1. Market Analysis, Insights and Forecast - by Application
- 8.1.1. Retail & E-commerce
- 8.1.2. E- Learning
- 8.1.3. Tourism and Sight Seeing
- 8.1.4. Advertising
- 8.1.5. Others
- 8.2. Market Analysis, Insights and Forecast - by Type
- 8.2.1. Hardware and Devices
- 8.2.2. Software and Services
- 8.1. Market Analysis, Insights and Forecast - by Application
- 9. Middle East & Africa Ar And Vr Solutions For Commercial Analysis, Insights and Forecast, 2020-2032
- 9.1. Market Analysis, Insights and Forecast - by Application
- 9.1.1. Retail & E-commerce
- 9.1.2. E- Learning
- 9.1.3. Tourism and Sight Seeing
- 9.1.4. Advertising
- 9.1.5. Others
- 9.2. Market Analysis, Insights and Forecast - by Type
- 9.2.1. Hardware and Devices
- 9.2.2. Software and Services
- 9.1. Market Analysis, Insights and Forecast - by Application
- 10. Asia Pacific Ar And Vr Solutions For Commercial Analysis, Insights and Forecast, 2020-2032
- 10.1. Market Analysis, Insights and Forecast - by Application
- 10.1.1. Retail & E-commerce
- 10.1.2. E- Learning
- 10.1.3. Tourism and Sight Seeing
- 10.1.4. Advertising
- 10.1.5. Others
- 10.2. Market Analysis, Insights and Forecast - by Type
- 10.2.1. Hardware and Devices
- 10.2.2. Software and Services
- 10.1. Market Analysis, Insights and Forecast - by Application
- 11. Competitive Analysis
- 11.1. Global Market Share Analysis 2025
- 11.2. Company Profiles
- 11.2.1 Google
- 11.2.1.1. Overview
- 11.2.1.2. Products
- 11.2.1.3. SWOT Analysis
- 11.2.1.4. Recent Developments
- 11.2.1.5. Financials (Based on Availability)
- 11.2.2 Microsoft
- 11.2.2.1. Overview
- 11.2.2.2. Products
- 11.2.2.3. SWOT Analysis
- 11.2.2.4. Recent Developments
- 11.2.2.5. Financials (Based on Availability)
- 11.2.3 Oculus VR (Facebook)
- 11.2.3.1. Overview
- 11.2.3.2. Products
- 11.2.3.3. SWOT Analysis
- 11.2.3.4. Recent Developments
- 11.2.3.5. Financials (Based on Availability)
- 11.2.4 Sony
- 11.2.4.1. Overview
- 11.2.4.2. Products
- 11.2.4.3. SWOT Analysis
- 11.2.4.4. Recent Developments
- 11.2.4.5. Financials (Based on Availability)
- 11.2.5 Samsung Electronics
- 11.2.5.1. Overview
- 11.2.5.2. Products
- 11.2.5.3. SWOT Analysis
- 11.2.5.4. Recent Developments
- 11.2.5.5. Financials (Based on Availability)
- 11.2.6 HTC
- 11.2.6.1. Overview
- 11.2.6.2. Products
- 11.2.6.3. SWOT Analysis
- 11.2.6.4. Recent Developments
- 11.2.6.5. Financials (Based on Availability)
- 11.2.7 PTC
- 11.2.7.1. Overview
- 11.2.7.2. Products
- 11.2.7.3. SWOT Analysis
- 11.2.7.4. Recent Developments
- 11.2.7.5. Financials (Based on Availability)
- 11.2.8 Wikitude GmbH
- 11.2.8.1. Overview
- 11.2.8.2. Products
- 11.2.8.3. SWOT Analysis
- 11.2.8.4. Recent Developments
- 11.2.8.5. Financials (Based on Availability)
- 11.2.9 Magic Leap
- 11.2.9.1. Overview
- 11.2.9.2. Products
- 11.2.9.3. SWOT Analysis
- 11.2.9.4. Recent Developments
- 11.2.9.5. Financials (Based on Availability)
- 11.2.10 Osterhout Design Group
- 11.2.10.1. Overview
- 11.2.10.2. Products
- 11.2.10.3. SWOT Analysis
- 11.2.10.4. Recent Developments
- 11.2.10.5. Financials (Based on Availability)
- 11.2.11 Daqri
- 11.2.11.1. Overview
- 11.2.11.2. Products
- 11.2.11.3. SWOT Analysis
- 11.2.11.4. Recent Developments
- 11.2.11.5. Financials (Based on Availability)
- 11.2.12 Blippar
- 11.2.12.1. Overview
- 11.2.12.2. Products
- 11.2.12.3. SWOT Analysis
- 11.2.12.4. Recent Developments
- 11.2.12.5. Financials (Based on Availability)
- 11.2.13 Upskill
- 11.2.13.1. Overview
- 11.2.13.2. Products
- 11.2.13.3. SWOT Analysis
- 11.2.13.4. Recent Developments
- 11.2.13.5. Financials (Based on Availability)
- 11.2.14 Continental
- 11.2.14.1. Overview
- 11.2.14.2. Products
- 11.2.14.3. SWOT Analysis
- 11.2.14.4. Recent Developments
- 11.2.14.5. Financials (Based on Availability)
- 11.2.15 Visteon
- 11.2.15.1. Overview
- 11.2.15.2. Products
- 11.2.15.3. SWOT Analysis
- 11.2.15.4. Recent Developments
- 11.2.15.5. Financials (Based on Availability)
- 11.2.16 Eon Reality
- 11.2.16.1. Overview
- 11.2.16.2. Products
- 11.2.16.3. SWOT Analysis
- 11.2.16.4. Recent Developments
- 11.2.16.5. Financials (Based on Availability)
- 11.2.17 Vuzix
- 11.2.17.1. Overview
- 11.2.17.2. Products
- 11.2.17.3. SWOT Analysis
- 11.2.17.4. Recent Developments
- 11.2.17.5. Financials (Based on Availability)
- 11.2.18 Zugara
- 11.2.18.1. Overview
- 11.2.18.2. Products
- 11.2.18.3. SWOT Analysis
- 11.2.18.4. Recent Developments
- 11.2.18.5. Financials (Based on Availability)
- 11.2.19 MAXST
- 11.2.19.1. Overview
- 11.2.19.2. Products
- 11.2.19.3. SWOT Analysis
- 11.2.19.4. Recent Developments
- 11.2.19.5. Financials (Based on Availability)
- 11.2.20 Infinity Augmented Reality
- 11.2.20.1. Overview
- 11.2.20.2. Products
- 11.2.20.3. SWOT Analysis
- 11.2.20.4. Recent Developments
- 11.2.20.5. Financials (Based on Availability)
- 11.2.21 Apple
- 11.2.21.1. Overview
- 11.2.21.2. Products
- 11.2.21.3. SWOT Analysis
- 11.2.21.4. Recent Developments
- 11.2.21.5. Financials (Based on Availability)
- 11.2.22 Intel
- 11.2.22.1. Overview
- 11.2.22.2. Products
- 11.2.22.3. SWOT Analysis
- 11.2.22.4. Recent Developments
- 11.2.22.5. Financials (Based on Availability)
- 11.2.1 Google
List of Figures
- Figure 1: Global Ar And Vr Solutions For Commercial Revenue Breakdown (undefined, %) by Region 2025 & 2033
- Figure 2: North America Ar And Vr Solutions For Commercial Revenue (undefined), by Application 2025 & 2033
- Figure 3: North America Ar And Vr Solutions For Commercial Revenue Share (%), by Application 2025 & 2033
- Figure 4: North America Ar And Vr Solutions For Commercial Revenue (undefined), by Type 2025 & 2033
- Figure 5: North America Ar And Vr Solutions For Commercial Revenue Share (%), by Type 2025 & 2033
- Figure 6: North America Ar And Vr Solutions For Commercial Revenue (undefined), by Country 2025 & 2033
- Figure 7: North America Ar And Vr Solutions For Commercial Revenue Share (%), by Country 2025 & 2033
- Figure 8: South America Ar And Vr Solutions For Commercial Revenue (undefined), by Application 2025 & 2033
- Figure 9: South America Ar And Vr Solutions For Commercial Revenue Share (%), by Application 2025 & 2033
- Figure 10: South America Ar And Vr Solutions For Commercial Revenue (undefined), by Type 2025 & 2033
- Figure 11: South America Ar And Vr Solutions For Commercial Revenue Share (%), by Type 2025 & 2033
- Figure 12: South America Ar And Vr Solutions For Commercial Revenue (undefined), by Country 2025 & 2033
- Figure 13: South America Ar And Vr Solutions For Commercial Revenue Share (%), by Country 2025 & 2033
- Figure 14: Europe Ar And Vr Solutions For Commercial Revenue (undefined), by Application 2025 & 2033
- Figure 15: Europe Ar And Vr Solutions For Commercial Revenue Share (%), by Application 2025 & 2033
- Figure 16: Europe Ar And Vr Solutions For Commercial Revenue (undefined), by Type 2025 & 2033
- Figure 17: Europe Ar And Vr Solutions For Commercial Revenue Share (%), by Type 2025 & 2033
- Figure 18: Europe Ar And Vr Solutions For Commercial Revenue (undefined), by Country 2025 & 2033
- Figure 19: Europe Ar And Vr Solutions For Commercial Revenue Share (%), by Country 2025 & 2033
- Figure 20: Middle East & Africa Ar And Vr Solutions For Commercial Revenue (undefined), by Application 2025 & 2033
- Figure 21: Middle East & Africa Ar And Vr Solutions For Commercial Revenue Share (%), by Application 2025 & 2033
- Figure 22: Middle East & Africa Ar And Vr Solutions For Commercial Revenue (undefined), by Type 2025 & 2033
- Figure 23: Middle East & Africa Ar And Vr Solutions For Commercial Revenue Share (%), by Type 2025 & 2033
- Figure 24: Middle East & Africa Ar And Vr Solutions For Commercial Revenue (undefined), by Country 2025 & 2033
- Figure 25: Middle East & Africa Ar And Vr Solutions For Commercial Revenue Share (%), by Country 2025 & 2033
- Figure 26: Asia Pacific Ar And Vr Solutions For Commercial Revenue (undefined), by Application 2025 & 2033
- Figure 27: Asia Pacific Ar And Vr Solutions For Commercial Revenue Share (%), by Application 2025 & 2033
- Figure 28: Asia Pacific Ar And Vr Solutions For Commercial Revenue (undefined), by Type 2025 & 2033
- Figure 29: Asia Pacific Ar And Vr Solutions For Commercial Revenue Share (%), by Type 2025 & 2033
- Figure 30: Asia Pacific Ar And Vr Solutions For Commercial Revenue (undefined), by Country 2025 & 2033
- Figure 31: Asia Pacific Ar And Vr Solutions For Commercial Revenue Share (%), by Country 2025 & 2033
List of Tables
- Table 1: Global Ar And Vr Solutions For Commercial Revenue undefined Forecast, by Application 2020 & 2033
- Table 2: Global Ar And Vr Solutions For Commercial Revenue undefined Forecast, by Type 2020 & 2033
- Table 3: Global Ar And Vr Solutions For Commercial Revenue undefined Forecast, by Region 2020 & 2033
- Table 4: Global Ar And Vr Solutions For Commercial Revenue undefined Forecast, by Application 2020 & 2033
- Table 5: Global Ar And Vr Solutions For Commercial Revenue undefined Forecast, by Type 2020 & 2033
- Table 6: Global Ar And Vr Solutions For Commercial Revenue undefined Forecast, by Country 2020 & 2033
- Table 7: United States Ar And Vr Solutions For Commercial Revenue (undefined) Forecast, by Application 2020 & 2033
- Table 8: Canada Ar And Vr Solutions For Commercial Revenue (undefined) Forecast, by Application 2020 & 2033
- Table 9: Mexico Ar And Vr Solutions For Commercial Revenue (undefined) Forecast, by Application 2020 & 2033
- Table 10: Global Ar And Vr Solutions For Commercial Revenue undefined Forecast, by Application 2020 & 2033
- Table 11: Global Ar And Vr Solutions For Commercial Revenue undefined Forecast, by Type 2020 & 2033
- Table 12: Global Ar And Vr Solutions For Commercial Revenue undefined Forecast, by Country 2020 & 2033
- Table 13: Brazil Ar And Vr Solutions For Commercial Revenue (undefined) Forecast, by Application 2020 & 2033
- Table 14: Argentina Ar And Vr Solutions For Commercial Revenue (undefined) Forecast, by Application 2020 & 2033
- Table 15: Rest of South America Ar And Vr Solutions For Commercial Revenue (undefined) Forecast, by Application 2020 & 2033
- Table 16: Global Ar And Vr Solutions For Commercial Revenue undefined Forecast, by Application 2020 & 2033
- Table 17: Global Ar And Vr Solutions For Commercial Revenue undefined Forecast, by Type 2020 & 2033
- Table 18: Global Ar And Vr Solutions For Commercial Revenue undefined Forecast, by Country 2020 & 2033
- Table 19: United Kingdom Ar And Vr Solutions For Commercial Revenue (undefined) Forecast, by Application 2020 & 2033
- Table 20: Germany Ar And Vr Solutions For Commercial Revenue (undefined) Forecast, by Application 2020 & 2033
- Table 21: France Ar And Vr Solutions For Commercial Revenue (undefined) Forecast, by Application 2020 & 2033
- Table 22: Italy Ar And Vr Solutions For Commercial Revenue (undefined) Forecast, by Application 2020 & 2033
- Table 23: Spain Ar And Vr Solutions For Commercial Revenue (undefined) Forecast, by Application 2020 & 2033
- Table 24: Russia Ar And Vr Solutions For Commercial Revenue (undefined) Forecast, by Application 2020 & 2033
- Table 25: Benelux Ar And Vr Solutions For Commercial Revenue (undefined) Forecast, by Application 2020 & 2033
- Table 26: Nordics Ar And Vr Solutions For Commercial Revenue (undefined) Forecast, by Application 2020 & 2033
- Table 27: Rest of Europe Ar And Vr Solutions For Commercial Revenue (undefined) Forecast, by Application 2020 & 2033
- Table 28: Global Ar And Vr Solutions For Commercial Revenue undefined Forecast, by Application 2020 & 2033
- Table 29: Global Ar And Vr Solutions For Commercial Revenue undefined Forecast, by Type 2020 & 2033
- Table 30: Global Ar And Vr Solutions For Commercial Revenue undefined Forecast, by Country 2020 & 2033
- Table 31: Turkey Ar And Vr Solutions For Commercial Revenue (undefined) Forecast, by Application 2020 & 2033
- Table 32: Israel Ar And Vr Solutions For Commercial Revenue (undefined) Forecast, by Application 2020 & 2033
- Table 33: GCC Ar And Vr Solutions For Commercial Revenue (undefined) Forecast, by Application 2020 & 2033
- Table 34: North Africa Ar And Vr Solutions For Commercial Revenue (undefined) Forecast, by Application 2020 & 2033
- Table 35: South Africa Ar And Vr Solutions For Commercial Revenue (undefined) Forecast, by Application 2020 & 2033
- Table 36: Rest of Middle East & Africa Ar And Vr Solutions For Commercial Revenue (undefined) Forecast, by Application 2020 & 2033
- Table 37: Global Ar And Vr Solutions For Commercial Revenue undefined Forecast, by Application 2020 & 2033
- Table 38: Global Ar And Vr Solutions For Commercial Revenue undefined Forecast, by Type 2020 & 2033
- Table 39: Global Ar And Vr Solutions For Commercial Revenue undefined Forecast, by Country 2020 & 2033
- Table 40: China Ar And Vr Solutions For Commercial Revenue (undefined) Forecast, by Application 2020 & 2033
- Table 41: India Ar And Vr Solutions For Commercial Revenue (undefined) Forecast, by Application 2020 & 2033
- Table 42: Japan Ar And Vr Solutions For Commercial Revenue (undefined) Forecast, by Application 2020 & 2033
- Table 43: South Korea Ar And Vr Solutions For Commercial Revenue (undefined) Forecast, by Application 2020 & 2033
- Table 44: ASEAN Ar And Vr Solutions For Commercial Revenue (undefined) Forecast, by Application 2020 & 2033
- Table 45: Oceania Ar And Vr Solutions For Commercial Revenue (undefined) Forecast, by Application 2020 & 2033
- Table 46: Rest of Asia Pacific Ar And Vr Solutions For Commercial Revenue (undefined) Forecast, by Application 2020 & 2033
Frequently Asked Questions
1. What is the projected Compound Annual Growth Rate (CAGR) of the Ar And Vr Solutions For Commercial?
The projected CAGR is approximately 39.62%.
2. Which companies are prominent players in the Ar And Vr Solutions For Commercial?
Key companies in the market include Google, Microsoft, Oculus VR (Facebook), Sony, Samsung Electronics, HTC, PTC, Wikitude GmbH, Magic Leap, Osterhout Design Group, Daqri, Blippar, Upskill, Continental, Visteon, Eon Reality, Vuzix, Zugara, MAXST, Infinity Augmented Reality, Apple, Intel.
3. What are the main segments of the Ar And Vr Solutions For Commercial?
The market segments include Application, Type.
4. Can you provide details about the market size?
The market size is estimated to be USD XXX N/A as of 2022.
5. What are some drivers contributing to market growth?
N/A
6. What are the notable trends driving market growth?
N/A
7. Are there any restraints impacting market growth?
N/A
8. Can you provide examples of recent developments in the market?
N/A
9. What pricing options are available for accessing the report?
Pricing options include single-user, multi-user, and enterprise licenses priced at USD 2900.00, USD 4350.00, and USD 5800.00 respectively.
10. Is the market size provided in terms of value or volume?
The market size is provided in terms of value, measured in N/A.
11. Are there any specific market keywords associated with the report?
Yes, the market keyword associated with the report is "Ar And Vr Solutions For Commercial," which aids in identifying and referencing the specific market segment covered.
12. How do I determine which pricing option suits my needs best?
The pricing options vary based on user requirements and access needs. Individual users may opt for single-user licenses, while businesses requiring broader access may choose multi-user or enterprise licenses for cost-effective access to the report.
13. Are there any additional resources or data provided in the Ar And Vr Solutions For Commercial report?
While the report offers comprehensive insights, it's advisable to review the specific contents or supplementary materials provided to ascertain if additional resources or data are available.
14. How can I stay updated on further developments or reports in the Ar And Vr Solutions For Commercial?
To stay informed about further developments, trends, and reports in the Ar And Vr Solutions For Commercial, consider subscribing to industry newsletters, following relevant companies and organizations, or regularly checking reputable industry news sources and publications.
Methodology
Step 1 - Identification of Relevant Samples Size from Population Database


Step 2 - Approaches for Defining Global Market Size (Value, Volume* & Price*)

Note*: In applicable scenarios
Step 3 - Data Sources
Primary Research
- Web Analytics
- Survey Reports
- Research Institute
- Latest Research Reports
- Opinion Leaders
Secondary Research
- Annual Reports
- White Paper
- Latest Press Release
- Industry Association
- Paid Database
- Investor Presentations

Step 4 - Data Triangulation
Involves using different sources of information in order to increase the validity of a study
These sources are likely to be stakeholders in a program - participants, other researchers, program staff, other community members, and so on.
Then we put all data in single framework & apply various statistical tools to find out the dynamic on the market.
During the analysis stage, feedback from the stakeholder groups would be compared to determine areas of agreement as well as areas of divergence