

Key Insights
The global 3D Scanning for Quality Inspection Services market is poised for substantial growth, projected to reach an estimated \$327 million by 2025, expanding at a robust Compound Annual Growth Rate (CAGR) of 6.2% through 2033. This expansion is primarily fueled by the increasing adoption of advanced manufacturing techniques and the escalating demand for high-precision quality control across diverse industries. Sectors such as Aerospace and Automotive are leading the charge, leveraging 3D scanning to ensure intricate component integrity, reduce manufacturing defects, and accelerate product development cycles. The Medical industry is also a significant contributor, utilizing 3D scanning for custom prosthetics, implants, and precise surgical planning, thereby enhancing patient outcomes. Furthermore, the burgeoning consumer electronics sector, with its emphasis on miniaturization and complex designs, is increasingly relying on these services for meticulous inspection. The growing awareness of the cost-saving benefits associated with early defect detection and waste reduction further bolsters market momentum.

3d Scanning Quality Inspection Services Market Size (In Million)
The market is characterized by a dynamic landscape of technological advancements and evolving service offerings. Laser scanning and structured light scanning remain the dominant technologies, offering unparalleled accuracy and speed in capturing detailed 3D data. Emerging trends indicate a greater integration of AI and machine learning for automated defect analysis and predictive maintenance, further streamlining quality inspection processes. However, the market faces certain restraints, including the initial high cost of sophisticated 3D scanning equipment and the need for specialized skilled labor to operate and interpret the data. Despite these challenges, the inherent advantages of 3D scanning in enhancing product quality, reducing rework, and ensuring regulatory compliance continue to drive its widespread adoption. The competitive landscape is populated by a mix of established players and emerging innovators, all vying to offer comprehensive and cost-effective solutions to meet the growing global demand for precision quality assurance.

3d Scanning Quality Inspection Services Company Market Share
This comprehensive market analysis delves into the 3D scanning quality inspection services landscape, evaluating key market dynamics and future trajectories. The report examines market concentration, noting a moderate to high degree of fragmentation with key players such as Proto3000, Exact Metrology, Blue Star Engineering & Electronics, Performance Engineered Solutions, Central Scanning, Applications 3D, 3D Engineering Solutions, Cadopt Technologies, Trinity 3D Solutions, Precise3DM, OR3D, MEGA Danışmanlık, STYL&TECH, Rotovia, Goodfish Group, 3D Smart Solutions, CTI, Wiiboox, XTOP 3D Technology, and Shenzhen Stereo3D Technology. Innovation catalysts are identified, including advancements in metrology, artificial intelligence for defect detection, and miniaturization of scanning hardware. The regulatory landscape, particularly within the aerospace, automotive, and medical sectors, is shaping adoption rates and demanding higher precision. Substitute products, such as traditional CMMs, are facing increasing competition from the flexibility and speed offered by 3D scanning. End-user profiles reveal a growing demand from consumer electronics manufacturers seeking rapid prototyping and quality assurance. Merger and acquisition (M&A) activities are on the rise, with an estimated M&A deal value of XX million in the historical period (2019-2024), indicating consolidation and strategic expansion within the industry. The report forecasts a significant increase in 3D scanning market share for quality inspection applications.
3d Scanning Quality Inspection Services Industry Evolution
The 3D scanning quality inspection services industry has undergone a transformative evolution, driven by relentless technological innovation and an escalating demand for precision and efficiency across numerous sectors. Over the historical period from 2019 to 2024, the market witnessed a Compound Annual Growth Rate (CAGR) of approximately XX%, fueled by the increasing adoption of advanced metrology solutions. The base year of 2025 sets a strong foundation for continued expansion, with the market poised for substantial growth through 2033. This evolution is characterized by significant technological advancements. The transition from traditional, time-consuming inspection methods to rapid, non-contact laser scanning and structured light scanning technologies has been a pivotal factor. These advancements allow for the capture of complex geometries and surface details with unprecedented accuracy, reducing inspection times from days to mere hours or minutes. Furthermore, the integration of AI and machine learning algorithms into scanning software has enabled automated data analysis, anomaly detection, and predictive quality assessments, further streamlining the inspection process.
Shifting consumer demands, particularly in the automotive and aerospace industries, have also played a crucial role. The need for lighter, stronger, and more complex manufactured parts necessitates sophisticated quality control measures that can verify intricate designs and tight tolerances. This has led to a surge in demand for 3D scanning services capable of handling high-resolution data acquisition and detailed surface analysis. In the medical sector, the precision offered by 3D scanning is indispensable for manufacturing custom prosthetics, implants, and surgical guides, driving significant market penetration. Similarly, the rapid iteration cycles in consumer electronics demand efficient quality assurance throughout the product development and manufacturing stages. The market is also seeing increased investment in 3D scanning solutions for reverse engineering and additive manufacturing, underscoring the versatility of these technologies. The overall growth trajectory is robust, with the market expected to reach an estimated value of XX million by 2025 and continue its upward trend through the forecast period.
Leading Regions, Countries, or Segments in 3d Scanning Quality Inspection Services
The dominance within the 3D scanning quality inspection services market is multifaceted, influenced by distinct drivers across key applications and scanning types. From an application perspective, the Aerospace segment stands out as a primary growth engine.
- Aerospace: This sector exhibits the highest demand for 3D scanning quality inspection due to stringent safety regulations, the complexity of aircraft components, and the need for rigorous non-destructive testing.
- Key Drivers:
- Regulatory Compliance: Mandates for precision and traceability in aircraft manufacturing.
- Lightweighting Initiatives: The drive for fuel efficiency necessitates the inspection of complex, intricate designs.
- Aftermarket Services: Inspection of legacy aircraft parts and repairs.
- Investment Trends: Significant R&D spending by major aerospace manufacturers on advanced metrology.
- Dominance Factors: The sheer value of aerospace components and the catastrophic consequences of failure underscore the critical role of high-accuracy 3D scanning for quality control. Companies like Proto3000 and Exact Metrology are heavily involved in providing solutions for this sector.
- Key Drivers:
In parallel, the Automotive sector is a substantial contributor, driven by the quest for enhanced vehicle performance, safety, and the rapid adoption of electric vehicles.
- Automotive: The automotive industry leverages 3D scanning for everything from initial design validation and tooling inspection to final product quality assurance.
- Key Drivers:
- Electrification: Complex battery housings and intricate powertrain components require precise inspection.
- Autonomous Driving: Sensor calibration and housing integrity are paramount.
- Mass Production Efficiency: The need for high-volume, rapid inspection processes.
- Supply Chain Quality: Ensuring consistency across a vast network of suppliers.
- Key Drivers:
From the perspective of scanning type, Laser Scanning commands a significant market share due to its speed, accuracy, and ability to capture large areas efficiently.
- Laser Scanning: This technology is a cornerstone for large-part inspection and rapid data acquisition.
- Key Drivers:
- Speed and Throughput: Essential for high-volume manufacturing environments.
- Accuracy and Resolution: Capable of capturing fine details on complex surfaces.
- Versatility: Applicable across a wide range of materials and part sizes.
- Dominance Factors: The ability of laser scanners to quickly create digital replicas of physical objects makes them indispensable for quality control in demanding industries.
- Key Drivers:
While Structured Light Scanning also plays a vital role, particularly for smaller to medium-sized parts and detailed surface analysis, laser scanning’s broader applicability in industries like aerospace and automotive solidifies its leading position in the overall market value. The synergy between these scanning types and the diverse needs of applications like Medical and Consumer Electronics further solidifies the dynamic nature of this market segment.
3d Scanning Quality Inspection Services Product Innovations
Recent product innovations in 3D scanning quality inspection services are revolutionizing how manufacturers ensure product integrity. Advancements in handheld laser scanning technology have dramatically improved portability and ease of use, enabling on-site inspections with unprecedented speed and accuracy. High-resolution structured light scanners are now capable of capturing microscopic surface defects, crucial for industries like medical devices and consumer electronics. Furthermore, the integration of AI-powered analytics with scanning software automates the comparison of scanned data against CAD models, flagging deviations with near-instantaneous reporting. This allows for proactive issue resolution, reducing scrap rates and improving overall product quality. The development of robust, industrial-grade scanning solutions capable of withstanding harsh manufacturing environments further solidifies their value proposition, leading to an estimated XX million in investment in new product development in the historical period.
Propelling Factors for 3d Scanning Quality Inspection Services Growth
Several key factors are propelling the growth of the 3D scanning quality inspection services market. Technological advancements, particularly in the accuracy, speed, and affordability of laser scanning and structured light scanning technologies, are primary drivers. The increasing complexity of manufactured goods across industries like aerospace, automotive, and medical devices necessitates highly precise quality control. Stringent regulatory requirements in these sectors mandate thorough inspection, creating a continuous demand for advanced metrology solutions. Furthermore, the growing adoption of Industry 4.0 principles, including automation and smart manufacturing, encourages the integration of 3D scanning for real-time quality monitoring and predictive maintenance. The economic benefit of reduced scrap, faster time-to-market, and improved product reliability further incentivizes investment in these services.
Obstacles in the 3d Scanning Quality Inspection Services Market
Despite robust growth, the 3D scanning quality inspection services market faces several obstacles. The initial capital investment for high-end scanning hardware and sophisticated software can be substantial, posing a barrier for smaller enterprises. A shortage of skilled technicians proficient in operating and interpreting data from advanced 3D scanning systems also presents a challenge, impacting the effective utilization of these technologies. Furthermore, concerns regarding data security and intellectual property protection, especially when outsourcing scanning services, can deter some businesses. The integration of 3D scanning data into existing enterprise resource planning (ERP) and manufacturing execution systems (MES) can also be complex, requiring significant IT infrastructure and expertise. The market is also susceptible to supply chain disruptions, as seen in recent years, impacting the availability of hardware components.
Future Opportunities in 3d Scanning Quality Inspection Services
The future of 3D scanning quality inspection services is ripe with opportunity. The expanding adoption of additive manufacturing (3D printing) presents a significant avenue, as 3D scanning is crucial for verifying the accuracy and integrity of printed parts. The burgeoning field of virtual and augmented reality (VR/AR) offers opportunities for enhanced visualization and remote collaboration on inspection findings. Growing demand from emerging markets in Asia-Pacific and Latin America, driven by industrialization and increased manufacturing capabilities, represents untapped potential. Further advancements in AI for automated defect classification and predictive quality analytics will unlock new service offerings. The integration of 3D scanning into smart factories for real-time, in-line quality control and the development of miniaturized, portable scanners for field inspections are also key growth areas, promising an estimated XX million in new market value by 2033.
Major Players in the 3d Scanning Quality Inspection Services Ecosystem
- Proto3000
- Exact Metrology
- Blue Star Engineering & Electronics
- Performance Engineered Solutions
- Central Scanning
- Applications 3D
- 3D Engineering Solutions
- Cadopt Technologies
- Trinity 3D Solutions
- Precise3DM
- OR3D
- MEGA Danışmanlık
- STYL&TECH
- Rotovia
- Goodfish Group
- 3D Smart Solutions
- CTI
- Wiiboox
- XTOP 3D Technology
- Shenzhen Stereo3D Technology
Key Developments in 3d Scanning Quality Inspection Services Industry
- 2023/05: Launch of new AI-powered defect detection software by a leading provider, significantly reducing inspection time by an estimated 30%.
- 2023/08: Major acquisition of a specialized metrology firm by a global industrial conglomerate, signaling consolidation and expansion in the automotive sector.
- 2024/01: Introduction of a next-generation handheld laser scanner offering enhanced accuracy and a broader scanning range, targeting the aerospace MRO market.
- 2024/03: A key player announces strategic partnerships to integrate 3D scanning data with cloud-based quality management platforms, emphasizing Industry 4.0 integration.
- 2024/06: Development of a portable, ruggedized 3D scanner designed for on-site inspections in harsh environments, expanding applications in the oil and gas sector.
Strategic 3d Scanning Quality Inspection Services Market Forecast
The strategic outlook for 3D scanning quality inspection services is overwhelmingly positive, driven by the relentless pursuit of precision and efficiency in manufacturing. The increasing adoption of laser scanning and structured light scanning in critical sectors like aerospace and automotive will continue to fuel market expansion. Advancements in artificial intelligence for automated data analysis and defect identification will further enhance the value proposition of these services, enabling proactive quality control and reduced waste. The growing embrace of additive manufacturing also presents a significant opportunity for 3D scanning as an integral part of the production workflow. With an estimated market growth rate of XX% over the forecast period, the market is projected to reach XX million by 2033, solidifying its position as an indispensable tool for modern quality assurance.
3d Scanning Quality Inspection Services Segmentation
-
1. Application
- 1.1. Aerospace
- 1.2. Automotive
- 1.3. Medical
- 1.4. Consumer Electronics
- 1.5. Others
-
2. Type
- 2.1. Laser Scanning
- 2.2. Structured Light Scanning
- 2.3. Others
3d Scanning Quality Inspection Services Segmentation By Geography
-
1. North America
- 1.1. United States
- 1.2. Canada
- 1.3. Mexico
-
2. South America
- 2.1. Brazil
- 2.2. Argentina
- 2.3. Rest of South America
-
3. Europe
- 3.1. United Kingdom
- 3.2. Germany
- 3.3. France
- 3.4. Italy
- 3.5. Spain
- 3.6. Russia
- 3.7. Benelux
- 3.8. Nordics
- 3.9. Rest of Europe
-
4. Middle East & Africa
- 4.1. Turkey
- 4.2. Israel
- 4.3. GCC
- 4.4. North Africa
- 4.5. South Africa
- 4.6. Rest of Middle East & Africa
-
5. Asia Pacific
- 5.1. China
- 5.2. India
- 5.3. Japan
- 5.4. South Korea
- 5.5. ASEAN
- 5.6. Oceania
- 5.7. Rest of Asia Pacific
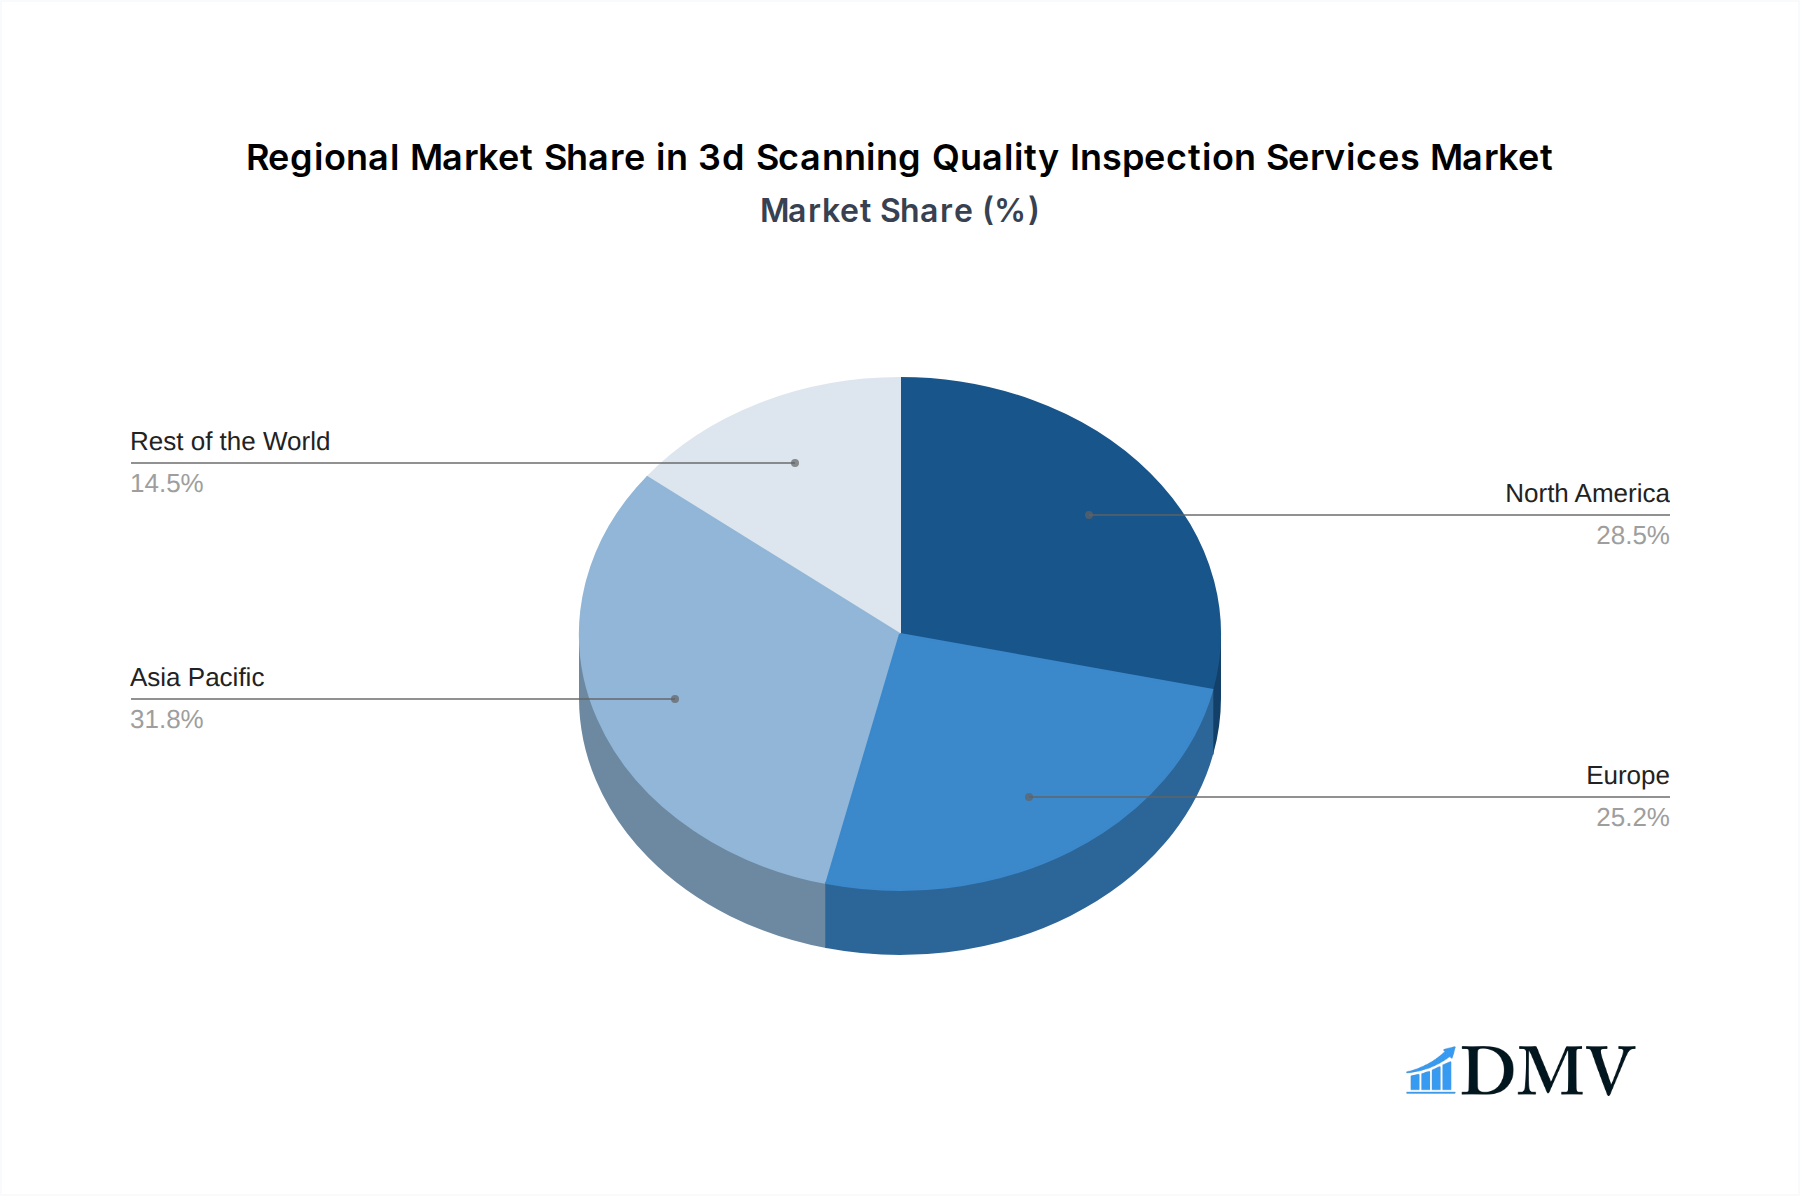
3d Scanning Quality Inspection Services Regional Market Share
Geographic Coverage of 3d Scanning Quality Inspection Services
3d Scanning Quality Inspection Services REPORT HIGHLIGHTS
| Aspects | Details |
|---|---|
| Study Period | 2020-2034 |
| Base Year | 2025 |
| Estimated Year | 2026 |
| Forecast Period | 2026-2034 |
| Historical Period | 2020-2025 |
| Growth Rate | CAGR of 6.2% from 2020-2034 |
| Segmentation |
|
Table of Contents
- 1. Introduction
- 1.1. Research Scope
- 1.2. Market Segmentation
- 1.3. Research Methodology
- 1.4. Definitions and Assumptions
- 2. Executive Summary
- 2.1. Introduction
- 3. Market Dynamics
- 3.1. Introduction
- 3.2. Market Drivers
- 3.3. Market Restrains
- 3.4. Market Trends
- 4. Market Factor Analysis
- 4.1. Porters Five Forces
- 4.2. Supply/Value Chain
- 4.3. PESTEL analysis
- 4.4. Market Entropy
- 4.5. Patent/Trademark Analysis
- 5. Global 3d Scanning Quality Inspection Services Analysis, Insights and Forecast, 2020-2032
- 5.1. Market Analysis, Insights and Forecast - by Application
- 5.1.1. Aerospace
- 5.1.2. Automotive
- 5.1.3. Medical
- 5.1.4. Consumer Electronics
- 5.1.5. Others
- 5.2. Market Analysis, Insights and Forecast - by Type
- 5.2.1. Laser Scanning
- 5.2.2. Structured Light Scanning
- 5.2.3. Others
- 5.3. Market Analysis, Insights and Forecast - by Region
- 5.3.1. North America
- 5.3.2. South America
- 5.3.3. Europe
- 5.3.4. Middle East & Africa
- 5.3.5. Asia Pacific
- 5.1. Market Analysis, Insights and Forecast - by Application
- 6. North America 3d Scanning Quality Inspection Services Analysis, Insights and Forecast, 2020-2032
- 6.1. Market Analysis, Insights and Forecast - by Application
- 6.1.1. Aerospace
- 6.1.2. Automotive
- 6.1.3. Medical
- 6.1.4. Consumer Electronics
- 6.1.5. Others
- 6.2. Market Analysis, Insights and Forecast - by Type
- 6.2.1. Laser Scanning
- 6.2.2. Structured Light Scanning
- 6.2.3. Others
- 6.1. Market Analysis, Insights and Forecast - by Application
- 7. South America 3d Scanning Quality Inspection Services Analysis, Insights and Forecast, 2020-2032
- 7.1. Market Analysis, Insights and Forecast - by Application
- 7.1.1. Aerospace
- 7.1.2. Automotive
- 7.1.3. Medical
- 7.1.4. Consumer Electronics
- 7.1.5. Others
- 7.2. Market Analysis, Insights and Forecast - by Type
- 7.2.1. Laser Scanning
- 7.2.2. Structured Light Scanning
- 7.2.3. Others
- 7.1. Market Analysis, Insights and Forecast - by Application
- 8. Europe 3d Scanning Quality Inspection Services Analysis, Insights and Forecast, 2020-2032
- 8.1. Market Analysis, Insights and Forecast - by Application
- 8.1.1. Aerospace
- 8.1.2. Automotive
- 8.1.3. Medical
- 8.1.4. Consumer Electronics
- 8.1.5. Others
- 8.2. Market Analysis, Insights and Forecast - by Type
- 8.2.1. Laser Scanning
- 8.2.2. Structured Light Scanning
- 8.2.3. Others
- 8.1. Market Analysis, Insights and Forecast - by Application
- 9. Middle East & Africa 3d Scanning Quality Inspection Services Analysis, Insights and Forecast, 2020-2032
- 9.1. Market Analysis, Insights and Forecast - by Application
- 9.1.1. Aerospace
- 9.1.2. Automotive
- 9.1.3. Medical
- 9.1.4. Consumer Electronics
- 9.1.5. Others
- 9.2. Market Analysis, Insights and Forecast - by Type
- 9.2.1. Laser Scanning
- 9.2.2. Structured Light Scanning
- 9.2.3. Others
- 9.1. Market Analysis, Insights and Forecast - by Application
- 10. Asia Pacific 3d Scanning Quality Inspection Services Analysis, Insights and Forecast, 2020-2032
- 10.1. Market Analysis, Insights and Forecast - by Application
- 10.1.1. Aerospace
- 10.1.2. Automotive
- 10.1.3. Medical
- 10.1.4. Consumer Electronics
- 10.1.5. Others
- 10.2. Market Analysis, Insights and Forecast - by Type
- 10.2.1. Laser Scanning
- 10.2.2. Structured Light Scanning
- 10.2.3. Others
- 10.1. Market Analysis, Insights and Forecast - by Application
- 11. Competitive Analysis
- 11.1. Global Market Share Analysis 2025
- 11.2. Company Profiles
- 11.2.1 Proto3000
- 11.2.1.1. Overview
- 11.2.1.2. Products
- 11.2.1.3. SWOT Analysis
- 11.2.1.4. Recent Developments
- 11.2.1.5. Financials (Based on Availability)
- 11.2.2 Exact Metrology
- 11.2.2.1. Overview
- 11.2.2.2. Products
- 11.2.2.3. SWOT Analysis
- 11.2.2.4. Recent Developments
- 11.2.2.5. Financials (Based on Availability)
- 11.2.3 Blue Star Engineering & Electronics
- 11.2.3.1. Overview
- 11.2.3.2. Products
- 11.2.3.3. SWOT Analysis
- 11.2.3.4. Recent Developments
- 11.2.3.5. Financials (Based on Availability)
- 11.2.4 Performance Engineered Solutions
- 11.2.4.1. Overview
- 11.2.4.2. Products
- 11.2.4.3. SWOT Analysis
- 11.2.4.4. Recent Developments
- 11.2.4.5. Financials (Based on Availability)
- 11.2.5 Central Scanning
- 11.2.5.1. Overview
- 11.2.5.2. Products
- 11.2.5.3. SWOT Analysis
- 11.2.5.4. Recent Developments
- 11.2.5.5. Financials (Based on Availability)
- 11.2.6 Applications 3D
- 11.2.6.1. Overview
- 11.2.6.2. Products
- 11.2.6.3. SWOT Analysis
- 11.2.6.4. Recent Developments
- 11.2.6.5. Financials (Based on Availability)
- 11.2.7 3D Engineering Solutions
- 11.2.7.1. Overview
- 11.2.7.2. Products
- 11.2.7.3. SWOT Analysis
- 11.2.7.4. Recent Developments
- 11.2.7.5. Financials (Based on Availability)
- 11.2.8 Cadopt Technologies
- 11.2.8.1. Overview
- 11.2.8.2. Products
- 11.2.8.3. SWOT Analysis
- 11.2.8.4. Recent Developments
- 11.2.8.5. Financials (Based on Availability)
- 11.2.9 Trinity 3D Solutions
- 11.2.9.1. Overview
- 11.2.9.2. Products
- 11.2.9.3. SWOT Analysis
- 11.2.9.4. Recent Developments
- 11.2.9.5. Financials (Based on Availability)
- 11.2.10 Precise3DM
- 11.2.10.1. Overview
- 11.2.10.2. Products
- 11.2.10.3. SWOT Analysis
- 11.2.10.4. Recent Developments
- 11.2.10.5. Financials (Based on Availability)
- 11.2.11 OR3D
- 11.2.11.1. Overview
- 11.2.11.2. Products
- 11.2.11.3. SWOT Analysis
- 11.2.11.4. Recent Developments
- 11.2.11.5. Financials (Based on Availability)
- 11.2.12 MEGA Danışmanlık
- 11.2.12.1. Overview
- 11.2.12.2. Products
- 11.2.12.3. SWOT Analysis
- 11.2.12.4. Recent Developments
- 11.2.12.5. Financials (Based on Availability)
- 11.2.13 STYL&TECH
- 11.2.13.1. Overview
- 11.2.13.2. Products
- 11.2.13.3. SWOT Analysis
- 11.2.13.4. Recent Developments
- 11.2.13.5. Financials (Based on Availability)
- 11.2.14 Rotovia
- 11.2.14.1. Overview
- 11.2.14.2. Products
- 11.2.14.3. SWOT Analysis
- 11.2.14.4. Recent Developments
- 11.2.14.5. Financials (Based on Availability)
- 11.2.15 Goodfish Group
- 11.2.15.1. Overview
- 11.2.15.2. Products
- 11.2.15.3. SWOT Analysis
- 11.2.15.4. Recent Developments
- 11.2.15.5. Financials (Based on Availability)
- 11.2.16 3D Smart Solutions
- 11.2.16.1. Overview
- 11.2.16.2. Products
- 11.2.16.3. SWOT Analysis
- 11.2.16.4. Recent Developments
- 11.2.16.5. Financials (Based on Availability)
- 11.2.17 CTI
- 11.2.17.1. Overview
- 11.2.17.2. Products
- 11.2.17.3. SWOT Analysis
- 11.2.17.4. Recent Developments
- 11.2.17.5. Financials (Based on Availability)
- 11.2.18 Wiiboox
- 11.2.18.1. Overview
- 11.2.18.2. Products
- 11.2.18.3. SWOT Analysis
- 11.2.18.4. Recent Developments
- 11.2.18.5. Financials (Based on Availability)
- 11.2.19 XTOP 3D Technology
- 11.2.19.1. Overview
- 11.2.19.2. Products
- 11.2.19.3. SWOT Analysis
- 11.2.19.4. Recent Developments
- 11.2.19.5. Financials (Based on Availability)
- 11.2.20 Shenzhen Stereo3D Technology
- 11.2.20.1. Overview
- 11.2.20.2. Products
- 11.2.20.3. SWOT Analysis
- 11.2.20.4. Recent Developments
- 11.2.20.5. Financials (Based on Availability)
- 11.2.1 Proto3000
List of Figures
- Figure 1: Global 3d Scanning Quality Inspection Services Revenue Breakdown (million, %) by Region 2025 & 2033
- Figure 2: North America 3d Scanning Quality Inspection Services Revenue (million), by Application 2025 & 2033
- Figure 3: North America 3d Scanning Quality Inspection Services Revenue Share (%), by Application 2025 & 2033
- Figure 4: North America 3d Scanning Quality Inspection Services Revenue (million), by Type 2025 & 2033
- Figure 5: North America 3d Scanning Quality Inspection Services Revenue Share (%), by Type 2025 & 2033
- Figure 6: North America 3d Scanning Quality Inspection Services Revenue (million), by Country 2025 & 2033
- Figure 7: North America 3d Scanning Quality Inspection Services Revenue Share (%), by Country 2025 & 2033
- Figure 8: South America 3d Scanning Quality Inspection Services Revenue (million), by Application 2025 & 2033
- Figure 9: South America 3d Scanning Quality Inspection Services Revenue Share (%), by Application 2025 & 2033
- Figure 10: South America 3d Scanning Quality Inspection Services Revenue (million), by Type 2025 & 2033
- Figure 11: South America 3d Scanning Quality Inspection Services Revenue Share (%), by Type 2025 & 2033
- Figure 12: South America 3d Scanning Quality Inspection Services Revenue (million), by Country 2025 & 2033
- Figure 13: South America 3d Scanning Quality Inspection Services Revenue Share (%), by Country 2025 & 2033
- Figure 14: Europe 3d Scanning Quality Inspection Services Revenue (million), by Application 2025 & 2033
- Figure 15: Europe 3d Scanning Quality Inspection Services Revenue Share (%), by Application 2025 & 2033
- Figure 16: Europe 3d Scanning Quality Inspection Services Revenue (million), by Type 2025 & 2033
- Figure 17: Europe 3d Scanning Quality Inspection Services Revenue Share (%), by Type 2025 & 2033
- Figure 18: Europe 3d Scanning Quality Inspection Services Revenue (million), by Country 2025 & 2033
- Figure 19: Europe 3d Scanning Quality Inspection Services Revenue Share (%), by Country 2025 & 2033
- Figure 20: Middle East & Africa 3d Scanning Quality Inspection Services Revenue (million), by Application 2025 & 2033
- Figure 21: Middle East & Africa 3d Scanning Quality Inspection Services Revenue Share (%), by Application 2025 & 2033
- Figure 22: Middle East & Africa 3d Scanning Quality Inspection Services Revenue (million), by Type 2025 & 2033
- Figure 23: Middle East & Africa 3d Scanning Quality Inspection Services Revenue Share (%), by Type 2025 & 2033
- Figure 24: Middle East & Africa 3d Scanning Quality Inspection Services Revenue (million), by Country 2025 & 2033
- Figure 25: Middle East & Africa 3d Scanning Quality Inspection Services Revenue Share (%), by Country 2025 & 2033
- Figure 26: Asia Pacific 3d Scanning Quality Inspection Services Revenue (million), by Application 2025 & 2033
- Figure 27: Asia Pacific 3d Scanning Quality Inspection Services Revenue Share (%), by Application 2025 & 2033
- Figure 28: Asia Pacific 3d Scanning Quality Inspection Services Revenue (million), by Type 2025 & 2033
- Figure 29: Asia Pacific 3d Scanning Quality Inspection Services Revenue Share (%), by Type 2025 & 2033
- Figure 30: Asia Pacific 3d Scanning Quality Inspection Services Revenue (million), by Country 2025 & 2033
- Figure 31: Asia Pacific 3d Scanning Quality Inspection Services Revenue Share (%), by Country 2025 & 2033
List of Tables
- Table 1: Global 3d Scanning Quality Inspection Services Revenue million Forecast, by Application 2020 & 2033
- Table 2: Global 3d Scanning Quality Inspection Services Revenue million Forecast, by Type 2020 & 2033
- Table 3: Global 3d Scanning Quality Inspection Services Revenue million Forecast, by Region 2020 & 2033
- Table 4: Global 3d Scanning Quality Inspection Services Revenue million Forecast, by Application 2020 & 2033
- Table 5: Global 3d Scanning Quality Inspection Services Revenue million Forecast, by Type 2020 & 2033
- Table 6: Global 3d Scanning Quality Inspection Services Revenue million Forecast, by Country 2020 & 2033
- Table 7: United States 3d Scanning Quality Inspection Services Revenue (million) Forecast, by Application 2020 & 2033
- Table 8: Canada 3d Scanning Quality Inspection Services Revenue (million) Forecast, by Application 2020 & 2033
- Table 9: Mexico 3d Scanning Quality Inspection Services Revenue (million) Forecast, by Application 2020 & 2033
- Table 10: Global 3d Scanning Quality Inspection Services Revenue million Forecast, by Application 2020 & 2033
- Table 11: Global 3d Scanning Quality Inspection Services Revenue million Forecast, by Type 2020 & 2033
- Table 12: Global 3d Scanning Quality Inspection Services Revenue million Forecast, by Country 2020 & 2033
- Table 13: Brazil 3d Scanning Quality Inspection Services Revenue (million) Forecast, by Application 2020 & 2033
- Table 14: Argentina 3d Scanning Quality Inspection Services Revenue (million) Forecast, by Application 2020 & 2033
- Table 15: Rest of South America 3d Scanning Quality Inspection Services Revenue (million) Forecast, by Application 2020 & 2033
- Table 16: Global 3d Scanning Quality Inspection Services Revenue million Forecast, by Application 2020 & 2033
- Table 17: Global 3d Scanning Quality Inspection Services Revenue million Forecast, by Type 2020 & 2033
- Table 18: Global 3d Scanning Quality Inspection Services Revenue million Forecast, by Country 2020 & 2033
- Table 19: United Kingdom 3d Scanning Quality Inspection Services Revenue (million) Forecast, by Application 2020 & 2033
- Table 20: Germany 3d Scanning Quality Inspection Services Revenue (million) Forecast, by Application 2020 & 2033
- Table 21: France 3d Scanning Quality Inspection Services Revenue (million) Forecast, by Application 2020 & 2033
- Table 22: Italy 3d Scanning Quality Inspection Services Revenue (million) Forecast, by Application 2020 & 2033
- Table 23: Spain 3d Scanning Quality Inspection Services Revenue (million) Forecast, by Application 2020 & 2033
- Table 24: Russia 3d Scanning Quality Inspection Services Revenue (million) Forecast, by Application 2020 & 2033
- Table 25: Benelux 3d Scanning Quality Inspection Services Revenue (million) Forecast, by Application 2020 & 2033
- Table 26: Nordics 3d Scanning Quality Inspection Services Revenue (million) Forecast, by Application 2020 & 2033
- Table 27: Rest of Europe 3d Scanning Quality Inspection Services Revenue (million) Forecast, by Application 2020 & 2033
- Table 28: Global 3d Scanning Quality Inspection Services Revenue million Forecast, by Application 2020 & 2033
- Table 29: Global 3d Scanning Quality Inspection Services Revenue million Forecast, by Type 2020 & 2033
- Table 30: Global 3d Scanning Quality Inspection Services Revenue million Forecast, by Country 2020 & 2033
- Table 31: Turkey 3d Scanning Quality Inspection Services Revenue (million) Forecast, by Application 2020 & 2033
- Table 32: Israel 3d Scanning Quality Inspection Services Revenue (million) Forecast, by Application 2020 & 2033
- Table 33: GCC 3d Scanning Quality Inspection Services Revenue (million) Forecast, by Application 2020 & 2033
- Table 34: North Africa 3d Scanning Quality Inspection Services Revenue (million) Forecast, by Application 2020 & 2033
- Table 35: South Africa 3d Scanning Quality Inspection Services Revenue (million) Forecast, by Application 2020 & 2033
- Table 36: Rest of Middle East & Africa 3d Scanning Quality Inspection Services Revenue (million) Forecast, by Application 2020 & 2033
- Table 37: Global 3d Scanning Quality Inspection Services Revenue million Forecast, by Application 2020 & 2033
- Table 38: Global 3d Scanning Quality Inspection Services Revenue million Forecast, by Type 2020 & 2033
- Table 39: Global 3d Scanning Quality Inspection Services Revenue million Forecast, by Country 2020 & 2033
- Table 40: China 3d Scanning Quality Inspection Services Revenue (million) Forecast, by Application 2020 & 2033
- Table 41: India 3d Scanning Quality Inspection Services Revenue (million) Forecast, by Application 2020 & 2033
- Table 42: Japan 3d Scanning Quality Inspection Services Revenue (million) Forecast, by Application 2020 & 2033
- Table 43: South Korea 3d Scanning Quality Inspection Services Revenue (million) Forecast, by Application 2020 & 2033
- Table 44: ASEAN 3d Scanning Quality Inspection Services Revenue (million) Forecast, by Application 2020 & 2033
- Table 45: Oceania 3d Scanning Quality Inspection Services Revenue (million) Forecast, by Application 2020 & 2033
- Table 46: Rest of Asia Pacific 3d Scanning Quality Inspection Services Revenue (million) Forecast, by Application 2020 & 2033
Frequently Asked Questions
1. What is the projected Compound Annual Growth Rate (CAGR) of the 3d Scanning Quality Inspection Services?
The projected CAGR is approximately 6.2%.
2. Which companies are prominent players in the 3d Scanning Quality Inspection Services?
Key companies in the market include Proto3000, Exact Metrology, Blue Star Engineering & Electronics, Performance Engineered Solutions, Central Scanning, Applications 3D, 3D Engineering Solutions, Cadopt Technologies, Trinity 3D Solutions, Precise3DM, OR3D, MEGA Danışmanlık, STYL&TECH, Rotovia, Goodfish Group, 3D Smart Solutions, CTI, Wiiboox, XTOP 3D Technology, Shenzhen Stereo3D Technology.
3. What are the main segments of the 3d Scanning Quality Inspection Services?
The market segments include Application, Type.
4. Can you provide details about the market size?
The market size is estimated to be USD 327 million as of 2022.
5. What are some drivers contributing to market growth?
N/A
6. What are the notable trends driving market growth?
N/A
7. Are there any restraints impacting market growth?
N/A
8. Can you provide examples of recent developments in the market?
N/A
9. What pricing options are available for accessing the report?
Pricing options include single-user, multi-user, and enterprise licenses priced at USD 3950.00, USD 5925.00, and USD 7900.00 respectively.
10. Is the market size provided in terms of value or volume?
The market size is provided in terms of value, measured in million.
11. Are there any specific market keywords associated with the report?
Yes, the market keyword associated with the report is "3d Scanning Quality Inspection Services," which aids in identifying and referencing the specific market segment covered.
12. How do I determine which pricing option suits my needs best?
The pricing options vary based on user requirements and access needs. Individual users may opt for single-user licenses, while businesses requiring broader access may choose multi-user or enterprise licenses for cost-effective access to the report.
13. Are there any additional resources or data provided in the 3d Scanning Quality Inspection Services report?
While the report offers comprehensive insights, it's advisable to review the specific contents or supplementary materials provided to ascertain if additional resources or data are available.
14. How can I stay updated on further developments or reports in the 3d Scanning Quality Inspection Services?
To stay informed about further developments, trends, and reports in the 3d Scanning Quality Inspection Services, consider subscribing to industry newsletters, following relevant companies and organizations, or regularly checking reputable industry news sources and publications.
Methodology
Step 1 - Identification of Relevant Samples Size from Population Database


Step 2 - Approaches for Defining Global Market Size (Value, Volume* & Price*)

Note*: In applicable scenarios
Step 3 - Data Sources
Primary Research
- Web Analytics
- Survey Reports
- Research Institute
- Latest Research Reports
- Opinion Leaders
Secondary Research
- Annual Reports
- White Paper
- Latest Press Release
- Industry Association
- Paid Database
- Investor Presentations

Step 4 - Data Triangulation
Involves using different sources of information in order to increase the validity of a study
These sources are likely to be stakeholders in a program - participants, other researchers, program staff, other community members, and so on.
Then we put all data in single framework & apply various statistical tools to find out the dynamic on the market.
During the analysis stage, feedback from the stakeholder groups would be compared to determine areas of agreement as well as areas of divergence