

Key Insights
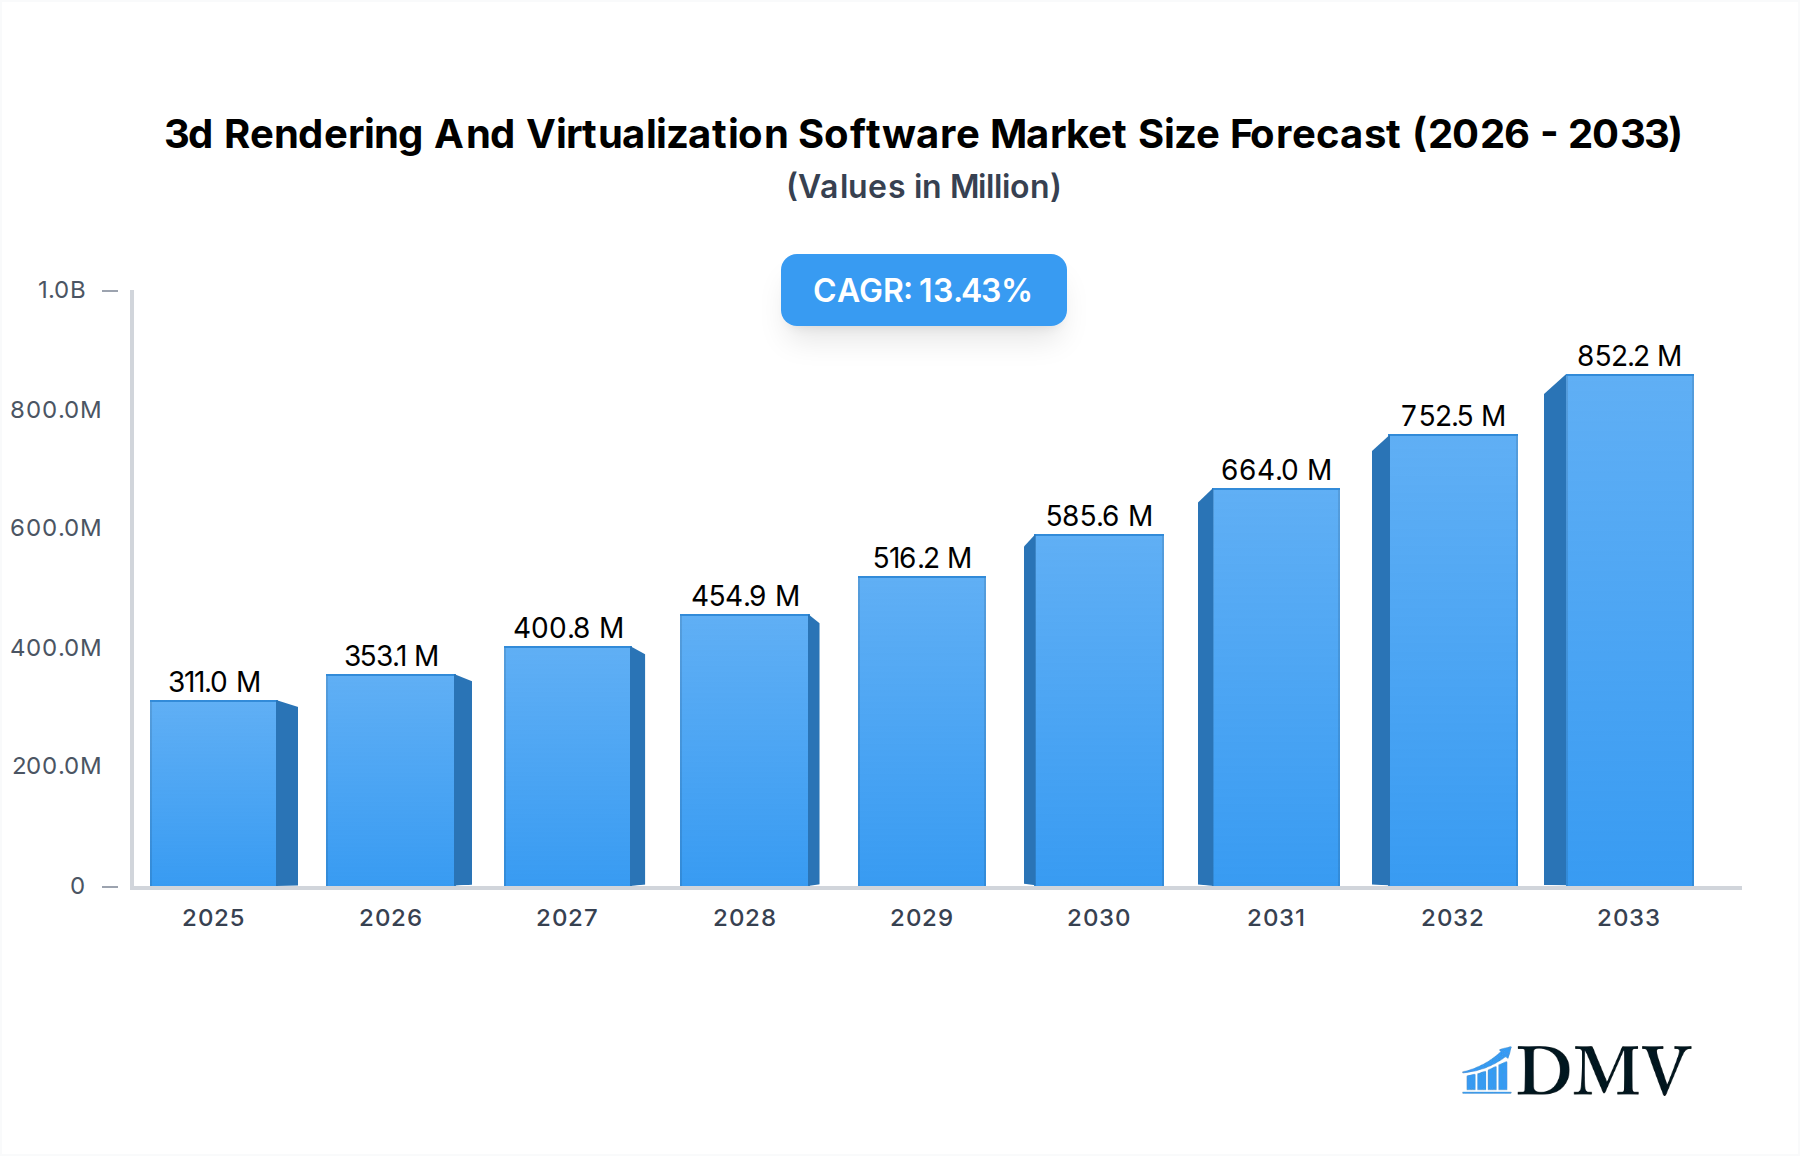
The global 3D Rendering and Virtualization Software market is poised for substantial growth, projected to reach USD 311 million by 2025 with an impressive Compound Annual Growth Rate (CAGR) of 13.5% during the forecast period of 2025-2033. This robust expansion is primarily driven by the escalating demand for hyper-realistic visuals across a myriad of applications. The entertainment industry, particularly video production and gaming, is a significant catalyst, leveraging these technologies for breathtaking special effects and immersive virtual environments. Furthermore, the burgeoning use of 3D rendering in architecture for realistic visualizations of buildings and urban planning, alongside its critical role in industrial design and product prototyping, are contributing to market dominance. Transportation sectors are also increasingly adopting these solutions for vehicle design, simulation, and creating virtual showrooms. The growth is further fueled by advancements in hardware capabilities, making rendering processes faster and more accessible, thereby democratizing access to sophisticated visualization tools.

3d Rendering And Virtualization Software Market Size (In Million)
The market's trajectory is shaped by several key trends, including the rise of real-time rendering engines, which allow for immediate visual feedback and interactive experiences, and the increasing integration of Artificial Intelligence (AI) and Machine Learning (ML) for automating complex rendering tasks and enhancing image quality. Cloud-based rendering solutions are also gaining traction, offering scalability, cost-effectiveness, and accessibility to users regardless of their local hardware capabilities. While the market enjoys strong drivers, certain restraints exist, such as the high cost of advanced software and hardware for smaller businesses and individuals, and the steep learning curve associated with some professional-grade rendering suites. However, the continuous innovation by leading companies like Pixar, NVIDIA, Autodesk, and Chaos Group, coupled with the expanding reach into emerging economies, suggests a highly dynamic and promising future for the 3D Rendering and Virtualization Software market.
3d Rendering And Virtualization Software Company Market Share
3d Rendering And Virtualization Software Market Composition & Trends
The 3D Rendering and Virtualization Software market is characterized by a moderately concentrated landscape, with key players like NVIDIA, AUTODESK, and Chaos Group holding significant market share, estimated at over 50% collectively. Innovation is a primary driver, fueled by advancements in GPU computing and AI-powered rendering techniques, enabling photorealistic visualizations at unprecedented speeds. Regulatory frameworks are largely permissive, focusing on intellectual property and data security, though emerging standards for real-time rendering in industrial applications are gaining traction. Substitute products, while present in simpler 2D visualization tools, fall short of the immersive capabilities offered by 3D rendering and virtualization. End-user profiles span diverse sectors, from the entertainment industry (Pixar, Otoy) demanding high-fidelity graphics, to architecture and engineering (AUTODESK, Robert McNeel, cebas) requiring precise model visualization, and manufacturing (NVIDIA, LUXION) leveraging it for product design and simulation. Mergers and acquisitions are strategic maneuvers to consolidate market position and acquire cutting-edge technologies, with M&A deal values frequently exceeding several hundred million.
- Market Share Distribution: Leading players command substantial portions, with the top 3-5 companies holding an estimated 60-70% of the market by revenue.
- M&A Deal Values: Significant acquisitions and partnerships have seen valuations ranging from tens of millions to over five hundred million dollars for companies with proprietary rendering engines or substantial user bases.
- Innovation Catalysts: GPU advancements, real-time rendering, AI/ML integration, and cloud-based solutions.
- Substitute Products: Basic 2D modeling and visualization tools.
- End-User Segments: Video Entertainment, Architecture, Industry, Transportation, Gaming, Automotive, Healthcare.
- M&A Activities: Focus on acquiring innovative technologies, expanding market reach, and consolidating market share.
3d Rendering And Virtualization Software Industry Evolution
The 3D Rendering and Virtualization Software industry has undergone a dramatic evolution from its nascent stages, transforming from niche tools for specialized professionals into indispensable solutions across a multitude of sectors. Historically, rendering was a computationally intensive and time-consuming process, largely confined to academic institutions and high-end production studios. However, the advent of powerful graphics processing units (GPUs) revolutionized this landscape. NVIDIA's persistent innovation in GPU architecture has been a cornerstone, providing the raw processing power necessary for complex scene rendering. This technological leap has directly impacted market growth trajectories, enabling photorealistic outputs that were once unimaginable.
The study period from 2019 to 2033, with a base year of 2025, provides a comprehensive view of this dynamic. From 2019 to 2024, the market experienced robust growth driven by increasing adoption in the architecture, engineering, and construction (AEC) sectors, where virtual walkthroughs and design reviews became standard practice. The video entertainment industry also saw a surge in demand for advanced rendering capabilities for film, television, and game development, with companies like Pixar consistently pushing the boundaries of visual fidelity.
Technological advancements have been the primary engine of this evolution. The shift towards real-time rendering, exemplified by engines like Unreal Engine and Unity, has significantly reduced turnaround times and enabled interactive experiences. This is complemented by the development of sophisticated rendering algorithms and specialized software like Chaos Group's V-Ray and AUTODESK's Arnold, which offer unparalleled control and quality. Cloud-based rendering solutions have further democratized access, allowing users to leverage vast computing power without significant upfront hardware investment, a trend projected to accelerate from 2025 onwards.
Consumer demands have also played a crucial role. As audiences become accustomed to high-quality visuals in gaming and streaming services, the expectation for visually stunning and immersive content has risen across all applications. In the industrial sector, the demand for accurate digital twins and virtual prototyping has surged, driven by the need for cost reduction and faster product development cycles. Companies like AUTODESK and Solid Angle (now part of MAXON) have responded by integrating advanced simulation and analysis tools into their rendering pipelines.
The forecast period from 2025 to 2033 anticipates continued high growth, with an estimated CAGR of over 15%. This sustained expansion will be propelled by the ongoing miniaturization and increased efficiency of hardware, advancements in AI for automated scene creation and material generation, and the burgeoning metaverse and extended reality (XR) markets. The increasing adoption of virtual and augmented reality technologies in training, design, and marketing will further solidify the importance of high-fidelity 3D rendering and virtualization. Software providers are continuously innovating, with new features like AI denoising, procedural generation, and advanced material libraries becoming standard, directly influencing adoption metrics and market penetration across emerging and established segments. The integration of physics-based simulations and increasingly sophisticated lighting models by companies like NextLimit and Lumion will ensure that the industry remains at the forefront of visual innovation.
Leading Regions, Countries, or Segments in 3d Rendering And Virtualization Software
North America, particularly the United States, stands as a dominant region in the 3D Rendering and Virtualization Software market. This leadership is underpinned by a vibrant ecosystem of technology innovation, significant investment in research and development, and a robust presence of key end-user industries. The concentration of major software developers, renowned animation studios, leading architectural firms, and advanced manufacturing hubs within this region creates a powerful demand for sophisticated visualization tools. Investment trends are consistently high, with venture capital flowing into startups developing novel rendering technologies and cloud-based solutions. Furthermore, the presence of educational institutions that are pioneers in 3D graphics and digital art programs ensures a steady supply of skilled professionals, further bolstering adoption and innovation.
The Video Entertainment segment is a primary driver of dominance, fueled by the insatiable global appetite for visually rich films, television shows, and video games. Companies like Pixar, Otoy, and NVIDIA are at the forefront, constantly pushing the boundaries of photorealism and real-time rendering for cinematic experiences. The sheer volume of content produced and the increasing resolution demands (e.g., 4K, 8K) necessitate powerful and efficient rendering solutions.
- Key Drivers in Video Entertainment:
- High Demand for Immersive Content: Growing consumer expectation for visually stunning graphics in films, TV, and games.
- Technological Advancement in VFX and Animation: Continuous innovation in rendering engines and workflows for complex visual effects.
- Growth of Gaming Industry: Increased investment in AAA game development requiring cutting-edge graphics.
- Streaming Platform Expansion: Proliferation of platforms demanding a constant stream of high-quality visual content.
The Architecture segment also plays a pivotal role in North America's dominance. The widespread adoption of Building Information Modeling (BIM) and the increasing use of virtual reality (VR) and augmented reality (AR) for client presentations, design reviews, and urban planning have significantly boosted the demand for rendering and virtualization software. AUTODESK, with its comprehensive suite of AEC software, and specialized visualization tools from companies like Lumion and SolidIRIS, are integral to this sector's success.
- Key Drivers in Architecture:
- BIM Integration: Seamless integration of rendering with BIM workflows for design and visualization.
- VR/AR Adoption: Increased use of immersive technologies for client presentations and design collaboration.
- Demand for Realistic Visualizations: Architects and clients require photorealistic renderings for decision-making.
- Efficiency and Cost Savings: Virtual walkthroughs reduce the need for physical models and on-site visits.
While Industry and Transportation are also significant segments, their growth is more closely tied to specific technological advancements and adoption cycles within those respective fields. However, the foundational demand for detailed product visualization, virtual prototyping, and simulation in these sectors further solidifies North America's position as a leader, supported by its strong industrial base and automotive sector. The prevalence of both stand-alone professional applications and plugin solutions caters to the diverse needs across these segments, from individual artists to large enterprises.
3d Rendering And Virtualization Software Product Innovations
Recent product innovations in 3D rendering and virtualization software focus on accelerating workflows, enhancing realism, and democratizing access. AI-powered denoising algorithms are now standard, drastically reducing render times by intelligently cleaning up noisy images. Cloud-based rendering platforms are expanding their capabilities, offering scalable compute power and seamless integration with popular 3D software. Advancements in real-time ray tracing, powered by NVIDIA's RTX technology, are enabling near-instantaneous visual feedback for designers and artists. Furthermore, procedural content generation tools are emerging, allowing for the creation of complex environments and assets with greater efficiency. These innovations are directly impacting performance metrics, with render times shrinking by up to 70% for certain scenes and the quality of output reaching new heights of photorealism, as seen in the latest releases from Chaos Group and AUTODESK.
Propelling Factors for 3d Rendering And Virtualization Software Growth
Several factors are propelling the growth of the 3D rendering and virtualization software market. The continuous evolution of graphics hardware, particularly GPUs, provides the necessary computational power for complex visualizations. The increasing demand for photorealistic content across industries like video entertainment, architecture, and automotive design is a significant driver. Technological advancements, such as the widespread adoption of real-time rendering and cloud-based solutions, enhance accessibility and efficiency. Furthermore, the expanding applications in virtual and augmented reality, as well as the development of the metaverse, create new avenues for immersive experiences, directly fueling the need for advanced rendering capabilities.
Obstacles in the 3d Rendering And Virtualization Software Market
Despite robust growth, the 3D rendering and virtualization software market faces several obstacles. The significant upfront cost of high-end hardware and perpetual software licenses can be a barrier for smaller businesses and individual freelancers. The complexity of advanced rendering software requires specialized skills and extensive training, leading to a talent gap. Furthermore, the rapid pace of technological change necessitates continuous software updates and hardware upgrades, leading to ongoing investment demands. Supply chain disruptions for critical hardware components, such as GPUs, can also impact production and delivery timelines, potentially delaying projects and affecting market expansion.
Future Opportunities in 3d Rendering And Virtualization Software
The future opportunities in the 3D rendering and virtualization software market are immense. The burgeoning metaverse presents a vast new frontier for creating persistent, immersive virtual worlds that will rely heavily on high-fidelity rendering. The increasing adoption of AI and machine learning in content creation, from asset generation to scene optimization, promises to further streamline workflows and unlock new creative possibilities. The continued integration of real-time rendering into industrial design, product visualization, and simulation will drive efficiency and innovation. The expansion of virtual and augmented reality applications in education, healthcare, and remote collaboration will also create significant demand for advanced visualization tools.
Major Players in the 3d Rendering And Virtualization Software Ecosystem
- Pixar
- NVIDIA
- Chaos Group
- AUTODESK
- Solid Angle
- NextLimit
- Robert McNeel
- cebas
- Otoy
- Advent
- Bunkspeed (3ds)
- LUXION (KeyShot)
- Lumion
- SolidIRIS
Key Developments in 3d Rendering And Virtualization Software Industry
- 2023 Q4: NVIDIA announces advancements in AI-powered rendering techniques, promising significant speed increases.
- 2024 Q1: AUTODESK releases a new version of Arnold with enhanced GPU rendering capabilities and improved material workflows.
- 2024 Q2: Chaos Group introduces V-Ray 6, featuring major updates for real-time rendering and cloud integration.
- 2024 Q3: Lumion launches Lumion 13, focusing on expanded asset libraries and improved environmental effects for architectural visualization.
- 2024 Q4: Otoy announces significant updates to OctaneRender, enhancing its support for real-time ray tracing and AI features.
- 2025 Q1: LUXION (KeyShot) releases KeyShot 12, emphasizing faster rendering and expanded material editing tools.
- 2025 Q2: Advent releases new plugins for real-time visualization, targeting the industrial design sector.
Strategic 3d Rendering And Virtualization Software Market Forecast
The strategic market forecast for 3D Rendering and Virtualization Software is exceptionally promising, driven by ongoing technological innovation and expanding application verticals. The convergence of AI, cloud computing, and powerful GPU hardware will continue to democratize access to high-fidelity visualization, lowering barriers to entry for smaller studios and individual creators. The growth of the metaverse, immersive gaming, and virtual production in the entertainment sector will create sustained demand for increasingly sophisticated rendering solutions. Furthermore, the drive for efficiency and realism in architecture, engineering, and manufacturing will ensure continued adoption. The market is projected to witness significant growth, with new opportunities arising from emerging technologies and evolving consumer expectations for visually rich and interactive experiences.
3d Rendering And Virtualization Software Segmentation
-
1. Application
- 1.1. Video Entertainment
- 1.2. Architecture
- 1.3. Industry
- 1.4. Transportation
-
2. Type
- 2.1. Stand-Alone
- 2.2. Plugin
3d Rendering And Virtualization Software Segmentation By Geography
-
1. North America
- 1.1. United States
- 1.2. Canada
- 1.3. Mexico
-
2. South America
- 2.1. Brazil
- 2.2. Argentina
- 2.3. Rest of South America
-
3. Europe
- 3.1. United Kingdom
- 3.2. Germany
- 3.3. France
- 3.4. Italy
- 3.5. Spain
- 3.6. Russia
- 3.7. Benelux
- 3.8. Nordics
- 3.9. Rest of Europe
-
4. Middle East & Africa
- 4.1. Turkey
- 4.2. Israel
- 4.3. GCC
- 4.4. North Africa
- 4.5. South Africa
- 4.6. Rest of Middle East & Africa
-
5. Asia Pacific
- 5.1. China
- 5.2. India
- 5.3. Japan
- 5.4. South Korea
- 5.5. ASEAN
- 5.6. Oceania
- 5.7. Rest of Asia Pacific
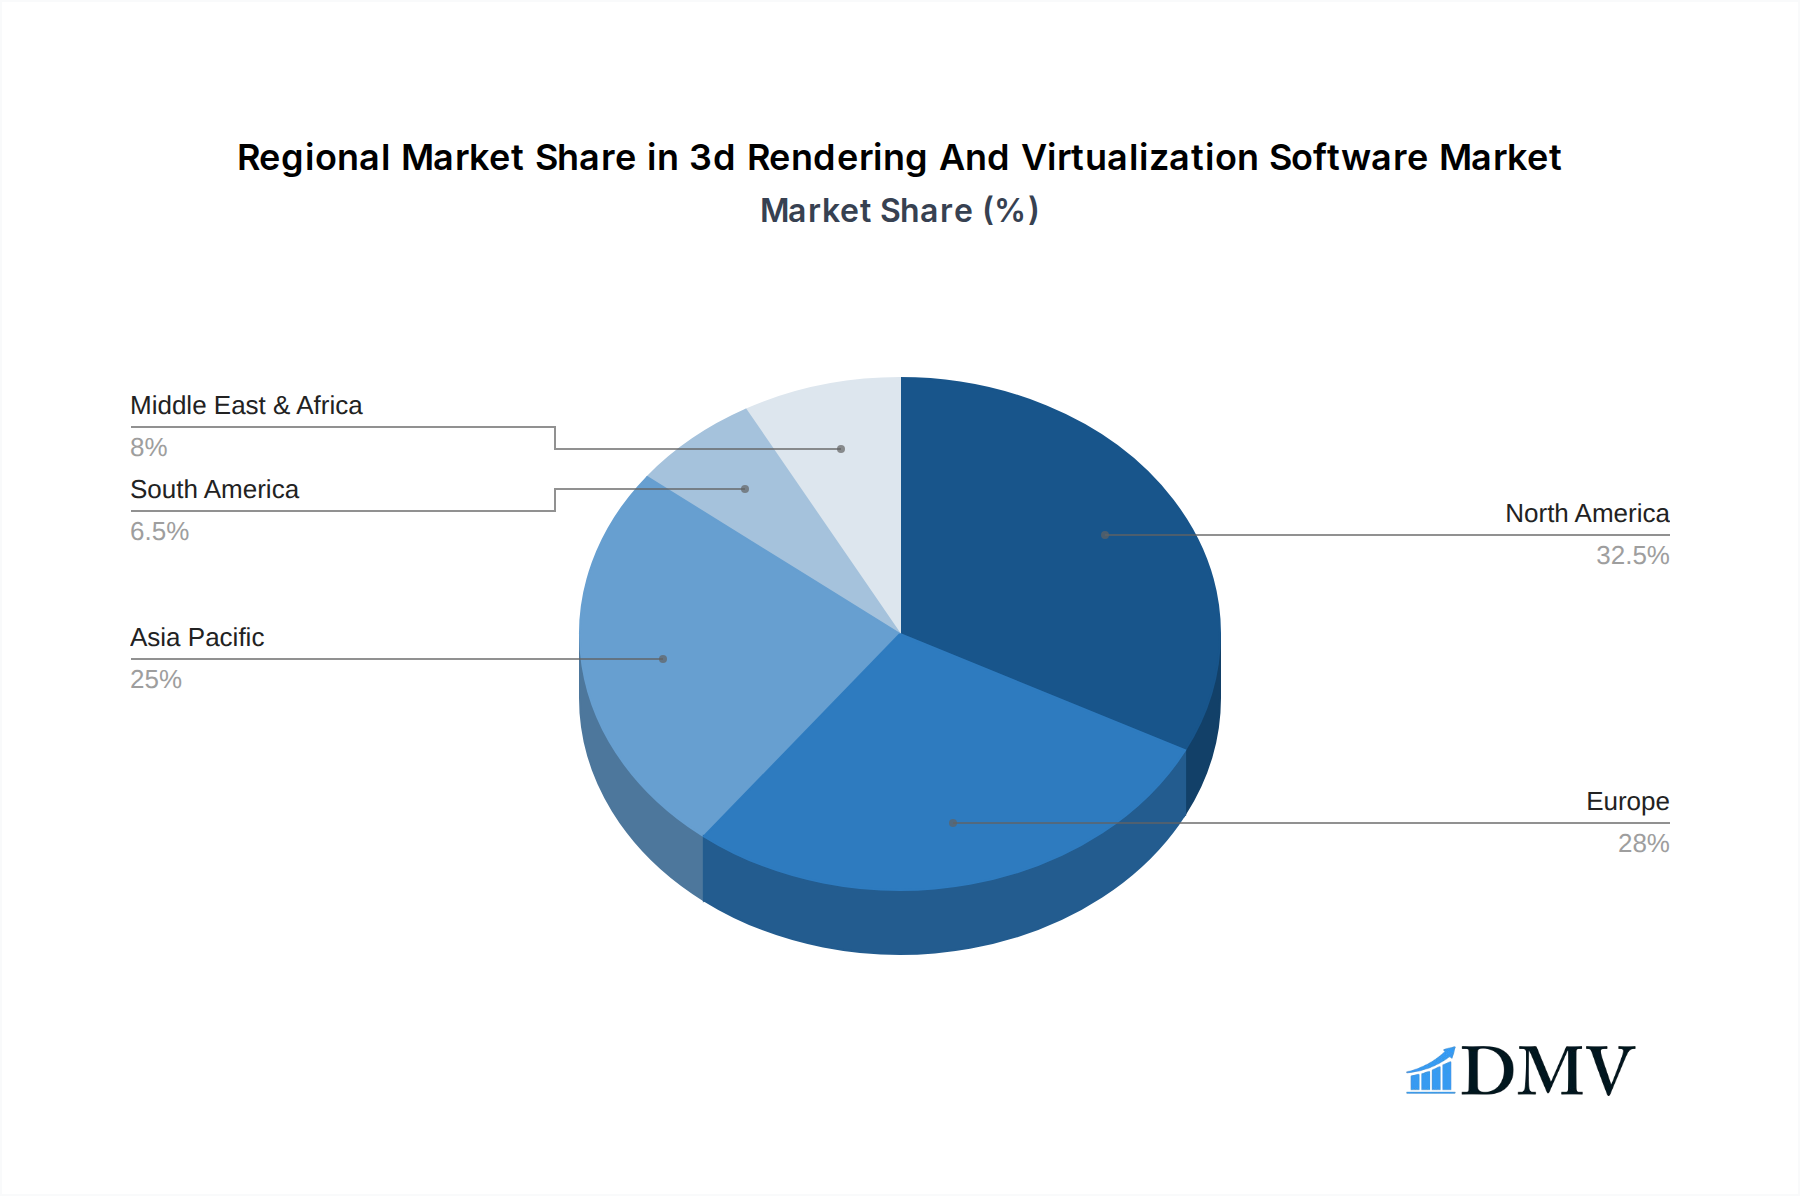
3d Rendering And Virtualization Software Regional Market Share
Geographic Coverage of 3d Rendering And Virtualization Software
3d Rendering And Virtualization Software REPORT HIGHLIGHTS
| Aspects | Details |
|---|---|
| Study Period | 2020-2034 |
| Base Year | 2025 |
| Estimated Year | 2026 |
| Forecast Period | 2026-2034 |
| Historical Period | 2020-2025 |
| Growth Rate | CAGR of 13.5% from 2020-2034 |
| Segmentation |
|
Table of Contents
- 1. Introduction
- 1.1. Research Scope
- 1.2. Market Segmentation
- 1.3. Research Methodology
- 1.4. Definitions and Assumptions
- 2. Executive Summary
- 2.1. Introduction
- 3. Market Dynamics
- 3.1. Introduction
- 3.2. Market Drivers
- 3.3. Market Restrains
- 3.4. Market Trends
- 4. Market Factor Analysis
- 4.1. Porters Five Forces
- 4.2. Supply/Value Chain
- 4.3. PESTEL analysis
- 4.4. Market Entropy
- 4.5. Patent/Trademark Analysis
- 5. Global 3d Rendering And Virtualization Software Analysis, Insights and Forecast, 2020-2032
- 5.1. Market Analysis, Insights and Forecast - by Application
- 5.1.1. Video Entertainment
- 5.1.2. Architecture
- 5.1.3. Industry
- 5.1.4. Transportation
- 5.2. Market Analysis, Insights and Forecast - by Type
- 5.2.1. Stand-Alone
- 5.2.2. Plugin
- 5.3. Market Analysis, Insights and Forecast - by Region
- 5.3.1. North America
- 5.3.2. South America
- 5.3.3. Europe
- 5.3.4. Middle East & Africa
- 5.3.5. Asia Pacific
- 5.1. Market Analysis, Insights and Forecast - by Application
- 6. North America 3d Rendering And Virtualization Software Analysis, Insights and Forecast, 2020-2032
- 6.1. Market Analysis, Insights and Forecast - by Application
- 6.1.1. Video Entertainment
- 6.1.2. Architecture
- 6.1.3. Industry
- 6.1.4. Transportation
- 6.2. Market Analysis, Insights and Forecast - by Type
- 6.2.1. Stand-Alone
- 6.2.2. Plugin
- 6.1. Market Analysis, Insights and Forecast - by Application
- 7. South America 3d Rendering And Virtualization Software Analysis, Insights and Forecast, 2020-2032
- 7.1. Market Analysis, Insights and Forecast - by Application
- 7.1.1. Video Entertainment
- 7.1.2. Architecture
- 7.1.3. Industry
- 7.1.4. Transportation
- 7.2. Market Analysis, Insights and Forecast - by Type
- 7.2.1. Stand-Alone
- 7.2.2. Plugin
- 7.1. Market Analysis, Insights and Forecast - by Application
- 8. Europe 3d Rendering And Virtualization Software Analysis, Insights and Forecast, 2020-2032
- 8.1. Market Analysis, Insights and Forecast - by Application
- 8.1.1. Video Entertainment
- 8.1.2. Architecture
- 8.1.3. Industry
- 8.1.4. Transportation
- 8.2. Market Analysis, Insights and Forecast - by Type
- 8.2.1. Stand-Alone
- 8.2.2. Plugin
- 8.1. Market Analysis, Insights and Forecast - by Application
- 9. Middle East & Africa 3d Rendering And Virtualization Software Analysis, Insights and Forecast, 2020-2032
- 9.1. Market Analysis, Insights and Forecast - by Application
- 9.1.1. Video Entertainment
- 9.1.2. Architecture
- 9.1.3. Industry
- 9.1.4. Transportation
- 9.2. Market Analysis, Insights and Forecast - by Type
- 9.2.1. Stand-Alone
- 9.2.2. Plugin
- 9.1. Market Analysis, Insights and Forecast - by Application
- 10. Asia Pacific 3d Rendering And Virtualization Software Analysis, Insights and Forecast, 2020-2032
- 10.1. Market Analysis, Insights and Forecast - by Application
- 10.1.1. Video Entertainment
- 10.1.2. Architecture
- 10.1.3. Industry
- 10.1.4. Transportation
- 10.2. Market Analysis, Insights and Forecast - by Type
- 10.2.1. Stand-Alone
- 10.2.2. Plugin
- 10.1. Market Analysis, Insights and Forecast - by Application
- 11. Competitive Analysis
- 11.1. Global Market Share Analysis 2025
- 11.2. Company Profiles
- 11.2.1 Pixar
- 11.2.1.1. Overview
- 11.2.1.2. Products
- 11.2.1.3. SWOT Analysis
- 11.2.1.4. Recent Developments
- 11.2.1.5. Financials (Based on Availability)
- 11.2.2 NVIDIA
- 11.2.2.1. Overview
- 11.2.2.2. Products
- 11.2.2.3. SWOT Analysis
- 11.2.2.4. Recent Developments
- 11.2.2.5. Financials (Based on Availability)
- 11.2.3 Chaos Group
- 11.2.3.1. Overview
- 11.2.3.2. Products
- 11.2.3.3. SWOT Analysis
- 11.2.3.4. Recent Developments
- 11.2.3.5. Financials (Based on Availability)
- 11.2.4 AUTODESK
- 11.2.4.1. Overview
- 11.2.4.2. Products
- 11.2.4.3. SWOT Analysis
- 11.2.4.4. Recent Developments
- 11.2.4.5. Financials (Based on Availability)
- 11.2.5 Solid Angle
- 11.2.5.1. Overview
- 11.2.5.2. Products
- 11.2.5.3. SWOT Analysis
- 11.2.5.4. Recent Developments
- 11.2.5.5. Financials (Based on Availability)
- 11.2.6 NextLimit
- 11.2.6.1. Overview
- 11.2.6.2. Products
- 11.2.6.3. SWOT Analysis
- 11.2.6.4. Recent Developments
- 11.2.6.5. Financials (Based on Availability)
- 11.2.7 Robert McNeel
- 11.2.7.1. Overview
- 11.2.7.2. Products
- 11.2.7.3. SWOT Analysis
- 11.2.7.4. Recent Developments
- 11.2.7.5. Financials (Based on Availability)
- 11.2.8 cebas
- 11.2.8.1. Overview
- 11.2.8.2. Products
- 11.2.8.3. SWOT Analysis
- 11.2.8.4. Recent Developments
- 11.2.8.5. Financials (Based on Availability)
- 11.2.9 Otoy
- 11.2.9.1. Overview
- 11.2.9.2. Products
- 11.2.9.3. SWOT Analysis
- 11.2.9.4. Recent Developments
- 11.2.9.5. Financials (Based on Availability)
- 11.2.10 Advent
- 11.2.10.1. Overview
- 11.2.10.2. Products
- 11.2.10.3. SWOT Analysis
- 11.2.10.4. Recent Developments
- 11.2.10.5. Financials (Based on Availability)
- 11.2.11 Bunkspeed (3ds)
- 11.2.11.1. Overview
- 11.2.11.2. Products
- 11.2.11.3. SWOT Analysis
- 11.2.11.4. Recent Developments
- 11.2.11.5. Financials (Based on Availability)
- 11.2.12 LUXION (KeyShot)
- 11.2.12.1. Overview
- 11.2.12.2. Products
- 11.2.12.3. SWOT Analysis
- 11.2.12.4. Recent Developments
- 11.2.12.5. Financials (Based on Availability)
- 11.2.13 Lumion
- 11.2.13.1. Overview
- 11.2.13.2. Products
- 11.2.13.3. SWOT Analysis
- 11.2.13.4. Recent Developments
- 11.2.13.5. Financials (Based on Availability)
- 11.2.14 SolidIRIS
- 11.2.14.1. Overview
- 11.2.14.2. Products
- 11.2.14.3. SWOT Analysis
- 11.2.14.4. Recent Developments
- 11.2.14.5. Financials (Based on Availability)
- 11.2.1 Pixar
List of Figures
- Figure 1: Global 3d Rendering And Virtualization Software Revenue Breakdown (million, %) by Region 2025 & 2033
- Figure 2: North America 3d Rendering And Virtualization Software Revenue (million), by Application 2025 & 2033
- Figure 3: North America 3d Rendering And Virtualization Software Revenue Share (%), by Application 2025 & 2033
- Figure 4: North America 3d Rendering And Virtualization Software Revenue (million), by Type 2025 & 2033
- Figure 5: North America 3d Rendering And Virtualization Software Revenue Share (%), by Type 2025 & 2033
- Figure 6: North America 3d Rendering And Virtualization Software Revenue (million), by Country 2025 & 2033
- Figure 7: North America 3d Rendering And Virtualization Software Revenue Share (%), by Country 2025 & 2033
- Figure 8: South America 3d Rendering And Virtualization Software Revenue (million), by Application 2025 & 2033
- Figure 9: South America 3d Rendering And Virtualization Software Revenue Share (%), by Application 2025 & 2033
- Figure 10: South America 3d Rendering And Virtualization Software Revenue (million), by Type 2025 & 2033
- Figure 11: South America 3d Rendering And Virtualization Software Revenue Share (%), by Type 2025 & 2033
- Figure 12: South America 3d Rendering And Virtualization Software Revenue (million), by Country 2025 & 2033
- Figure 13: South America 3d Rendering And Virtualization Software Revenue Share (%), by Country 2025 & 2033
- Figure 14: Europe 3d Rendering And Virtualization Software Revenue (million), by Application 2025 & 2033
- Figure 15: Europe 3d Rendering And Virtualization Software Revenue Share (%), by Application 2025 & 2033
- Figure 16: Europe 3d Rendering And Virtualization Software Revenue (million), by Type 2025 & 2033
- Figure 17: Europe 3d Rendering And Virtualization Software Revenue Share (%), by Type 2025 & 2033
- Figure 18: Europe 3d Rendering And Virtualization Software Revenue (million), by Country 2025 & 2033
- Figure 19: Europe 3d Rendering And Virtualization Software Revenue Share (%), by Country 2025 & 2033
- Figure 20: Middle East & Africa 3d Rendering And Virtualization Software Revenue (million), by Application 2025 & 2033
- Figure 21: Middle East & Africa 3d Rendering And Virtualization Software Revenue Share (%), by Application 2025 & 2033
- Figure 22: Middle East & Africa 3d Rendering And Virtualization Software Revenue (million), by Type 2025 & 2033
- Figure 23: Middle East & Africa 3d Rendering And Virtualization Software Revenue Share (%), by Type 2025 & 2033
- Figure 24: Middle East & Africa 3d Rendering And Virtualization Software Revenue (million), by Country 2025 & 2033
- Figure 25: Middle East & Africa 3d Rendering And Virtualization Software Revenue Share (%), by Country 2025 & 2033
- Figure 26: Asia Pacific 3d Rendering And Virtualization Software Revenue (million), by Application 2025 & 2033
- Figure 27: Asia Pacific 3d Rendering And Virtualization Software Revenue Share (%), by Application 2025 & 2033
- Figure 28: Asia Pacific 3d Rendering And Virtualization Software Revenue (million), by Type 2025 & 2033
- Figure 29: Asia Pacific 3d Rendering And Virtualization Software Revenue Share (%), by Type 2025 & 2033
- Figure 30: Asia Pacific 3d Rendering And Virtualization Software Revenue (million), by Country 2025 & 2033
- Figure 31: Asia Pacific 3d Rendering And Virtualization Software Revenue Share (%), by Country 2025 & 2033
List of Tables
- Table 1: Global 3d Rendering And Virtualization Software Revenue million Forecast, by Application 2020 & 2033
- Table 2: Global 3d Rendering And Virtualization Software Revenue million Forecast, by Type 2020 & 2033
- Table 3: Global 3d Rendering And Virtualization Software Revenue million Forecast, by Region 2020 & 2033
- Table 4: Global 3d Rendering And Virtualization Software Revenue million Forecast, by Application 2020 & 2033
- Table 5: Global 3d Rendering And Virtualization Software Revenue million Forecast, by Type 2020 & 2033
- Table 6: Global 3d Rendering And Virtualization Software Revenue million Forecast, by Country 2020 & 2033
- Table 7: United States 3d Rendering And Virtualization Software Revenue (million) Forecast, by Application 2020 & 2033
- Table 8: Canada 3d Rendering And Virtualization Software Revenue (million) Forecast, by Application 2020 & 2033
- Table 9: Mexico 3d Rendering And Virtualization Software Revenue (million) Forecast, by Application 2020 & 2033
- Table 10: Global 3d Rendering And Virtualization Software Revenue million Forecast, by Application 2020 & 2033
- Table 11: Global 3d Rendering And Virtualization Software Revenue million Forecast, by Type 2020 & 2033
- Table 12: Global 3d Rendering And Virtualization Software Revenue million Forecast, by Country 2020 & 2033
- Table 13: Brazil 3d Rendering And Virtualization Software Revenue (million) Forecast, by Application 2020 & 2033
- Table 14: Argentina 3d Rendering And Virtualization Software Revenue (million) Forecast, by Application 2020 & 2033
- Table 15: Rest of South America 3d Rendering And Virtualization Software Revenue (million) Forecast, by Application 2020 & 2033
- Table 16: Global 3d Rendering And Virtualization Software Revenue million Forecast, by Application 2020 & 2033
- Table 17: Global 3d Rendering And Virtualization Software Revenue million Forecast, by Type 2020 & 2033
- Table 18: Global 3d Rendering And Virtualization Software Revenue million Forecast, by Country 2020 & 2033
- Table 19: United Kingdom 3d Rendering And Virtualization Software Revenue (million) Forecast, by Application 2020 & 2033
- Table 20: Germany 3d Rendering And Virtualization Software Revenue (million) Forecast, by Application 2020 & 2033
- Table 21: France 3d Rendering And Virtualization Software Revenue (million) Forecast, by Application 2020 & 2033
- Table 22: Italy 3d Rendering And Virtualization Software Revenue (million) Forecast, by Application 2020 & 2033
- Table 23: Spain 3d Rendering And Virtualization Software Revenue (million) Forecast, by Application 2020 & 2033
- Table 24: Russia 3d Rendering And Virtualization Software Revenue (million) Forecast, by Application 2020 & 2033
- Table 25: Benelux 3d Rendering And Virtualization Software Revenue (million) Forecast, by Application 2020 & 2033
- Table 26: Nordics 3d Rendering And Virtualization Software Revenue (million) Forecast, by Application 2020 & 2033
- Table 27: Rest of Europe 3d Rendering And Virtualization Software Revenue (million) Forecast, by Application 2020 & 2033
- Table 28: Global 3d Rendering And Virtualization Software Revenue million Forecast, by Application 2020 & 2033
- Table 29: Global 3d Rendering And Virtualization Software Revenue million Forecast, by Type 2020 & 2033
- Table 30: Global 3d Rendering And Virtualization Software Revenue million Forecast, by Country 2020 & 2033
- Table 31: Turkey 3d Rendering And Virtualization Software Revenue (million) Forecast, by Application 2020 & 2033
- Table 32: Israel 3d Rendering And Virtualization Software Revenue (million) Forecast, by Application 2020 & 2033
- Table 33: GCC 3d Rendering And Virtualization Software Revenue (million) Forecast, by Application 2020 & 2033
- Table 34: North Africa 3d Rendering And Virtualization Software Revenue (million) Forecast, by Application 2020 & 2033
- Table 35: South Africa 3d Rendering And Virtualization Software Revenue (million) Forecast, by Application 2020 & 2033
- Table 36: Rest of Middle East & Africa 3d Rendering And Virtualization Software Revenue (million) Forecast, by Application 2020 & 2033
- Table 37: Global 3d Rendering And Virtualization Software Revenue million Forecast, by Application 2020 & 2033
- Table 38: Global 3d Rendering And Virtualization Software Revenue million Forecast, by Type 2020 & 2033
- Table 39: Global 3d Rendering And Virtualization Software Revenue million Forecast, by Country 2020 & 2033
- Table 40: China 3d Rendering And Virtualization Software Revenue (million) Forecast, by Application 2020 & 2033
- Table 41: India 3d Rendering And Virtualization Software Revenue (million) Forecast, by Application 2020 & 2033
- Table 42: Japan 3d Rendering And Virtualization Software Revenue (million) Forecast, by Application 2020 & 2033
- Table 43: South Korea 3d Rendering And Virtualization Software Revenue (million) Forecast, by Application 2020 & 2033
- Table 44: ASEAN 3d Rendering And Virtualization Software Revenue (million) Forecast, by Application 2020 & 2033
- Table 45: Oceania 3d Rendering And Virtualization Software Revenue (million) Forecast, by Application 2020 & 2033
- Table 46: Rest of Asia Pacific 3d Rendering And Virtualization Software Revenue (million) Forecast, by Application 2020 & 2033
Frequently Asked Questions
1. What is the projected Compound Annual Growth Rate (CAGR) of the 3d Rendering And Virtualization Software?
The projected CAGR is approximately 13.5%.
2. Which companies are prominent players in the 3d Rendering And Virtualization Software?
Key companies in the market include Pixar, NVIDIA, Chaos Group, AUTODESK, Solid Angle, NextLimit, Robert McNeel, cebas, Otoy, Advent, Bunkspeed (3ds), LUXION (KeyShot), Lumion, SolidIRIS.
3. What are the main segments of the 3d Rendering And Virtualization Software?
The market segments include Application, Type.
4. Can you provide details about the market size?
The market size is estimated to be USD 311 million as of 2022.
5. What are some drivers contributing to market growth?
N/A
6. What are the notable trends driving market growth?
N/A
7. Are there any restraints impacting market growth?
N/A
8. Can you provide examples of recent developments in the market?
N/A
9. What pricing options are available for accessing the report?
Pricing options include single-user, multi-user, and enterprise licenses priced at USD 3950.00, USD 5925.00, and USD 7900.00 respectively.
10. Is the market size provided in terms of value or volume?
The market size is provided in terms of value, measured in million.
11. Are there any specific market keywords associated with the report?
Yes, the market keyword associated with the report is "3d Rendering And Virtualization Software," which aids in identifying and referencing the specific market segment covered.
12. How do I determine which pricing option suits my needs best?
The pricing options vary based on user requirements and access needs. Individual users may opt for single-user licenses, while businesses requiring broader access may choose multi-user or enterprise licenses for cost-effective access to the report.
13. Are there any additional resources or data provided in the 3d Rendering And Virtualization Software report?
While the report offers comprehensive insights, it's advisable to review the specific contents or supplementary materials provided to ascertain if additional resources or data are available.
14. How can I stay updated on further developments or reports in the 3d Rendering And Virtualization Software?
To stay informed about further developments, trends, and reports in the 3d Rendering And Virtualization Software, consider subscribing to industry newsletters, following relevant companies and organizations, or regularly checking reputable industry news sources and publications.
Methodology
Step 1 - Identification of Relevant Samples Size from Population Database


Step 2 - Approaches for Defining Global Market Size (Value, Volume* & Price*)

Note*: In applicable scenarios
Step 3 - Data Sources
Primary Research
- Web Analytics
- Survey Reports
- Research Institute
- Latest Research Reports
- Opinion Leaders
Secondary Research
- Annual Reports
- White Paper
- Latest Press Release
- Industry Association
- Paid Database
- Investor Presentations

Step 4 - Data Triangulation
Involves using different sources of information in order to increase the validity of a study
These sources are likely to be stakeholders in a program - participants, other researchers, program staff, other community members, and so on.
Then we put all data in single framework & apply various statistical tools to find out the dynamic on the market.
During the analysis stage, feedback from the stakeholder groups would be compared to determine areas of agreement as well as areas of divergence