

Key Insights
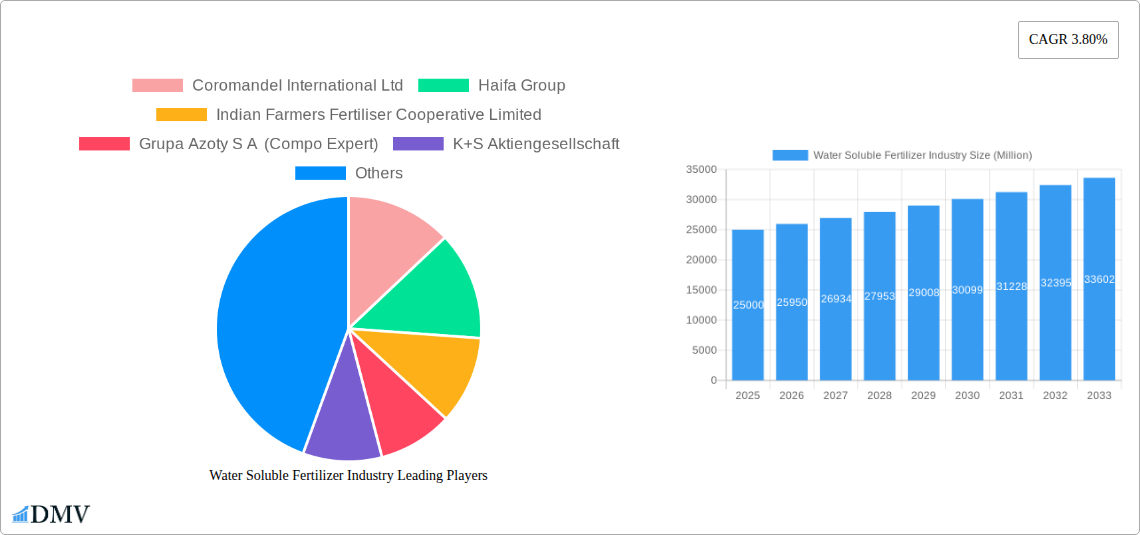
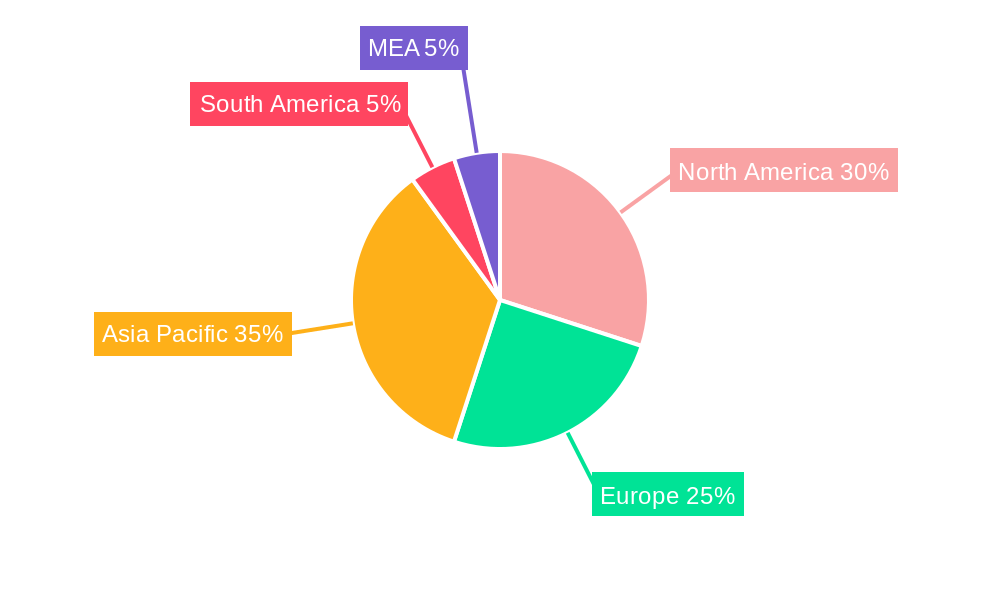
The water-soluble fertilizer market is experiencing robust growth, driven by the increasing demand for high-yield agriculture and the rising adoption of precision farming techniques. The market's Compound Annual Growth Rate (CAGR) of 3.80% from 2019 to 2024 indicates a steady expansion, projected to continue through 2033. Key drivers include the growing global population necessitating increased food production, the shift towards intensive farming practices, and the rising awareness of the benefits of water-soluble fertilizers in enhancing crop nutrient uptake efficiency. The market is segmented by application mode (fertigation and foliar), crop type (field crops, horticultural crops, and turf & ornamental), and fertilizer type (complex and straight, including secondary macronutrients). Fertigation, the application of fertilizers through irrigation systems, is gaining traction due to its precision and efficiency. The demand for complex fertilizers, offering a blend of multiple nutrients, is also significantly increasing, driven by the need for balanced plant nutrition. Geographical distribution reveals strong market presence across North America, Europe, and the Asia-Pacific region, with these regions showcasing significant growth opportunities. Leading players such as Coromandel International, Haifa Group, and Yara International are actively shaping the market landscape through product innovation and strategic partnerships.
While the market shows considerable promise, certain restraints exist. These include fluctuating raw material prices, concerns about environmental impact (e.g., potential water contamination), and the relatively high cost of water-soluble fertilizers compared to traditional granular fertilizers. However, the advancements in fertilizer technology, such as the development of slow-release formulations and nutrient-efficient products, are mitigating these challenges. The future of the water-soluble fertilizer market appears bright, fueled by sustained agricultural growth, technological advancements, and a growing focus on sustainable agricultural practices. The market's continued expansion will depend on addressing environmental concerns and balancing the cost-effectiveness of the products with their efficiency. Further market segmentation analysis considering specific geographical regions and crop types would offer a more refined outlook.
Water Soluble Fertilizer Industry: A Comprehensive Market Report (2019-2033)
This insightful report provides a comprehensive analysis of the Water Soluble Fertilizer industry, offering a detailed examination of market trends, key players, and future growth prospects. From market size and segmentation to technological advancements and regulatory influences, this report equips stakeholders with the knowledge needed to navigate this dynamic sector. The study period spans from 2019 to 2033, with a base year of 2025 and a forecast period of 2025-2033. The historical period covered is 2019-2024. The global market value in 2025 is estimated to reach xx Million.
Water Soluble Fertilizer Industry Market Composition & Trends
This section delves into the competitive landscape of the water soluble fertilizer market, analyzing market concentration, innovation drivers, regulatory frameworks, substitute products, and end-user behavior. We examine the impact of mergers and acquisitions (M&A) activities, providing insights into deal values and their effect on market share distribution. The report includes detailed analysis of the key players such as Coromandel International Ltd, Haifa Group, Indian Farmers Fertiliser Cooperative Limited, Grupa Azoty S A (Compo Expert), K+S Aktiengesellschaft, Yara International AS, ICL Group Ltd, BMS Micro-Nutrients NV, and Sociedad Quimica y Minera de Chile SA. Market share distribution among these players in 2025 is estimated as follows (values in Million): Coromandel International Ltd (xx%), Haifa Group (xx%), Indian Farmers Fertiliser Cooperative Limited (xx%), Grupa Azoty S A (Compo Expert) (xx%), K+S Aktiengesellschaft (xx%), Yara International AS (xx%), ICL Group Ltd (xx%), BMS Micro-Nutrients NV (xx%), Sociedad Quimica y Minera de Chile SA (xx%). The total market value is predicted to be xx Million. Recent M&A activity, like K+S's acquisition of a 75% stake in Industrial Commodities Holdings (Pty) Ltd's fertilizer business for an estimated xx Million, is analyzed for its impact on market dynamics and geographic expansion. Furthermore, the report assesses the influence of substitute products and evolving regulatory landscapes on market growth.
- Market Concentration: Analysis of the Herfindahl-Hirschman Index (HHI) and market share distribution among key players.
- Innovation Catalysts: Examination of R&D investments, technological advancements, and their impact on product development.
- Regulatory Landscape: Assessment of governmental policies, environmental regulations, and their influence on market growth.
- Substitute Products: Analysis of alternative fertilizers and their competitive impact on the water-soluble fertilizer market.
- End-User Profiles: Detailed segmentation of end-users across various crop types and application modes.
- M&A Activity: Detailed analysis of significant mergers and acquisitions, including deal values and strategic implications.
Water Soluble Fertilizer Industry Industry Evolution
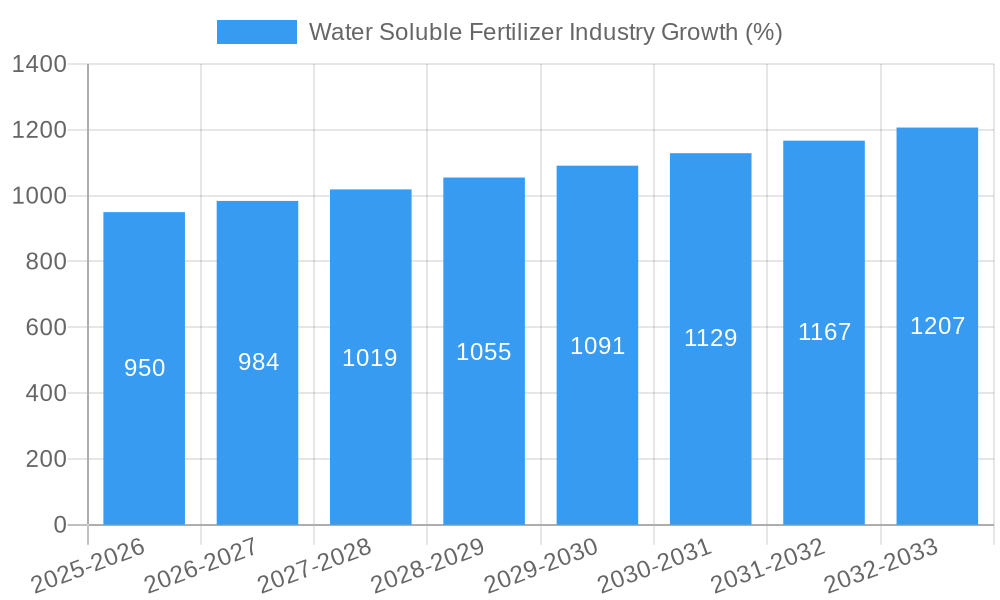
This section traces the evolution of the water soluble fertilizer industry, examining historical growth trajectories, emerging technological advancements, and shifts in consumer demand. We analyze the adoption rates of new technologies and their correlation with market growth. Key factors influencing market growth (e.g., improved crop yields, rising agricultural output, increased demand for high-quality crops, government initiatives) are explored. The report examines the growth rate of the industry over the historical period (2019-2024) at xx% CAGR. Growth forecasts for the coming years are presented, with a predicted CAGR of xx% from 2025-2033, leading to a projected market value of xx Million by 2033. This section will also examine the impact of technological innovations, including precision agriculture techniques and controlled-release fertilizer technologies, on market dynamics. The report further analyzes consumer preferences towards sustainable and environmentally friendly fertilizers and how this trend influences industry development.
Leading Regions, Countries, or Segments in Water Soluble Fertilizer Industry
This section identifies the dominant regions, countries, and segments within the water-soluble fertilizer market. We focus on Application Mode (Fertigation, Foliar), Crop Type (Field Crops, Horticultural Crops, Turf & Ornamental), and Type (Complex, Straight, Secondary Macronutrients). The analysis highlights key drivers behind the dominance of these specific segments and regions.
- Dominant Region/Country: [Insert Dominant Region/Country and reasons in a paragraph, including factors like agricultural practices, government policies, and economic development.]
- Key Drivers for Segment Dominance (Bullet Points):
- Fertigation: [Reasons for dominance - e.g., water conservation, efficient nutrient delivery]
- Foliar: [Reasons for dominance - e.g., rapid nutrient uptake, suitability for specific crops]
- Field Crops: [Reasons for dominance - e.g., large-scale application, high demand]
- Horticultural Crops: [Reasons for dominance - e.g., high value crops, need for precise nutrient management]
- Turf & Ornamental: [Reasons for dominance - e.g., aesthetic requirements, high-quality standards]
- Complex Fertilizers: [Reasons for dominance - e.g., balanced nutrient supply, ease of application]
- Straight Fertilizers: [Reasons for dominance - e.g., targeted nutrient application, cost-effectiveness for specific deficiencies]
- Secondary Macronutrients: [Reasons for dominance - e.g., growing awareness of their importance, improved crop quality]
Water Soluble Fertilizer Industry Product Innovations
This section details recent innovations in water-soluble fertilizers, emphasizing unique selling propositions (USPs) and technological advancements. New product formulations, such as ICL's Solinure with enhanced trace elements, are discussed. Improvements in fertilizer efficiency, reduced environmental impact, and customized nutrient blends are highlighted. Advances in controlled-release technologies and precision application methods are also examined. Performance metrics, including yield improvements and cost reductions, will be included whenever data is available.
Propelling Factors for Water Soluble Fertilizer Industry Growth
Several factors contribute to the growth of the water-soluble fertilizer industry. Technological advancements, such as precision agriculture and controlled-release formulations, enhance efficiency and reduce environmental impact. The increasing demand for high-quality food products drives the adoption of these fertilizers, ensuring optimal crop yields and quality. Favorable government policies and investment in agricultural research further stimulate market expansion.
Obstacles in the Water Soluble Fertilizer Industry Market
Despite positive growth trends, challenges remain. Fluctuations in raw material prices and supply chain disruptions can impact production costs and availability. Stringent environmental regulations require manufacturers to invest in sustainable practices. Intense competition among established players and new entrants creates pricing pressures.
Future Opportunities in Water Soluble Fertilizer Industry
Emerging markets in developing economies, coupled with a growing need for sustainable agricultural practices, present significant opportunities. Technological innovation in areas like nanotechnology and bio-fertilizers offer avenues for creating more efficient and environmentally friendly products. Meeting the growing demand for organic and sustainable fertilizers creates further growth potential.
Major Players in the Water Soluble Fertilizer Industry Ecosystem
- Coromandel International Ltd
- Haifa Group
- Indian Farmers Fertiliser Cooperative Limited
- Grupa Azoty S A (Compo Expert)
- K+S Aktiengesellschaft
- Yara International AS
- ICL Group Ltd
- BMS Micro-Nutrients NV
- Sociedad Quimica y Minera de Chile SA
Key Developments in Water Soluble Fertilizer Industry Industry
- April 2023: K+S acquired a 75% share of the fertilizer business of South African trading company Industrial Commodities Holdings (Pty) Ltd (ICH), expanding its operations in southern and eastern Africa and establishing FertivPty Ltd as a joint venture.
- May 2022: ICL launched three new NPK formulations of Solinure, optimizing yields with increased trace elements.
- May 2022: ICL secured agreements to supply 600,000 metric tons of potash to India and 700,000 metric tons to China at USD 590 per ton.
Strategic Water Soluble Fertilizer Industry Market Forecast
The water-soluble fertilizer market is poised for significant growth, driven by technological innovation, increasing demand for high-quality food products, and supportive government policies. Emerging markets and the growing focus on sustainability will further fuel market expansion. The forecast period suggests continued growth, highlighting the industry's substantial potential.
Water Soluble Fertilizer Industry Segmentation
- 1. Production Analysis
- 2. Consumption Analysis
- 3. Import Market Analysis (Value & Volume)
- 4. Export Market Analysis (Value & Volume)
- 5. Price Trend Analysis
Water Soluble Fertilizer Industry Segmentation By Geography
-
1. North America
- 1.1. United States
- 1.2. Canada
- 1.3. Mexico
-
2. South America
- 2.1. Brazil
- 2.2. Argentina
- 2.3. Rest of South America
-
3. Europe
- 3.1. United Kingdom
- 3.2. Germany
- 3.3. France
- 3.4. Italy
- 3.5. Spain
- 3.6. Russia
- 3.7. Benelux
- 3.8. Nordics
- 3.9. Rest of Europe
-
4. Middle East & Africa
- 4.1. Turkey
- 4.2. Israel
- 4.3. GCC
- 4.4. North Africa
- 4.5. South Africa
- 4.6. Rest of Middle East & Africa
-
5. Asia Pacific
- 5.1. China
- 5.2. India
- 5.3. Japan
- 5.4. South Korea
- 5.5. ASEAN
- 5.6. Oceania
- 5.7. Rest of Asia Pacific
Water Soluble Fertilizer Industry REPORT HIGHLIGHTS
| Aspects | Details |
|---|---|
| Study Period | 2019-2033 |
| Base Year | 2024 |
| Estimated Year | 2025 |
| Forecast Period | 2025-2033 |
| Historical Period | 2019-2024 |
| Growth Rate | CAGR of 3.80% from 2019-2033 |
| Segmentation |
|
Table of Contents
- 1. Introduction
- 1.1. Research Scope
- 1.2. Market Segmentation
- 1.3. Research Methodology
- 1.4. Definitions and Assumptions
- 2. Executive Summary
- 2.1. Introduction
- 3. Market Dynamics
- 3.1. Introduction
- 3.2. Market Drivers
- 3.2.1. Adoption of Organic and Eco-friendly Farming Practices; Declining Area of Arable Land and Rising Food Security Concerns
- 3.3. Market Restrains
- 3.3.1. High Demand for Conventional and Synthetic Products; Lack of Awareness and Other Factors Limiting the Adoption of Agricultural Inoculants
- 3.4. Market Trends
- 3.4.1. OTHER KEY INDUSTRY TRENDS COVERED IN THE REPORT
- 4. Market Factor Analysis
- 4.1. Porters Five Forces
- 4.2. Supply/Value Chain
- 4.3. PESTEL analysis
- 4.4. Market Entropy
- 4.5. Patent/Trademark Analysis
- 5. Global Water Soluble Fertilizer Industry Analysis, Insights and Forecast, 2019-2031
- 5.1. Market Analysis, Insights and Forecast - by Production Analysis
- 5.2. Market Analysis, Insights and Forecast - by Consumption Analysis
- 5.3. Market Analysis, Insights and Forecast - by Import Market Analysis (Value & Volume)
- 5.4. Market Analysis, Insights and Forecast - by Export Market Analysis (Value & Volume)
- 5.5. Market Analysis, Insights and Forecast - by Price Trend Analysis
- 5.6. Market Analysis, Insights and Forecast - by Region
- 5.6.1. North America
- 5.6.2. South America
- 5.6.3. Europe
- 5.6.4. Middle East & Africa
- 5.6.5. Asia Pacific
- 5.1. Market Analysis, Insights and Forecast - by Production Analysis
- 6. North America Water Soluble Fertilizer Industry Analysis, Insights and Forecast, 2019-2031
- 6.1. Market Analysis, Insights and Forecast - by Production Analysis
- 6.2. Market Analysis, Insights and Forecast - by Consumption Analysis
- 6.3. Market Analysis, Insights and Forecast - by Import Market Analysis (Value & Volume)
- 6.4. Market Analysis, Insights and Forecast - by Export Market Analysis (Value & Volume)
- 6.5. Market Analysis, Insights and Forecast - by Price Trend Analysis
- 6.1. Market Analysis, Insights and Forecast - by Production Analysis
- 7. South America Water Soluble Fertilizer Industry Analysis, Insights and Forecast, 2019-2031
- 7.1. Market Analysis, Insights and Forecast - by Production Analysis
- 7.2. Market Analysis, Insights and Forecast - by Consumption Analysis
- 7.3. Market Analysis, Insights and Forecast - by Import Market Analysis (Value & Volume)
- 7.4. Market Analysis, Insights and Forecast - by Export Market Analysis (Value & Volume)
- 7.5. Market Analysis, Insights and Forecast - by Price Trend Analysis
- 7.1. Market Analysis, Insights and Forecast - by Production Analysis
- 8. Europe Water Soluble Fertilizer Industry Analysis, Insights and Forecast, 2019-2031
- 8.1. Market Analysis, Insights and Forecast - by Production Analysis
- 8.2. Market Analysis, Insights and Forecast - by Consumption Analysis
- 8.3. Market Analysis, Insights and Forecast - by Import Market Analysis (Value & Volume)
- 8.4. Market Analysis, Insights and Forecast - by Export Market Analysis (Value & Volume)
- 8.5. Market Analysis, Insights and Forecast - by Price Trend Analysis
- 8.1. Market Analysis, Insights and Forecast - by Production Analysis
- 9. Middle East & Africa Water Soluble Fertilizer Industry Analysis, Insights and Forecast, 2019-2031
- 9.1. Market Analysis, Insights and Forecast - by Production Analysis
- 9.2. Market Analysis, Insights and Forecast - by Consumption Analysis
- 9.3. Market Analysis, Insights and Forecast - by Import Market Analysis (Value & Volume)
- 9.4. Market Analysis, Insights and Forecast - by Export Market Analysis (Value & Volume)
- 9.5. Market Analysis, Insights and Forecast - by Price Trend Analysis
- 9.1. Market Analysis, Insights and Forecast - by Production Analysis
- 10. Asia Pacific Water Soluble Fertilizer Industry Analysis, Insights and Forecast, 2019-2031
- 10.1. Market Analysis, Insights and Forecast - by Production Analysis
- 10.2. Market Analysis, Insights and Forecast - by Consumption Analysis
- 10.3. Market Analysis, Insights and Forecast - by Import Market Analysis (Value & Volume)
- 10.4. Market Analysis, Insights and Forecast - by Export Market Analysis (Value & Volume)
- 10.5. Market Analysis, Insights and Forecast - by Price Trend Analysis
- 10.1. Market Analysis, Insights and Forecast - by Production Analysis
- 11. North America Water Soluble Fertilizer Industry Analysis, Insights and Forecast, 2019-2031
- 11.1. Market Analysis, Insights and Forecast - By Country/Sub-region
- 11.1.1 United States
- 11.1.2 Canada
- 11.1.3 Mexico
- 12. South America Water Soluble Fertilizer Industry Analysis, Insights and Forecast, 2019-2031
- 12.1. Market Analysis, Insights and Forecast - By Country/Sub-region
- 12.1.1 Brazil
- 12.1.2 Argentina
- 12.1.3 Rest of South America
- 13. Asia Pacific Water Soluble Fertilizer Industry Analysis, Insights and Forecast, 2019-2031
- 13.1. Market Analysis, Insights and Forecast - By Country/Sub-region
- 13.1.1 China
- 13.1.2 Japan
- 13.1.3 India
- 13.1.4 South Korea
- 13.1.5 Taiwan
- 13.1.6 Australia
- 13.1.7 Rest of Asia-Pacific
- 14. Europe Water Soluble Fertilizer Industry Analysis, Insights and Forecast, 2019-2031
- 14.1. Market Analysis, Insights and Forecast - By Country/Sub-region
- 14.1.1 Germany
- 14.1.2 France
- 14.1.3 Italy
- 14.1.4 United Kingdom
- 14.1.5 Netherlands
- 14.1.6 Rest of Europe
- 15. MEA Water Soluble Fertilizer Industry Analysis, Insights and Forecast, 2019-2031
- 15.1. Market Analysis, Insights and Forecast - By Country/Sub-region
- 15.1.1 Middle East
- 15.1.2 Africa
- 16. Competitive Analysis
- 16.1. Global Market Share Analysis 2024
- 16.2. Company Profiles
- 16.2.1 Coromandel International Ltd
- 16.2.1.1. Overview
- 16.2.1.2. Products
- 16.2.1.3. SWOT Analysis
- 16.2.1.4. Recent Developments
- 16.2.1.5. Financials (Based on Availability)
- 16.2.2 Haifa Group
- 16.2.2.1. Overview
- 16.2.2.2. Products
- 16.2.2.3. SWOT Analysis
- 16.2.2.4. Recent Developments
- 16.2.2.5. Financials (Based on Availability)
- 16.2.3 Indian Farmers Fertiliser Cooperative Limited
- 16.2.3.1. Overview
- 16.2.3.2. Products
- 16.2.3.3. SWOT Analysis
- 16.2.3.4. Recent Developments
- 16.2.3.5. Financials (Based on Availability)
- 16.2.4 Grupa Azoty S A (Compo Expert)
- 16.2.4.1. Overview
- 16.2.4.2. Products
- 16.2.4.3. SWOT Analysis
- 16.2.4.4. Recent Developments
- 16.2.4.5. Financials (Based on Availability)
- 16.2.5 K+S Aktiengesellschaft
- 16.2.5.1. Overview
- 16.2.5.2. Products
- 16.2.5.3. SWOT Analysis
- 16.2.5.4. Recent Developments
- 16.2.5.5. Financials (Based on Availability)
- 16.2.6 Yara International AS
- 16.2.6.1. Overview
- 16.2.6.2. Products
- 16.2.6.3. SWOT Analysis
- 16.2.6.4. Recent Developments
- 16.2.6.5. Financials (Based on Availability)
- 16.2.7 ICL Group Ltd
- 16.2.7.1. Overview
- 16.2.7.2. Products
- 16.2.7.3. SWOT Analysis
- 16.2.7.4. Recent Developments
- 16.2.7.5. Financials (Based on Availability)
- 16.2.8 BMS Micro-Nutrients NV
- 16.2.8.1. Overview
- 16.2.8.2. Products
- 16.2.8.3. SWOT Analysis
- 16.2.8.4. Recent Developments
- 16.2.8.5. Financials (Based on Availability)
- 16.2.9 Sociedad Quimica y Minera de Chile SA
- 16.2.9.1. Overview
- 16.2.9.2. Products
- 16.2.9.3. SWOT Analysis
- 16.2.9.4. Recent Developments
- 16.2.9.5. Financials (Based on Availability)
- 16.2.1 Coromandel International Ltd
List of Figures
- Figure 1: Global Water Soluble Fertilizer Industry Revenue Breakdown (Million, %) by Region 2024 & 2032
- Figure 2: North America Water Soluble Fertilizer Industry Revenue (Million), by Country 2024 & 2032
- Figure 3: North America Water Soluble Fertilizer Industry Revenue Share (%), by Country 2024 & 2032
- Figure 4: South America Water Soluble Fertilizer Industry Revenue (Million), by Country 2024 & 2032
- Figure 5: South America Water Soluble Fertilizer Industry Revenue Share (%), by Country 2024 & 2032
- Figure 6: Asia Pacific Water Soluble Fertilizer Industry Revenue (Million), by Country 2024 & 2032
- Figure 7: Asia Pacific Water Soluble Fertilizer Industry Revenue Share (%), by Country 2024 & 2032
- Figure 8: Europe Water Soluble Fertilizer Industry Revenue (Million), by Country 2024 & 2032
- Figure 9: Europe Water Soluble Fertilizer Industry Revenue Share (%), by Country 2024 & 2032
- Figure 10: MEA Water Soluble Fertilizer Industry Revenue (Million), by Country 2024 & 2032
- Figure 11: MEA Water Soluble Fertilizer Industry Revenue Share (%), by Country 2024 & 2032
- Figure 12: North America Water Soluble Fertilizer Industry Revenue (Million), by Production Analysis 2024 & 2032
- Figure 13: North America Water Soluble Fertilizer Industry Revenue Share (%), by Production Analysis 2024 & 2032
- Figure 14: North America Water Soluble Fertilizer Industry Revenue (Million), by Consumption Analysis 2024 & 2032
- Figure 15: North America Water Soluble Fertilizer Industry Revenue Share (%), by Consumption Analysis 2024 & 2032
- Figure 16: North America Water Soluble Fertilizer Industry Revenue (Million), by Import Market Analysis (Value & Volume) 2024 & 2032
- Figure 17: North America Water Soluble Fertilizer Industry Revenue Share (%), by Import Market Analysis (Value & Volume) 2024 & 2032
- Figure 18: North America Water Soluble Fertilizer Industry Revenue (Million), by Export Market Analysis (Value & Volume) 2024 & 2032
- Figure 19: North America Water Soluble Fertilizer Industry Revenue Share (%), by Export Market Analysis (Value & Volume) 2024 & 2032
- Figure 20: North America Water Soluble Fertilizer Industry Revenue (Million), by Price Trend Analysis 2024 & 2032
- Figure 21: North America Water Soluble Fertilizer Industry Revenue Share (%), by Price Trend Analysis 2024 & 2032
- Figure 22: North America Water Soluble Fertilizer Industry Revenue (Million), by Country 2024 & 2032
- Figure 23: North America Water Soluble Fertilizer Industry Revenue Share (%), by Country 2024 & 2032
- Figure 24: South America Water Soluble Fertilizer Industry Revenue (Million), by Production Analysis 2024 & 2032
- Figure 25: South America Water Soluble Fertilizer Industry Revenue Share (%), by Production Analysis 2024 & 2032
- Figure 26: South America Water Soluble Fertilizer Industry Revenue (Million), by Consumption Analysis 2024 & 2032
- Figure 27: South America Water Soluble Fertilizer Industry Revenue Share (%), by Consumption Analysis 2024 & 2032
- Figure 28: South America Water Soluble Fertilizer Industry Revenue (Million), by Import Market Analysis (Value & Volume) 2024 & 2032
- Figure 29: South America Water Soluble Fertilizer Industry Revenue Share (%), by Import Market Analysis (Value & Volume) 2024 & 2032
- Figure 30: South America Water Soluble Fertilizer Industry Revenue (Million), by Export Market Analysis (Value & Volume) 2024 & 2032
- Figure 31: South America Water Soluble Fertilizer Industry Revenue Share (%), by Export Market Analysis (Value & Volume) 2024 & 2032
- Figure 32: South America Water Soluble Fertilizer Industry Revenue (Million), by Price Trend Analysis 2024 & 2032
- Figure 33: South America Water Soluble Fertilizer Industry Revenue Share (%), by Price Trend Analysis 2024 & 2032
- Figure 34: South America Water Soluble Fertilizer Industry Revenue (Million), by Country 2024 & 2032
- Figure 35: South America Water Soluble Fertilizer Industry Revenue Share (%), by Country 2024 & 2032
- Figure 36: Europe Water Soluble Fertilizer Industry Revenue (Million), by Production Analysis 2024 & 2032
- Figure 37: Europe Water Soluble Fertilizer Industry Revenue Share (%), by Production Analysis 2024 & 2032
- Figure 38: Europe Water Soluble Fertilizer Industry Revenue (Million), by Consumption Analysis 2024 & 2032
- Figure 39: Europe Water Soluble Fertilizer Industry Revenue Share (%), by Consumption Analysis 2024 & 2032
- Figure 40: Europe Water Soluble Fertilizer Industry Revenue (Million), by Import Market Analysis (Value & Volume) 2024 & 2032
- Figure 41: Europe Water Soluble Fertilizer Industry Revenue Share (%), by Import Market Analysis (Value & Volume) 2024 & 2032
- Figure 42: Europe Water Soluble Fertilizer Industry Revenue (Million), by Export Market Analysis (Value & Volume) 2024 & 2032
- Figure 43: Europe Water Soluble Fertilizer Industry Revenue Share (%), by Export Market Analysis (Value & Volume) 2024 & 2032
- Figure 44: Europe Water Soluble Fertilizer Industry Revenue (Million), by Price Trend Analysis 2024 & 2032
- Figure 45: Europe Water Soluble Fertilizer Industry Revenue Share (%), by Price Trend Analysis 2024 & 2032
- Figure 46: Europe Water Soluble Fertilizer Industry Revenue (Million), by Country 2024 & 2032
- Figure 47: Europe Water Soluble Fertilizer Industry Revenue Share (%), by Country 2024 & 2032
- Figure 48: Middle East & Africa Water Soluble Fertilizer Industry Revenue (Million), by Production Analysis 2024 & 2032
- Figure 49: Middle East & Africa Water Soluble Fertilizer Industry Revenue Share (%), by Production Analysis 2024 & 2032
- Figure 50: Middle East & Africa Water Soluble Fertilizer Industry Revenue (Million), by Consumption Analysis 2024 & 2032
- Figure 51: Middle East & Africa Water Soluble Fertilizer Industry Revenue Share (%), by Consumption Analysis 2024 & 2032
- Figure 52: Middle East & Africa Water Soluble Fertilizer Industry Revenue (Million), by Import Market Analysis (Value & Volume) 2024 & 2032
- Figure 53: Middle East & Africa Water Soluble Fertilizer Industry Revenue Share (%), by Import Market Analysis (Value & Volume) 2024 & 2032
- Figure 54: Middle East & Africa Water Soluble Fertilizer Industry Revenue (Million), by Export Market Analysis (Value & Volume) 2024 & 2032
- Figure 55: Middle East & Africa Water Soluble Fertilizer Industry Revenue Share (%), by Export Market Analysis (Value & Volume) 2024 & 2032
- Figure 56: Middle East & Africa Water Soluble Fertilizer Industry Revenue (Million), by Price Trend Analysis 2024 & 2032
- Figure 57: Middle East & Africa Water Soluble Fertilizer Industry Revenue Share (%), by Price Trend Analysis 2024 & 2032
- Figure 58: Middle East & Africa Water Soluble Fertilizer Industry Revenue (Million), by Country 2024 & 2032
- Figure 59: Middle East & Africa Water Soluble Fertilizer Industry Revenue Share (%), by Country 2024 & 2032
- Figure 60: Asia Pacific Water Soluble Fertilizer Industry Revenue (Million), by Production Analysis 2024 & 2032
- Figure 61: Asia Pacific Water Soluble Fertilizer Industry Revenue Share (%), by Production Analysis 2024 & 2032
- Figure 62: Asia Pacific Water Soluble Fertilizer Industry Revenue (Million), by Consumption Analysis 2024 & 2032
- Figure 63: Asia Pacific Water Soluble Fertilizer Industry Revenue Share (%), by Consumption Analysis 2024 & 2032
- Figure 64: Asia Pacific Water Soluble Fertilizer Industry Revenue (Million), by Import Market Analysis (Value & Volume) 2024 & 2032
- Figure 65: Asia Pacific Water Soluble Fertilizer Industry Revenue Share (%), by Import Market Analysis (Value & Volume) 2024 & 2032
- Figure 66: Asia Pacific Water Soluble Fertilizer Industry Revenue (Million), by Export Market Analysis (Value & Volume) 2024 & 2032
- Figure 67: Asia Pacific Water Soluble Fertilizer Industry Revenue Share (%), by Export Market Analysis (Value & Volume) 2024 & 2032
- Figure 68: Asia Pacific Water Soluble Fertilizer Industry Revenue (Million), by Price Trend Analysis 2024 & 2032
- Figure 69: Asia Pacific Water Soluble Fertilizer Industry Revenue Share (%), by Price Trend Analysis 2024 & 2032
- Figure 70: Asia Pacific Water Soluble Fertilizer Industry Revenue (Million), by Country 2024 & 2032
- Figure 71: Asia Pacific Water Soluble Fertilizer Industry Revenue Share (%), by Country 2024 & 2032
List of Tables
- Table 1: Global Water Soluble Fertilizer Industry Revenue Million Forecast, by Region 2019 & 2032
- Table 2: Global Water Soluble Fertilizer Industry Revenue Million Forecast, by Production Analysis 2019 & 2032
- Table 3: Global Water Soluble Fertilizer Industry Revenue Million Forecast, by Consumption Analysis 2019 & 2032
- Table 4: Global Water Soluble Fertilizer Industry Revenue Million Forecast, by Import Market Analysis (Value & Volume) 2019 & 2032
- Table 5: Global Water Soluble Fertilizer Industry Revenue Million Forecast, by Export Market Analysis (Value & Volume) 2019 & 2032
- Table 6: Global Water Soluble Fertilizer Industry Revenue Million Forecast, by Price Trend Analysis 2019 & 2032
- Table 7: Global Water Soluble Fertilizer Industry Revenue Million Forecast, by Region 2019 & 2032
- Table 8: Global Water Soluble Fertilizer Industry Revenue Million Forecast, by Country 2019 & 2032
- Table 9: United States Water Soluble Fertilizer Industry Revenue (Million) Forecast, by Application 2019 & 2032
- Table 10: Canada Water Soluble Fertilizer Industry Revenue (Million) Forecast, by Application 2019 & 2032
- Table 11: Mexico Water Soluble Fertilizer Industry Revenue (Million) Forecast, by Application 2019 & 2032
- Table 12: Global Water Soluble Fertilizer Industry Revenue Million Forecast, by Country 2019 & 2032
- Table 13: Brazil Water Soluble Fertilizer Industry Revenue (Million) Forecast, by Application 2019 & 2032
- Table 14: Argentina Water Soluble Fertilizer Industry Revenue (Million) Forecast, by Application 2019 & 2032
- Table 15: Rest of South America Water Soluble Fertilizer Industry Revenue (Million) Forecast, by Application 2019 & 2032
- Table 16: Global Water Soluble Fertilizer Industry Revenue Million Forecast, by Country 2019 & 2032
- Table 17: China Water Soluble Fertilizer Industry Revenue (Million) Forecast, by Application 2019 & 2032
- Table 18: Japan Water Soluble Fertilizer Industry Revenue (Million) Forecast, by Application 2019 & 2032
- Table 19: India Water Soluble Fertilizer Industry Revenue (Million) Forecast, by Application 2019 & 2032
- Table 20: South Korea Water Soluble Fertilizer Industry Revenue (Million) Forecast, by Application 2019 & 2032
- Table 21: Taiwan Water Soluble Fertilizer Industry Revenue (Million) Forecast, by Application 2019 & 2032
- Table 22: Australia Water Soluble Fertilizer Industry Revenue (Million) Forecast, by Application 2019 & 2032
- Table 23: Rest of Asia-Pacific Water Soluble Fertilizer Industry Revenue (Million) Forecast, by Application 2019 & 2032
- Table 24: Global Water Soluble Fertilizer Industry Revenue Million Forecast, by Country 2019 & 2032
- Table 25: Germany Water Soluble Fertilizer Industry Revenue (Million) Forecast, by Application 2019 & 2032
- Table 26: France Water Soluble Fertilizer Industry Revenue (Million) Forecast, by Application 2019 & 2032
- Table 27: Italy Water Soluble Fertilizer Industry Revenue (Million) Forecast, by Application 2019 & 2032
- Table 28: United Kingdom Water Soluble Fertilizer Industry Revenue (Million) Forecast, by Application 2019 & 2032
- Table 29: Netherlands Water Soluble Fertilizer Industry Revenue (Million) Forecast, by Application 2019 & 2032
- Table 30: Rest of Europe Water Soluble Fertilizer Industry Revenue (Million) Forecast, by Application 2019 & 2032
- Table 31: Global Water Soluble Fertilizer Industry Revenue Million Forecast, by Country 2019 & 2032
- Table 32: Middle East Water Soluble Fertilizer Industry Revenue (Million) Forecast, by Application 2019 & 2032
- Table 33: Africa Water Soluble Fertilizer Industry Revenue (Million) Forecast, by Application 2019 & 2032
- Table 34: Global Water Soluble Fertilizer Industry Revenue Million Forecast, by Production Analysis 2019 & 2032
- Table 35: Global Water Soluble Fertilizer Industry Revenue Million Forecast, by Consumption Analysis 2019 & 2032
- Table 36: Global Water Soluble Fertilizer Industry Revenue Million Forecast, by Import Market Analysis (Value & Volume) 2019 & 2032
- Table 37: Global Water Soluble Fertilizer Industry Revenue Million Forecast, by Export Market Analysis (Value & Volume) 2019 & 2032
- Table 38: Global Water Soluble Fertilizer Industry Revenue Million Forecast, by Price Trend Analysis 2019 & 2032
- Table 39: Global Water Soluble Fertilizer Industry Revenue Million Forecast, by Country 2019 & 2032
- Table 40: United States Water Soluble Fertilizer Industry Revenue (Million) Forecast, by Application 2019 & 2032
- Table 41: Canada Water Soluble Fertilizer Industry Revenue (Million) Forecast, by Application 2019 & 2032
- Table 42: Mexico Water Soluble Fertilizer Industry Revenue (Million) Forecast, by Application 2019 & 2032
- Table 43: Global Water Soluble Fertilizer Industry Revenue Million Forecast, by Production Analysis 2019 & 2032
- Table 44: Global Water Soluble Fertilizer Industry Revenue Million Forecast, by Consumption Analysis 2019 & 2032
- Table 45: Global Water Soluble Fertilizer Industry Revenue Million Forecast, by Import Market Analysis (Value & Volume) 2019 & 2032
- Table 46: Global Water Soluble Fertilizer Industry Revenue Million Forecast, by Export Market Analysis (Value & Volume) 2019 & 2032
- Table 47: Global Water Soluble Fertilizer Industry Revenue Million Forecast, by Price Trend Analysis 2019 & 2032
- Table 48: Global Water Soluble Fertilizer Industry Revenue Million Forecast, by Country 2019 & 2032
- Table 49: Brazil Water Soluble Fertilizer Industry Revenue (Million) Forecast, by Application 2019 & 2032
- Table 50: Argentina Water Soluble Fertilizer Industry Revenue (Million) Forecast, by Application 2019 & 2032
- Table 51: Rest of South America Water Soluble Fertilizer Industry Revenue (Million) Forecast, by Application 2019 & 2032
- Table 52: Global Water Soluble Fertilizer Industry Revenue Million Forecast, by Production Analysis 2019 & 2032
- Table 53: Global Water Soluble Fertilizer Industry Revenue Million Forecast, by Consumption Analysis 2019 & 2032
- Table 54: Global Water Soluble Fertilizer Industry Revenue Million Forecast, by Import Market Analysis (Value & Volume) 2019 & 2032
- Table 55: Global Water Soluble Fertilizer Industry Revenue Million Forecast, by Export Market Analysis (Value & Volume) 2019 & 2032
- Table 56: Global Water Soluble Fertilizer Industry Revenue Million Forecast, by Price Trend Analysis 2019 & 2032
- Table 57: Global Water Soluble Fertilizer Industry Revenue Million Forecast, by Country 2019 & 2032
- Table 58: United Kingdom Water Soluble Fertilizer Industry Revenue (Million) Forecast, by Application 2019 & 2032
- Table 59: Germany Water Soluble Fertilizer Industry Revenue (Million) Forecast, by Application 2019 & 2032
- Table 60: France Water Soluble Fertilizer Industry Revenue (Million) Forecast, by Application 2019 & 2032
- Table 61: Italy Water Soluble Fertilizer Industry Revenue (Million) Forecast, by Application 2019 & 2032
- Table 62: Spain Water Soluble Fertilizer Industry Revenue (Million) Forecast, by Application 2019 & 2032
- Table 63: Russia Water Soluble Fertilizer Industry Revenue (Million) Forecast, by Application 2019 & 2032
- Table 64: Benelux Water Soluble Fertilizer Industry Revenue (Million) Forecast, by Application 2019 & 2032
- Table 65: Nordics Water Soluble Fertilizer Industry Revenue (Million) Forecast, by Application 2019 & 2032
- Table 66: Rest of Europe Water Soluble Fertilizer Industry Revenue (Million) Forecast, by Application 2019 & 2032
- Table 67: Global Water Soluble Fertilizer Industry Revenue Million Forecast, by Production Analysis 2019 & 2032
- Table 68: Global Water Soluble Fertilizer Industry Revenue Million Forecast, by Consumption Analysis 2019 & 2032
- Table 69: Global Water Soluble Fertilizer Industry Revenue Million Forecast, by Import Market Analysis (Value & Volume) 2019 & 2032
- Table 70: Global Water Soluble Fertilizer Industry Revenue Million Forecast, by Export Market Analysis (Value & Volume) 2019 & 2032
- Table 71: Global Water Soluble Fertilizer Industry Revenue Million Forecast, by Price Trend Analysis 2019 & 2032
- Table 72: Global Water Soluble Fertilizer Industry Revenue Million Forecast, by Country 2019 & 2032
- Table 73: Turkey Water Soluble Fertilizer Industry Revenue (Million) Forecast, by Application 2019 & 2032
- Table 74: Israel Water Soluble Fertilizer Industry Revenue (Million) Forecast, by Application 2019 & 2032
- Table 75: GCC Water Soluble Fertilizer Industry Revenue (Million) Forecast, by Application 2019 & 2032
- Table 76: North Africa Water Soluble Fertilizer Industry Revenue (Million) Forecast, by Application 2019 & 2032
- Table 77: South Africa Water Soluble Fertilizer Industry Revenue (Million) Forecast, by Application 2019 & 2032
- Table 78: Rest of Middle East & Africa Water Soluble Fertilizer Industry Revenue (Million) Forecast, by Application 2019 & 2032
- Table 79: Global Water Soluble Fertilizer Industry Revenue Million Forecast, by Production Analysis 2019 & 2032
- Table 80: Global Water Soluble Fertilizer Industry Revenue Million Forecast, by Consumption Analysis 2019 & 2032
- Table 81: Global Water Soluble Fertilizer Industry Revenue Million Forecast, by Import Market Analysis (Value & Volume) 2019 & 2032
- Table 82: Global Water Soluble Fertilizer Industry Revenue Million Forecast, by Export Market Analysis (Value & Volume) 2019 & 2032
- Table 83: Global Water Soluble Fertilizer Industry Revenue Million Forecast, by Price Trend Analysis 2019 & 2032
- Table 84: Global Water Soluble Fertilizer Industry Revenue Million Forecast, by Country 2019 & 2032
- Table 85: China Water Soluble Fertilizer Industry Revenue (Million) Forecast, by Application 2019 & 2032
- Table 86: India Water Soluble Fertilizer Industry Revenue (Million) Forecast, by Application 2019 & 2032
- Table 87: Japan Water Soluble Fertilizer Industry Revenue (Million) Forecast, by Application 2019 & 2032
- Table 88: South Korea Water Soluble Fertilizer Industry Revenue (Million) Forecast, by Application 2019 & 2032
- Table 89: ASEAN Water Soluble Fertilizer Industry Revenue (Million) Forecast, by Application 2019 & 2032
- Table 90: Oceania Water Soluble Fertilizer Industry Revenue (Million) Forecast, by Application 2019 & 2032
- Table 91: Rest of Asia Pacific Water Soluble Fertilizer Industry Revenue (Million) Forecast, by Application 2019 & 2032
Frequently Asked Questions
1. What is the projected Compound Annual Growth Rate (CAGR) of the Water Soluble Fertilizer Industry?
The projected CAGR is approximately 3.80%.
2. Which companies are prominent players in the Water Soluble Fertilizer Industry?
Key companies in the market include Coromandel International Ltd, Haifa Group, Indian Farmers Fertiliser Cooperative Limited, Grupa Azoty S A (Compo Expert), K+S Aktiengesellschaft, Yara International AS, ICL Group Ltd, BMS Micro-Nutrients NV, Sociedad Quimica y Minera de Chile SA.
3. What are the main segments of the Water Soluble Fertilizer Industry?
The market segments include Production Analysis, Consumption Analysis, Import Market Analysis (Value & Volume), Export Market Analysis (Value & Volume), Price Trend Analysis.
4. Can you provide details about the market size?
The market size is estimated to be USD XX Million as of 2022.
5. What are some drivers contributing to market growth?
Adoption of Organic and Eco-friendly Farming Practices; Declining Area of Arable Land and Rising Food Security Concerns.
6. What are the notable trends driving market growth?
OTHER KEY INDUSTRY TRENDS COVERED IN THE REPORT.
7. Are there any restraints impacting market growth?
High Demand for Conventional and Synthetic Products; Lack of Awareness and Other Factors Limiting the Adoption of Agricultural Inoculants.
8. Can you provide examples of recent developments in the market?
April 2023: K+S acquired a 75% share of the fertilizer business of South African trading company Industrial Commodities Holdings (Pty) Ltd (ICH). In addition to expanding the core business, K+S is strengthening its operations in southern and eastern Africa as a result of this acquisition. The newly acquired fertilizer business in the future to be operated in a joint venture, under the name of FertivPty Ltd.May 2022: ICL launched three new NPK formulations of Solinure, a product with increased trace elements to optimize yields.May 2022: ICL signed an agreement with customers in India and China to supply 600,000 and 700,000 metric tons of potash, respectively, in 2022 at USD 590 per ton.
9. What pricing options are available for accessing the report?
Pricing options include single-user, multi-user, and enterprise licenses priced at USD 3800, USD 4500, and USD 5800 respectively.
10. Is the market size provided in terms of value or volume?
The market size is provided in terms of value, measured in Million.
11. Are there any specific market keywords associated with the report?
Yes, the market keyword associated with the report is "Water Soluble Fertilizer Industry," which aids in identifying and referencing the specific market segment covered.
12. How do I determine which pricing option suits my needs best?
The pricing options vary based on user requirements and access needs. Individual users may opt for single-user licenses, while businesses requiring broader access may choose multi-user or enterprise licenses for cost-effective access to the report.
13. Are there any additional resources or data provided in the Water Soluble Fertilizer Industry report?
While the report offers comprehensive insights, it's advisable to review the specific contents or supplementary materials provided to ascertain if additional resources or data are available.
14. How can I stay updated on further developments or reports in the Water Soluble Fertilizer Industry?
To stay informed about further developments, trends, and reports in the Water Soluble Fertilizer Industry, consider subscribing to industry newsletters, following relevant companies and organizations, or regularly checking reputable industry news sources and publications.
Methodology
Step 1 - Identification of Relevant Samples Size from Population Database


Step 2 - Approaches for Defining Global Market Size (Value, Volume* & Price*)

Note*: In applicable scenarios
Step 3 - Data Sources
Primary Research
- Web Analytics
- Survey Reports
- Research Institute
- Latest Research Reports
- Opinion Leaders
Secondary Research
- Annual Reports
- White Paper
- Latest Press Release
- Industry Association
- Paid Database
- Investor Presentations

Step 4 - Data Triangulation
Involves using different sources of information in order to increase the validity of a study
These sources are likely to be stakeholders in a program - participants, other researchers, program staff, other community members, and so on.
Then we put all data in single framework & apply various statistical tools to find out the dynamic on the market.
During the analysis stage, feedback from the stakeholder groups would be compared to determine areas of agreement as well as areas of divergence
