

Key Insights
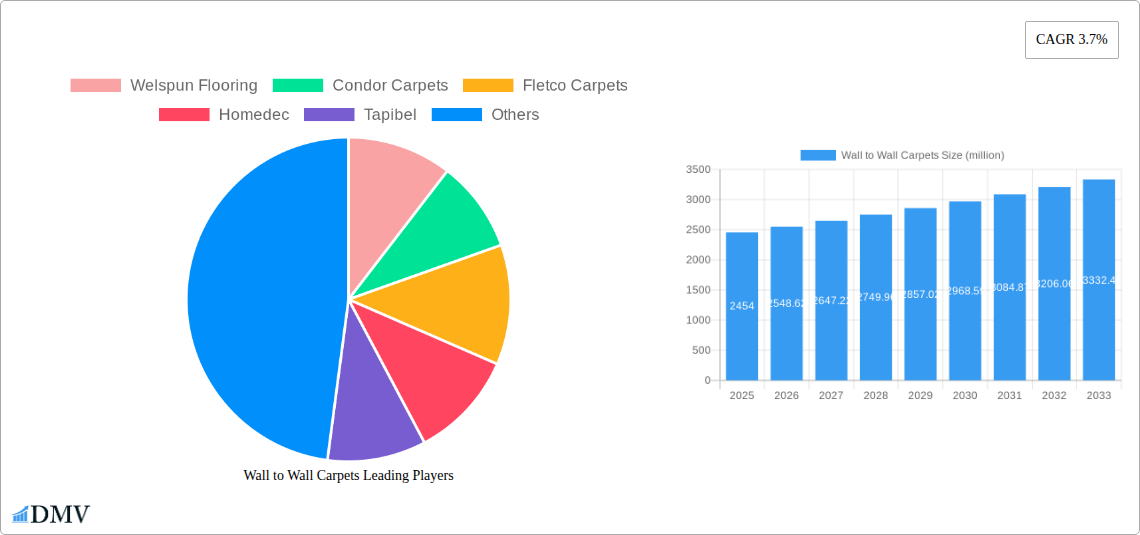
The wall-to-wall carpet market, currently valued at $2454 million (2025), is projected to experience steady growth with a Compound Annual Growth Rate (CAGR) of 3.7% from 2025 to 2033. This growth is fueled by several key drivers. Increasing disposable incomes in developing economies are driving demand for home improvement projects, including carpet installations. Furthermore, advancements in carpet manufacturing technologies have led to the development of more durable, stain-resistant, and aesthetically pleasing carpets, boosting consumer preference. The rising popularity of eco-friendly and sustainable carpet options, made from recycled materials or featuring low-VOC emissions, also contributes significantly to market expansion. However, the market faces challenges, primarily the competition from alternative flooring materials like hardwood, laminate, and vinyl, which are often perceived as easier to maintain. Fluctuations in raw material prices, particularly synthetic fibers, also pose a risk to manufacturers’ profitability. Segmentation within the market is driven by carpet fiber type (nylon, wool, polyester), style (plush, Berber, frieze), and price point (luxury, mid-range, budget). Key players like Welspun Flooring, Condor Carpets, and others are focusing on innovation and product diversification to maintain their market share and tap into emerging trends.
The market's geographical distribution is likely diverse, with North America and Europe holding substantial shares due to established homeownership rates and higher disposable incomes. However, rapid urbanization and economic growth in Asia-Pacific regions are anticipated to drive significant future growth in these markets. The forecast period (2025-2033) promises continued expansion, although the rate might fluctuate slightly based on macroeconomic conditions and consumer spending patterns. Strategic partnerships, mergers, and acquisitions amongst key players will shape the competitive landscape, leading to increased market consolidation. Manufacturers are investing heavily in marketing and branding to enhance their market visibility and appeal to a broader consumer base. Understanding specific regional trends and consumer preferences will be crucial for companies to successfully navigate this dynamic market and capture a larger slice of the expanding pie.
Wall to Wall Carpets Market Report: A Comprehensive Analysis (2019-2033)
This in-depth report provides a comprehensive analysis of the global wall-to-wall carpets market, projecting a market value exceeding $XX million by 2033. The study covers the historical period (2019-2024), base year (2025), and forecast period (2025-2033), offering valuable insights for stakeholders across the industry. Key players like Welspun Flooring, Condor Carpets, and Nourison Home are analyzed, along with emerging trends and future opportunities. This report is essential for strategic decision-making, investment planning, and understanding the competitive landscape of this multi-million dollar industry.
Wall to Wall Carpets Market Composition & Trends
This section evaluates the market concentration, highlighting the market share distribution amongst key players such as Welspun Flooring, Condor Carpets, and Fletco Carpets. We analyze innovation catalysts driving market growth, including advancements in materials and manufacturing processes. The regulatory landscape impacting the industry, including environmental regulations and safety standards, is also examined. Substitute product analysis, encompassing alternatives like hardwood flooring and vinyl, is included, along with an in-depth examination of end-user profiles and their preferences. Finally, we detail M&A activities within the sector, providing insights into deal values and their strategic implications. The total value of M&A deals during the study period is estimated at $XX million.
- Market Share Distribution: Welspun Flooring holds an estimated XX% market share in 2025, followed by Condor Carpets with XX% and Fletco Carpets with XX%.
- Innovation Catalysts: Focus on sustainable materials, technological advancements in manufacturing (e.g., 3D printing), and design innovation.
- Regulatory Landscape: Analysis of regional regulations concerning carpet emissions, fire safety, and disposal.
- Substitute Products: Comparative analysis of wall-to-wall carpets against hardwood flooring and vinyl, highlighting their respective strengths and weaknesses.
- End-User Profiles: Segmentation of end-users based on demographics, geographic location, and preferences.
- M&A Activities: Detailed overview of significant mergers and acquisitions, including deal values and strategic rationale.
Wall to Wall Carpets Industry Evolution
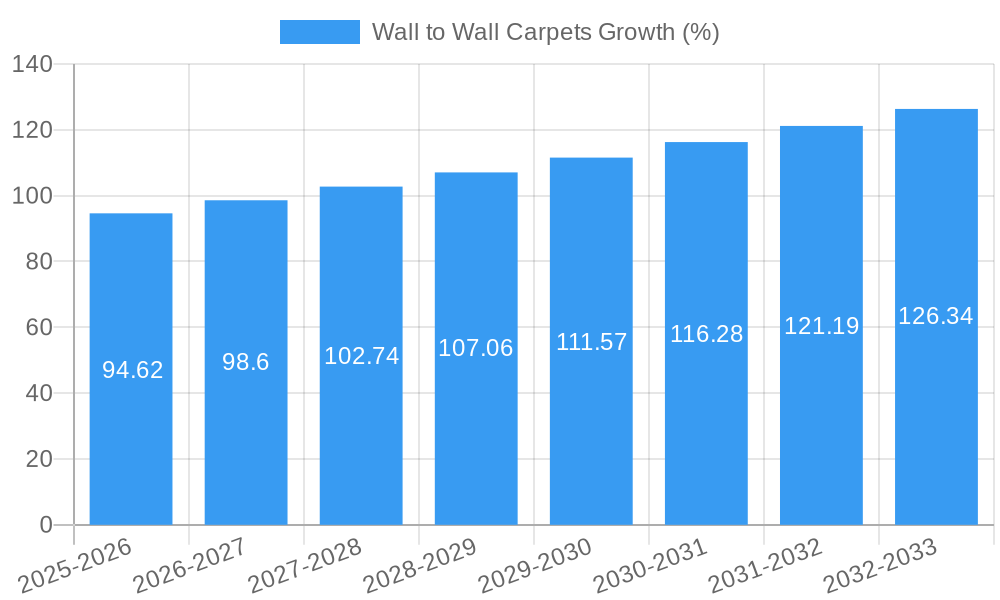
This section delves into the evolutionary trajectory of the wall-to-wall carpets market, focusing on market growth trajectories from 2019 to 2033. We analyze technological advancements, including the introduction of innovative materials, manufacturing techniques, and design aesthetics. The report examines shifting consumer demands, exploring evolving preferences towards sustainability, durability, and aesthetics. The global wall-to-wall carpets market exhibited a CAGR of XX% during the historical period (2019-2024) and is projected to grow at a CAGR of XX% during the forecast period (2025-2033). The adoption rate of eco-friendly carpets is expected to increase by XX% by 2033. Detailed analysis of specific data points and contributing factors are included.
Leading Regions, Countries, or Segments in Wall to Wall Carpets
This section identifies the dominant region, country, or segment within the global wall-to-wall carpets market. A detailed analysis of dominance factors will be explored, offering insights into the underlying drivers of growth.
Key Drivers (Bullet Points):
- High disposable incomes in specific regions.
- Favorable government policies promoting construction and infrastructure development.
- Strong preference for wall-to-wall carpets in certain architectural styles.
- Increased investment in commercial real estate projects.
- Government initiatives supporting sustainable manufacturing practices.
Dominance Factors (Paragraphs): In-depth analysis will explore factors such as consumer preferences, economic conditions, and government regulations that have shaped the market landscape and contributed to the dominance of the leading region/country/segment. For example, the high demand for wall-to-wall carpets in the hospitality sector in [Leading Region] contributed significantly to the segment’s market share.
Wall to Wall Carpets Product Innovations
This section details recent product innovations, focusing on the unique selling propositions and technological advancements driving market growth. New materials, improved durability, and enhanced design features are examined, along with the performance metrics of these new products. The introduction of recycled materials and advanced manufacturing processes has significantly impacted the market.
Propelling Factors for Wall to Wall Carpets Growth
This section identifies and analyzes the key factors contributing to the growth of the wall-to-wall carpets market. These factors include technological advancements in manufacturing and design, favorable economic conditions driving construction and renovation activity, and supportive government regulations. The increasing preference for eco-friendly carpets is also a significant driver.
Obstacles in the Wall to Wall Carpets Market
This section discusses the barriers and restraints impacting the market, including regulatory challenges related to environmental regulations and material sourcing. Supply chain disruptions, particularly those linked to raw material availability and global trade, are analyzed alongside the competitive pressures from substitute products.
Future Opportunities in Wall to Wall Carpets
This section highlights emerging opportunities in the market, focusing on new markets, technological advancements, and evolving consumer trends. The potential for growth in emerging economies and the development of innovative, sustainable products are highlighted as key opportunities.
Major Players in the Wall to Wall Carpets Ecosystem
- Welspun Flooring
- Condor Carpets
- Fletco Carpets
- Homedec
- Tapibel
- Stanton
- Georgia Carpet
- Carpet Manufacturers India
- Object Carpet
- Zarif Carpets
- Ruckstuhl
- Wuxi Diamond Carpet
- Genie Carpets Manufacturers
- Melikhan Carpets
- Sigma Carpet
- Kasthall
- Nourison Home
Key Developments in Wall to Wall Carpets Industry
- 2022-Q3: Launch of a new sustainable carpet collection by Welspun Flooring.
- 2023-Q1: Condor Carpets announces a strategic partnership with a major raw material supplier.
- 2024-Q4: Acquisition of a smaller carpet manufacturer by Nourison Home. (Further specific developments will be detailed within the full report)
Strategic Wall to Wall Carpets Market Forecast
The wall-to-wall carpets market is poised for significant growth, driven by technological advancements, changing consumer preferences, and expanding applications across various sectors. The market is expected to experience strong growth in the coming years, fueled by increasing construction activity and demand for sustainable and high-performance carpets. The focus on eco-friendly materials and innovative designs presents substantial opportunities for market expansion and significant revenue growth in the forecast period.
Wall to Wall Carpets Segmentation
-
1. Application
- 1.1. Household
- 1.2. Commercial
-
2. Types
- 2.1. Nylon
- 2.2. Polyester
- 2.3. Wool
- 2.4. Others
Wall to Wall Carpets Segmentation By Geography
-
1. North America
- 1.1. United States
- 1.2. Canada
- 1.3. Mexico
-
2. South America
- 2.1. Brazil
- 2.2. Argentina
- 2.3. Rest of South America
-
3. Europe
- 3.1. United Kingdom
- 3.2. Germany
- 3.3. France
- 3.4. Italy
- 3.5. Spain
- 3.6. Russia
- 3.7. Benelux
- 3.8. Nordics
- 3.9. Rest of Europe
-
4. Middle East & Africa
- 4.1. Turkey
- 4.2. Israel
- 4.3. GCC
- 4.4. North Africa
- 4.5. South Africa
- 4.6. Rest of Middle East & Africa
-
5. Asia Pacific
- 5.1. China
- 5.2. India
- 5.3. Japan
- 5.4. South Korea
- 5.5. ASEAN
- 5.6. Oceania
- 5.7. Rest of Asia Pacific

Wall to Wall Carpets REPORT HIGHLIGHTS
| Aspects | Details |
|---|---|
| Study Period | 2019-2033 |
| Base Year | 2024 |
| Estimated Year | 2025 |
| Forecast Period | 2025-2033 |
| Historical Period | 2019-2024 |
| Growth Rate | CAGR of 3.7% from 2019-2033 |
| Segmentation |
|
Table of Contents
- 1. Introduction
- 1.1. Research Scope
- 1.2. Market Segmentation
- 1.3. Research Methodology
- 1.4. Definitions and Assumptions
- 2. Executive Summary
- 2.1. Introduction
- 3. Market Dynamics
- 3.1. Introduction
- 3.2. Market Drivers
- 3.3. Market Restrains
- 3.4. Market Trends
- 4. Market Factor Analysis
- 4.1. Porters Five Forces
- 4.2. Supply/Value Chain
- 4.3. PESTEL analysis
- 4.4. Market Entropy
- 4.5. Patent/Trademark Analysis
- 5. Global Wall to Wall Carpets Analysis, Insights and Forecast, 2019-2031
- 5.1. Market Analysis, Insights and Forecast - by Application
- 5.1.1. Household
- 5.1.2. Commercial
- 5.2. Market Analysis, Insights and Forecast - by Types
- 5.2.1. Nylon
- 5.2.2. Polyester
- 5.2.3. Wool
- 5.2.4. Others
- 5.3. Market Analysis, Insights and Forecast - by Region
- 5.3.1. North America
- 5.3.2. South America
- 5.3.3. Europe
- 5.3.4. Middle East & Africa
- 5.3.5. Asia Pacific
- 5.1. Market Analysis, Insights and Forecast - by Application
- 6. North America Wall to Wall Carpets Analysis, Insights and Forecast, 2019-2031
- 6.1. Market Analysis, Insights and Forecast - by Application
- 6.1.1. Household
- 6.1.2. Commercial
- 6.2. Market Analysis, Insights and Forecast - by Types
- 6.2.1. Nylon
- 6.2.2. Polyester
- 6.2.3. Wool
- 6.2.4. Others
- 6.1. Market Analysis, Insights and Forecast - by Application
- 7. South America Wall to Wall Carpets Analysis, Insights and Forecast, 2019-2031
- 7.1. Market Analysis, Insights and Forecast - by Application
- 7.1.1. Household
- 7.1.2. Commercial
- 7.2. Market Analysis, Insights and Forecast - by Types
- 7.2.1. Nylon
- 7.2.2. Polyester
- 7.2.3. Wool
- 7.2.4. Others
- 7.1. Market Analysis, Insights and Forecast - by Application
- 8. Europe Wall to Wall Carpets Analysis, Insights and Forecast, 2019-2031
- 8.1. Market Analysis, Insights and Forecast - by Application
- 8.1.1. Household
- 8.1.2. Commercial
- 8.2. Market Analysis, Insights and Forecast - by Types
- 8.2.1. Nylon
- 8.2.2. Polyester
- 8.2.3. Wool
- 8.2.4. Others
- 8.1. Market Analysis, Insights and Forecast - by Application
- 9. Middle East & Africa Wall to Wall Carpets Analysis, Insights and Forecast, 2019-2031
- 9.1. Market Analysis, Insights and Forecast - by Application
- 9.1.1. Household
- 9.1.2. Commercial
- 9.2. Market Analysis, Insights and Forecast - by Types
- 9.2.1. Nylon
- 9.2.2. Polyester
- 9.2.3. Wool
- 9.2.4. Others
- 9.1. Market Analysis, Insights and Forecast - by Application
- 10. Asia Pacific Wall to Wall Carpets Analysis, Insights and Forecast, 2019-2031
- 10.1. Market Analysis, Insights and Forecast - by Application
- 10.1.1. Household
- 10.1.2. Commercial
- 10.2. Market Analysis, Insights and Forecast - by Types
- 10.2.1. Nylon
- 10.2.2. Polyester
- 10.2.3. Wool
- 10.2.4. Others
- 10.1. Market Analysis, Insights and Forecast - by Application
- 11. Competitive Analysis
- 11.1. Global Market Share Analysis 2024
- 11.2. Company Profiles
- 11.2.1 Welspun Flooring
- 11.2.1.1. Overview
- 11.2.1.2. Products
- 11.2.1.3. SWOT Analysis
- 11.2.1.4. Recent Developments
- 11.2.1.5. Financials (Based on Availability)
- 11.2.2 Condor Carpets
- 11.2.2.1. Overview
- 11.2.2.2. Products
- 11.2.2.3. SWOT Analysis
- 11.2.2.4. Recent Developments
- 11.2.2.5. Financials (Based on Availability)
- 11.2.3 Fletco Carpets
- 11.2.3.1. Overview
- 11.2.3.2. Products
- 11.2.3.3. SWOT Analysis
- 11.2.3.4. Recent Developments
- 11.2.3.5. Financials (Based on Availability)
- 11.2.4 Homedec
- 11.2.4.1. Overview
- 11.2.4.2. Products
- 11.2.4.3. SWOT Analysis
- 11.2.4.4. Recent Developments
- 11.2.4.5. Financials (Based on Availability)
- 11.2.5 Tapibel
- 11.2.5.1. Overview
- 11.2.5.2. Products
- 11.2.5.3. SWOT Analysis
- 11.2.5.4. Recent Developments
- 11.2.5.5. Financials (Based on Availability)
- 11.2.6 Stanton
- 11.2.6.1. Overview
- 11.2.6.2. Products
- 11.2.6.3. SWOT Analysis
- 11.2.6.4. Recent Developments
- 11.2.6.5. Financials (Based on Availability)
- 11.2.7 Georgia Carpet
- 11.2.7.1. Overview
- 11.2.7.2. Products
- 11.2.7.3. SWOT Analysis
- 11.2.7.4. Recent Developments
- 11.2.7.5. Financials (Based on Availability)
- 11.2.8 Carpet Manufacturers India
- 11.2.8.1. Overview
- 11.2.8.2. Products
- 11.2.8.3. SWOT Analysis
- 11.2.8.4. Recent Developments
- 11.2.8.5. Financials (Based on Availability)
- 11.2.9 Object Carpet
- 11.2.9.1. Overview
- 11.2.9.2. Products
- 11.2.9.3. SWOT Analysis
- 11.2.9.4. Recent Developments
- 11.2.9.5. Financials (Based on Availability)
- 11.2.10 Zarif Carpets
- 11.2.10.1. Overview
- 11.2.10.2. Products
- 11.2.10.3. SWOT Analysis
- 11.2.10.4. Recent Developments
- 11.2.10.5. Financials (Based on Availability)
- 11.2.11 Ruckstuhl
- 11.2.11.1. Overview
- 11.2.11.2. Products
- 11.2.11.3. SWOT Analysis
- 11.2.11.4. Recent Developments
- 11.2.11.5. Financials (Based on Availability)
- 11.2.12 Wuxi Diamond Carpet
- 11.2.12.1. Overview
- 11.2.12.2. Products
- 11.2.12.3. SWOT Analysis
- 11.2.12.4. Recent Developments
- 11.2.12.5. Financials (Based on Availability)
- 11.2.13 Genie Carpets Manufacturers
- 11.2.13.1. Overview
- 11.2.13.2. Products
- 11.2.13.3. SWOT Analysis
- 11.2.13.4. Recent Developments
- 11.2.13.5. Financials (Based on Availability)
- 11.2.14 Melikhan Carpets
- 11.2.14.1. Overview
- 11.2.14.2. Products
- 11.2.14.3. SWOT Analysis
- 11.2.14.4. Recent Developments
- 11.2.14.5. Financials (Based on Availability)
- 11.2.15 Sigma Carpet
- 11.2.15.1. Overview
- 11.2.15.2. Products
- 11.2.15.3. SWOT Analysis
- 11.2.15.4. Recent Developments
- 11.2.15.5. Financials (Based on Availability)
- 11.2.16 Kasthall
- 11.2.16.1. Overview
- 11.2.16.2. Products
- 11.2.16.3. SWOT Analysis
- 11.2.16.4. Recent Developments
- 11.2.16.5. Financials (Based on Availability)
- 11.2.17 Nourison Home
- 11.2.17.1. Overview
- 11.2.17.2. Products
- 11.2.17.3. SWOT Analysis
- 11.2.17.4. Recent Developments
- 11.2.17.5. Financials (Based on Availability)
- 11.2.1 Welspun Flooring
List of Figures
- Figure 1: Global Wall to Wall Carpets Revenue Breakdown (million, %) by Region 2024 & 2032
- Figure 2: North America Wall to Wall Carpets Revenue (million), by Application 2024 & 2032
- Figure 3: North America Wall to Wall Carpets Revenue Share (%), by Application 2024 & 2032
- Figure 4: North America Wall to Wall Carpets Revenue (million), by Types 2024 & 2032
- Figure 5: North America Wall to Wall Carpets Revenue Share (%), by Types 2024 & 2032
- Figure 6: North America Wall to Wall Carpets Revenue (million), by Country 2024 & 2032
- Figure 7: North America Wall to Wall Carpets Revenue Share (%), by Country 2024 & 2032
- Figure 8: South America Wall to Wall Carpets Revenue (million), by Application 2024 & 2032
- Figure 9: South America Wall to Wall Carpets Revenue Share (%), by Application 2024 & 2032
- Figure 10: South America Wall to Wall Carpets Revenue (million), by Types 2024 & 2032
- Figure 11: South America Wall to Wall Carpets Revenue Share (%), by Types 2024 & 2032
- Figure 12: South America Wall to Wall Carpets Revenue (million), by Country 2024 & 2032
- Figure 13: South America Wall to Wall Carpets Revenue Share (%), by Country 2024 & 2032
- Figure 14: Europe Wall to Wall Carpets Revenue (million), by Application 2024 & 2032
- Figure 15: Europe Wall to Wall Carpets Revenue Share (%), by Application 2024 & 2032
- Figure 16: Europe Wall to Wall Carpets Revenue (million), by Types 2024 & 2032
- Figure 17: Europe Wall to Wall Carpets Revenue Share (%), by Types 2024 & 2032
- Figure 18: Europe Wall to Wall Carpets Revenue (million), by Country 2024 & 2032
- Figure 19: Europe Wall to Wall Carpets Revenue Share (%), by Country 2024 & 2032
- Figure 20: Middle East & Africa Wall to Wall Carpets Revenue (million), by Application 2024 & 2032
- Figure 21: Middle East & Africa Wall to Wall Carpets Revenue Share (%), by Application 2024 & 2032
- Figure 22: Middle East & Africa Wall to Wall Carpets Revenue (million), by Types 2024 & 2032
- Figure 23: Middle East & Africa Wall to Wall Carpets Revenue Share (%), by Types 2024 & 2032
- Figure 24: Middle East & Africa Wall to Wall Carpets Revenue (million), by Country 2024 & 2032
- Figure 25: Middle East & Africa Wall to Wall Carpets Revenue Share (%), by Country 2024 & 2032
- Figure 26: Asia Pacific Wall to Wall Carpets Revenue (million), by Application 2024 & 2032
- Figure 27: Asia Pacific Wall to Wall Carpets Revenue Share (%), by Application 2024 & 2032
- Figure 28: Asia Pacific Wall to Wall Carpets Revenue (million), by Types 2024 & 2032
- Figure 29: Asia Pacific Wall to Wall Carpets Revenue Share (%), by Types 2024 & 2032
- Figure 30: Asia Pacific Wall to Wall Carpets Revenue (million), by Country 2024 & 2032
- Figure 31: Asia Pacific Wall to Wall Carpets Revenue Share (%), by Country 2024 & 2032
List of Tables
- Table 1: Global Wall to Wall Carpets Revenue million Forecast, by Region 2019 & 2032
- Table 2: Global Wall to Wall Carpets Revenue million Forecast, by Application 2019 & 2032
- Table 3: Global Wall to Wall Carpets Revenue million Forecast, by Types 2019 & 2032
- Table 4: Global Wall to Wall Carpets Revenue million Forecast, by Region 2019 & 2032
- Table 5: Global Wall to Wall Carpets Revenue million Forecast, by Application 2019 & 2032
- Table 6: Global Wall to Wall Carpets Revenue million Forecast, by Types 2019 & 2032
- Table 7: Global Wall to Wall Carpets Revenue million Forecast, by Country 2019 & 2032
- Table 8: United States Wall to Wall Carpets Revenue (million) Forecast, by Application 2019 & 2032
- Table 9: Canada Wall to Wall Carpets Revenue (million) Forecast, by Application 2019 & 2032
- Table 10: Mexico Wall to Wall Carpets Revenue (million) Forecast, by Application 2019 & 2032
- Table 11: Global Wall to Wall Carpets Revenue million Forecast, by Application 2019 & 2032
- Table 12: Global Wall to Wall Carpets Revenue million Forecast, by Types 2019 & 2032
- Table 13: Global Wall to Wall Carpets Revenue million Forecast, by Country 2019 & 2032
- Table 14: Brazil Wall to Wall Carpets Revenue (million) Forecast, by Application 2019 & 2032
- Table 15: Argentina Wall to Wall Carpets Revenue (million) Forecast, by Application 2019 & 2032
- Table 16: Rest of South America Wall to Wall Carpets Revenue (million) Forecast, by Application 2019 & 2032
- Table 17: Global Wall to Wall Carpets Revenue million Forecast, by Application 2019 & 2032
- Table 18: Global Wall to Wall Carpets Revenue million Forecast, by Types 2019 & 2032
- Table 19: Global Wall to Wall Carpets Revenue million Forecast, by Country 2019 & 2032
- Table 20: United Kingdom Wall to Wall Carpets Revenue (million) Forecast, by Application 2019 & 2032
- Table 21: Germany Wall to Wall Carpets Revenue (million) Forecast, by Application 2019 & 2032
- Table 22: France Wall to Wall Carpets Revenue (million) Forecast, by Application 2019 & 2032
- Table 23: Italy Wall to Wall Carpets Revenue (million) Forecast, by Application 2019 & 2032
- Table 24: Spain Wall to Wall Carpets Revenue (million) Forecast, by Application 2019 & 2032
- Table 25: Russia Wall to Wall Carpets Revenue (million) Forecast, by Application 2019 & 2032
- Table 26: Benelux Wall to Wall Carpets Revenue (million) Forecast, by Application 2019 & 2032
- Table 27: Nordics Wall to Wall Carpets Revenue (million) Forecast, by Application 2019 & 2032
- Table 28: Rest of Europe Wall to Wall Carpets Revenue (million) Forecast, by Application 2019 & 2032
- Table 29: Global Wall to Wall Carpets Revenue million Forecast, by Application 2019 & 2032
- Table 30: Global Wall to Wall Carpets Revenue million Forecast, by Types 2019 & 2032
- Table 31: Global Wall to Wall Carpets Revenue million Forecast, by Country 2019 & 2032
- Table 32: Turkey Wall to Wall Carpets Revenue (million) Forecast, by Application 2019 & 2032
- Table 33: Israel Wall to Wall Carpets Revenue (million) Forecast, by Application 2019 & 2032
- Table 34: GCC Wall to Wall Carpets Revenue (million) Forecast, by Application 2019 & 2032
- Table 35: North Africa Wall to Wall Carpets Revenue (million) Forecast, by Application 2019 & 2032
- Table 36: South Africa Wall to Wall Carpets Revenue (million) Forecast, by Application 2019 & 2032
- Table 37: Rest of Middle East & Africa Wall to Wall Carpets Revenue (million) Forecast, by Application 2019 & 2032
- Table 38: Global Wall to Wall Carpets Revenue million Forecast, by Application 2019 & 2032
- Table 39: Global Wall to Wall Carpets Revenue million Forecast, by Types 2019 & 2032
- Table 40: Global Wall to Wall Carpets Revenue million Forecast, by Country 2019 & 2032
- Table 41: China Wall to Wall Carpets Revenue (million) Forecast, by Application 2019 & 2032
- Table 42: India Wall to Wall Carpets Revenue (million) Forecast, by Application 2019 & 2032
- Table 43: Japan Wall to Wall Carpets Revenue (million) Forecast, by Application 2019 & 2032
- Table 44: South Korea Wall to Wall Carpets Revenue (million) Forecast, by Application 2019 & 2032
- Table 45: ASEAN Wall to Wall Carpets Revenue (million) Forecast, by Application 2019 & 2032
- Table 46: Oceania Wall to Wall Carpets Revenue (million) Forecast, by Application 2019 & 2032
- Table 47: Rest of Asia Pacific Wall to Wall Carpets Revenue (million) Forecast, by Application 2019 & 2032
Frequently Asked Questions
1. What is the projected Compound Annual Growth Rate (CAGR) of the Wall to Wall Carpets?
The projected CAGR is approximately 3.7%.
2. Which companies are prominent players in the Wall to Wall Carpets?
Key companies in the market include Welspun Flooring, Condor Carpets, Fletco Carpets, Homedec, Tapibel, Stanton, Georgia Carpet, Carpet Manufacturers India, Object Carpet, Zarif Carpets, Ruckstuhl, Wuxi Diamond Carpet, Genie Carpets Manufacturers, Melikhan Carpets, Sigma Carpet, Kasthall, Nourison Home.
3. What are the main segments of the Wall to Wall Carpets?
The market segments include Application, Types.
4. Can you provide details about the market size?
The market size is estimated to be USD 2454 million as of 2022.
5. What are some drivers contributing to market growth?
N/A
6. What are the notable trends driving market growth?
N/A
7. Are there any restraints impacting market growth?
N/A
8. Can you provide examples of recent developments in the market?
N/A
9. What pricing options are available for accessing the report?
Pricing options include single-user, multi-user, and enterprise licenses priced at USD 4900.00, USD 7350.00, and USD 9800.00 respectively.
10. Is the market size provided in terms of value or volume?
The market size is provided in terms of value, measured in million.
11. Are there any specific market keywords associated with the report?
Yes, the market keyword associated with the report is "Wall to Wall Carpets," which aids in identifying and referencing the specific market segment covered.
12. How do I determine which pricing option suits my needs best?
The pricing options vary based on user requirements and access needs. Individual users may opt for single-user licenses, while businesses requiring broader access may choose multi-user or enterprise licenses for cost-effective access to the report.
13. Are there any additional resources or data provided in the Wall to Wall Carpets report?
While the report offers comprehensive insights, it's advisable to review the specific contents or supplementary materials provided to ascertain if additional resources or data are available.
14. How can I stay updated on further developments or reports in the Wall to Wall Carpets?
To stay informed about further developments, trends, and reports in the Wall to Wall Carpets, consider subscribing to industry newsletters, following relevant companies and organizations, or regularly checking reputable industry news sources and publications.
Methodology
Step 1 - Identification of Relevant Samples Size from Population Database


Step 2 - Approaches for Defining Global Market Size (Value, Volume* & Price*)

Note*: In applicable scenarios
Step 3 - Data Sources
Primary Research
- Web Analytics
- Survey Reports
- Research Institute
- Latest Research Reports
- Opinion Leaders
Secondary Research
- Annual Reports
- White Paper
- Latest Press Release
- Industry Association
- Paid Database
- Investor Presentations

Step 4 - Data Triangulation
Involves using different sources of information in order to increase the validity of a study
These sources are likely to be stakeholders in a program - participants, other researchers, program staff, other community members, and so on.
Then we put all data in single framework & apply various statistical tools to find out the dynamic on the market.
During the analysis stage, feedback from the stakeholder groups would be compared to determine areas of agreement as well as areas of divergence
