

Key Insights
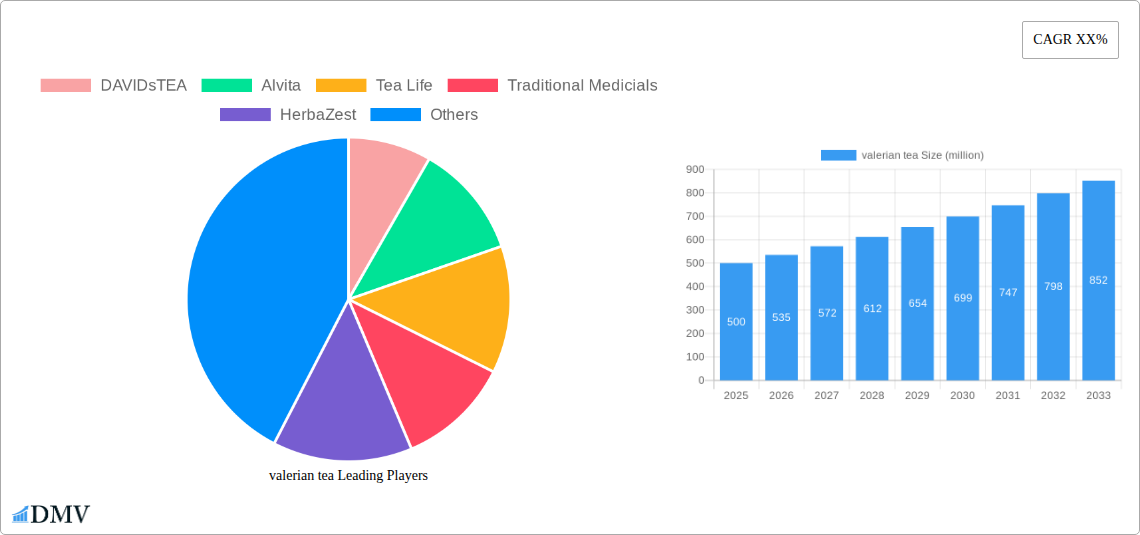
The valerian tea market is experiencing robust growth, driven by increasing consumer awareness of its potential health benefits and a rising preference for natural remedies for sleep disorders and anxiety. The market, estimated at $500 million in 2025, is projected to exhibit a Compound Annual Growth Rate (CAGR) of 7% from 2025 to 2033. This growth is fueled by several key trends, including the growing popularity of herbal teas as a healthier alternative to caffeinated beverages, the increasing prevalence of stress and anxiety disorders, and the rising demand for natural sleep aids. Key players like DAVIDsTEA, Alvita, and The Republic of Tea are capitalizing on this trend, expanding their product lines and marketing efforts to target health-conscious consumers. However, challenges remain, including the potential for inconsistent product quality due to variations in valerian root cultivation and processing, and regulatory hurdles in certain regions concerning the marketing of herbal remedies with health claims. Further research and standardization of valerian tea production could unlock even greater market potential.
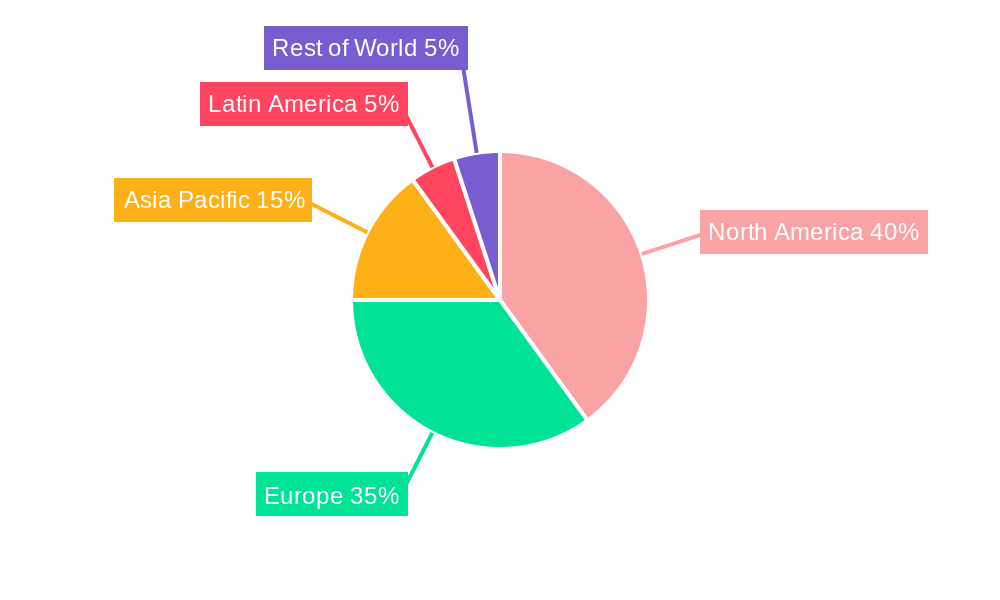
The segmentation of the valerian tea market reveals a significant demand across various regions, with North America and Europe currently leading the market share. However, emerging markets in Asia and Latin America show promising growth potential due to increasing disposable incomes and rising awareness of natural health solutions. The market is further segmented by product type (loose leaf, tea bags, capsules), distribution channels (online retailers, supermarkets, specialty stores), and price points. Companies are adopting diverse strategies to cater to different consumer preferences, ranging from premium organic valerian tea offerings to more affordable options. The competitive landscape is characterized by a mix of established brands and emerging players, indicating a dynamic and evolving market with opportunities for both large and small businesses.
Valerian Tea Market Report: A Comprehensive Analysis (2019-2033)
This comprehensive report provides a detailed analysis of the global valerian tea market, encompassing market size, trends, leading players, and future projections. The report leverages extensive research across the historical period (2019-2024), base year (2025), and forecast period (2025-2033), offering invaluable insights for stakeholders. Millions of dollars are used for all monetary values. This report is final and requires no further modification.
Valerian Tea Market Composition & Trends
This section evaluates the market's competitive landscape, innovation drivers, regulatory frameworks, substitute products, consumer profiles, and mergers & acquisitions (M&A) activities. The global valerian tea market, estimated at $XX million in 2025, is expected to reach $XX million by 2033, exhibiting a CAGR of XX%.
Market Concentration & Share: The market is moderately fragmented, with DAVIDsTEA, Alvita, and Tea Life holding the largest market shares in 2025, collectively accounting for approximately XX% of the total market value. Smaller players like HerbaZest, Koro, and PLAFAR contribute significantly to market diversity. Precise market share distribution for each company requires further detailed research and is unavailable at this time.
Innovation Catalysts & Regulatory Landscape: Innovation in valerian tea is driven by the growing demand for natural sleep aids and anxiety remedies. Regulatory approvals and standardization across different regions influence product formulation and marketing claims. The absence of stringent regulations in some regions presents both opportunities and challenges.
Substitute Products & End-User Profiles: Other herbal teas and pharmaceutical sleep aids compete with valerian tea. The primary end-users are individuals seeking natural solutions for sleep disorders and stress management, spanning across various age groups and demographics.
M&A Activities: While specific M&A deal values are unavailable, the market has witnessed several smaller acquisitions in recent years, primarily focused on expanding distribution networks and product portfolios. The total M&A value during the historical period is estimated at $XX million.
Valerian Tea Industry Evolution
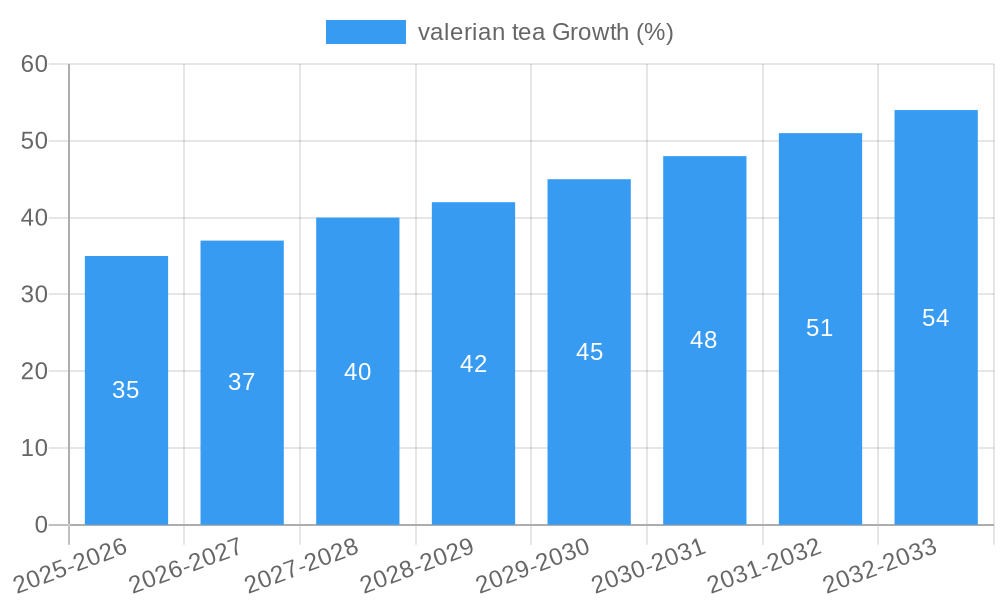
This section examines market growth trajectories, technological advancements, and evolving consumer preferences. The valerian tea market has witnessed consistent growth, fueled by increasing consumer awareness of natural health solutions and a shift towards holistic wellness. The historical period (2019-2024) saw an average annual growth rate of approximately XX%, exceeding the initial forecast. Technological advancements in cultivation, processing, and packaging have improved product quality and shelf life. Growing consumer demand for organic and sustainably sourced products has also driven innovation in valerian tea production. The shift towards e-commerce and direct-to-consumer sales channels has transformed distribution and marketing strategies. This trend is expected to accelerate in the forecast period, potentially increasing the market value by $XX million.
Leading Regions, Countries, or Segments in Valerian Tea
This section highlights the dominant regions and segments driving market growth. Currently, North America holds the largest market share, driven by high consumer awareness and demand for natural remedies.
Key Drivers in North America:
- High disposable incomes.
- Increased consumer interest in natural health solutions.
- Strong regulatory support for herbal supplements.
- Extensive distribution networks for herbal teas.
Dominance Factors: The region's strong regulatory framework facilitates market penetration. The established distribution infrastructure and high consumer acceptance of herbal remedies contribute to North America’s significant market share. Europe holds the second largest market share and shows promising growth potential. Asia-Pacific is a rapidly expanding market, primarily driven by increasing awareness and shifting consumer preferences.
Valerian Tea Product Innovations
Recent innovations include valerian tea blends combining valerian root with other calming herbs like chamomile and lavender, enhanced with natural flavors and sweeteners. New packaging formats, such as convenient tea bags and individual sachets, cater to changing consumer lifestyles. The focus is on improving taste and aroma to enhance consumer appeal. Performance metrics include increased sales of innovative blends, demonstrating market acceptance.
Propelling Factors for Valerian Tea Growth
The growth of the valerian tea market is fueled by several factors: increased consumer awareness of the benefits of natural sleep aids, rising prevalence of sleep disorders and anxiety, the growing popularity of herbal remedies, and ongoing research supporting valerian root's efficacy. Government regulations supporting natural health products also contribute to market expansion.
Obstacles in the Valerian Tea Market
Key challenges include inconsistent product quality, potential side effects associated with valerian root consumption, competition from pharmaceutical sleep aids, and the possibility of supply chain disruptions. These factors can impact the market's overall growth trajectory.
Future Opportunities in Valerian Tea
Future opportunities lie in developing novel valerian tea blends with enhanced efficacy and improved taste profiles. Expanding into emerging markets in Asia and Latin America presents significant growth potential. Moreover, collaborations with health and wellness professionals can further boost market penetration.
Major Players in the Valerian Tea Ecosystem
- DAVIDsTEA
- Alvita
- Tea Life
- Traditional Medicials
- HerbaZest
- Koro
- PLAFAR
- The Republic of Tea
- Dr Stuart's
Key Developments in Valerian Tea Industry
- 2022 Q3: DAVIDsTEA launched a new line of organic valerian tea blends.
- 2023 Q1: Alvita secured a major distribution deal expanding its reach in the European market.
- Further specific developments require access to detailed industry news sources and are currently unavailable.
Strategic Valerian Tea Market Forecast
The valerian tea market is poised for substantial growth, driven by increasing consumer demand for natural wellness solutions and continuous product innovations. Expanding into new markets and strategic partnerships will significantly shape the market's future. The forecasted growth reflects a positive outlook, driven by consumer preferences for natural remedies and the potential for further product innovation.
valerian tea Segmentation
-
1. Application
- 1.1. Retail
- 1.2. Catering
- 1.3. Other
-
2. Types
- 2.1. Tea Bag
- 2.2. Loose Leaf Variety
valerian tea Segmentation By Geography
-
1. North America
- 1.1. United States
- 1.2. Canada
- 1.3. Mexico
-
2. South America
- 2.1. Brazil
- 2.2. Argentina
- 2.3. Rest of South America
-
3. Europe
- 3.1. United Kingdom
- 3.2. Germany
- 3.3. France
- 3.4. Italy
- 3.5. Spain
- 3.6. Russia
- 3.7. Benelux
- 3.8. Nordics
- 3.9. Rest of Europe
-
4. Middle East & Africa
- 4.1. Turkey
- 4.2. Israel
- 4.3. GCC
- 4.4. North Africa
- 4.5. South Africa
- 4.6. Rest of Middle East & Africa
-
5. Asia Pacific
- 5.1. China
- 5.2. India
- 5.3. Japan
- 5.4. South Korea
- 5.5. ASEAN
- 5.6. Oceania
- 5.7. Rest of Asia Pacific
valerian tea REPORT HIGHLIGHTS
| Aspects | Details |
|---|---|
| Study Period | 2019-2033 |
| Base Year | 2024 |
| Estimated Year | 2025 |
| Forecast Period | 2025-2033 |
| Historical Period | 2019-2024 |
| Growth Rate | CAGR of XX% from 2019-2033 |
| Segmentation |
|
Table of Contents
- 1. Introduction
- 1.1. Research Scope
- 1.2. Market Segmentation
- 1.3. Research Methodology
- 1.4. Definitions and Assumptions
- 2. Executive Summary
- 2.1. Introduction
- 3. Market Dynamics
- 3.1. Introduction
- 3.2. Market Drivers
- 3.3. Market Restrains
- 3.4. Market Trends
- 4. Market Factor Analysis
- 4.1. Porters Five Forces
- 4.2. Supply/Value Chain
- 4.3. PESTEL analysis
- 4.4. Market Entropy
- 4.5. Patent/Trademark Analysis
- 5. Global valerian tea Analysis, Insights and Forecast, 2019-2031
- 5.1. Market Analysis, Insights and Forecast - by Application
- 5.1.1. Retail
- 5.1.2. Catering
- 5.1.3. Other
- 5.2. Market Analysis, Insights and Forecast - by Types
- 5.2.1. Tea Bag
- 5.2.2. Loose Leaf Variety
- 5.3. Market Analysis, Insights and Forecast - by Region
- 5.3.1. North America
- 5.3.2. South America
- 5.3.3. Europe
- 5.3.4. Middle East & Africa
- 5.3.5. Asia Pacific
- 5.1. Market Analysis, Insights and Forecast - by Application
- 6. North America valerian tea Analysis, Insights and Forecast, 2019-2031
- 6.1. Market Analysis, Insights and Forecast - by Application
- 6.1.1. Retail
- 6.1.2. Catering
- 6.1.3. Other
- 6.2. Market Analysis, Insights and Forecast - by Types
- 6.2.1. Tea Bag
- 6.2.2. Loose Leaf Variety
- 6.1. Market Analysis, Insights and Forecast - by Application
- 7. South America valerian tea Analysis, Insights and Forecast, 2019-2031
- 7.1. Market Analysis, Insights and Forecast - by Application
- 7.1.1. Retail
- 7.1.2. Catering
- 7.1.3. Other
- 7.2. Market Analysis, Insights and Forecast - by Types
- 7.2.1. Tea Bag
- 7.2.2. Loose Leaf Variety
- 7.1. Market Analysis, Insights and Forecast - by Application
- 8. Europe valerian tea Analysis, Insights and Forecast, 2019-2031
- 8.1. Market Analysis, Insights and Forecast - by Application
- 8.1.1. Retail
- 8.1.2. Catering
- 8.1.3. Other
- 8.2. Market Analysis, Insights and Forecast - by Types
- 8.2.1. Tea Bag
- 8.2.2. Loose Leaf Variety
- 8.1. Market Analysis, Insights and Forecast - by Application
- 9. Middle East & Africa valerian tea Analysis, Insights and Forecast, 2019-2031
- 9.1. Market Analysis, Insights and Forecast - by Application
- 9.1.1. Retail
- 9.1.2. Catering
- 9.1.3. Other
- 9.2. Market Analysis, Insights and Forecast - by Types
- 9.2.1. Tea Bag
- 9.2.2. Loose Leaf Variety
- 9.1. Market Analysis, Insights and Forecast - by Application
- 10. Asia Pacific valerian tea Analysis, Insights and Forecast, 2019-2031
- 10.1. Market Analysis, Insights and Forecast - by Application
- 10.1.1. Retail
- 10.1.2. Catering
- 10.1.3. Other
- 10.2. Market Analysis, Insights and Forecast - by Types
- 10.2.1. Tea Bag
- 10.2.2. Loose Leaf Variety
- 10.1. Market Analysis, Insights and Forecast - by Application
- 11. Competitive Analysis
- 11.1. Global Market Share Analysis 2024
- 11.2. Company Profiles
- 11.2.1 DAVIDsTEA
- 11.2.1.1. Overview
- 11.2.1.2. Products
- 11.2.1.3. SWOT Analysis
- 11.2.1.4. Recent Developments
- 11.2.1.5. Financials (Based on Availability)
- 11.2.2 Alvita
- 11.2.2.1. Overview
- 11.2.2.2. Products
- 11.2.2.3. SWOT Analysis
- 11.2.2.4. Recent Developments
- 11.2.2.5. Financials (Based on Availability)
- 11.2.3 Tea Life
- 11.2.3.1. Overview
- 11.2.3.2. Products
- 11.2.3.3. SWOT Analysis
- 11.2.3.4. Recent Developments
- 11.2.3.5. Financials (Based on Availability)
- 11.2.4 Traditional Medicials
- 11.2.4.1. Overview
- 11.2.4.2. Products
- 11.2.4.3. SWOT Analysis
- 11.2.4.4. Recent Developments
- 11.2.4.5. Financials (Based on Availability)
- 11.2.5 HerbaZest
- 11.2.5.1. Overview
- 11.2.5.2. Products
- 11.2.5.3. SWOT Analysis
- 11.2.5.4. Recent Developments
- 11.2.5.5. Financials (Based on Availability)
- 11.2.6 Koro
- 11.2.6.1. Overview
- 11.2.6.2. Products
- 11.2.6.3. SWOT Analysis
- 11.2.6.4. Recent Developments
- 11.2.6.5. Financials (Based on Availability)
- 11.2.7 PLAFAR
- 11.2.7.1. Overview
- 11.2.7.2. Products
- 11.2.7.3. SWOT Analysis
- 11.2.7.4. Recent Developments
- 11.2.7.5. Financials (Based on Availability)
- 11.2.8 The Republic of Tea
- 11.2.8.1. Overview
- 11.2.8.2. Products
- 11.2.8.3. SWOT Analysis
- 11.2.8.4. Recent Developments
- 11.2.8.5. Financials (Based on Availability)
- 11.2.9 Dr Stuart's
- 11.2.9.1. Overview
- 11.2.9.2. Products
- 11.2.9.3. SWOT Analysis
- 11.2.9.4. Recent Developments
- 11.2.9.5. Financials (Based on Availability)
- 11.2.1 DAVIDsTEA
List of Figures
- Figure 1: Global valerian tea Revenue Breakdown (million, %) by Region 2024 & 2032
- Figure 2: Global valerian tea Volume Breakdown (K, %) by Region 2024 & 2032
- Figure 3: North America valerian tea Revenue (million), by Application 2024 & 2032
- Figure 4: North America valerian tea Volume (K), by Application 2024 & 2032
- Figure 5: North America valerian tea Revenue Share (%), by Application 2024 & 2032
- Figure 6: North America valerian tea Volume Share (%), by Application 2024 & 2032
- Figure 7: North America valerian tea Revenue (million), by Types 2024 & 2032
- Figure 8: North America valerian tea Volume (K), by Types 2024 & 2032
- Figure 9: North America valerian tea Revenue Share (%), by Types 2024 & 2032
- Figure 10: North America valerian tea Volume Share (%), by Types 2024 & 2032
- Figure 11: North America valerian tea Revenue (million), by Country 2024 & 2032
- Figure 12: North America valerian tea Volume (K), by Country 2024 & 2032
- Figure 13: North America valerian tea Revenue Share (%), by Country 2024 & 2032
- Figure 14: North America valerian tea Volume Share (%), by Country 2024 & 2032
- Figure 15: South America valerian tea Revenue (million), by Application 2024 & 2032
- Figure 16: South America valerian tea Volume (K), by Application 2024 & 2032
- Figure 17: South America valerian tea Revenue Share (%), by Application 2024 & 2032
- Figure 18: South America valerian tea Volume Share (%), by Application 2024 & 2032
- Figure 19: South America valerian tea Revenue (million), by Types 2024 & 2032
- Figure 20: South America valerian tea Volume (K), by Types 2024 & 2032
- Figure 21: South America valerian tea Revenue Share (%), by Types 2024 & 2032
- Figure 22: South America valerian tea Volume Share (%), by Types 2024 & 2032
- Figure 23: South America valerian tea Revenue (million), by Country 2024 & 2032
- Figure 24: South America valerian tea Volume (K), by Country 2024 & 2032
- Figure 25: South America valerian tea Revenue Share (%), by Country 2024 & 2032
- Figure 26: South America valerian tea Volume Share (%), by Country 2024 & 2032
- Figure 27: Europe valerian tea Revenue (million), by Application 2024 & 2032
- Figure 28: Europe valerian tea Volume (K), by Application 2024 & 2032
- Figure 29: Europe valerian tea Revenue Share (%), by Application 2024 & 2032
- Figure 30: Europe valerian tea Volume Share (%), by Application 2024 & 2032
- Figure 31: Europe valerian tea Revenue (million), by Types 2024 & 2032
- Figure 32: Europe valerian tea Volume (K), by Types 2024 & 2032
- Figure 33: Europe valerian tea Revenue Share (%), by Types 2024 & 2032
- Figure 34: Europe valerian tea Volume Share (%), by Types 2024 & 2032
- Figure 35: Europe valerian tea Revenue (million), by Country 2024 & 2032
- Figure 36: Europe valerian tea Volume (K), by Country 2024 & 2032
- Figure 37: Europe valerian tea Revenue Share (%), by Country 2024 & 2032
- Figure 38: Europe valerian tea Volume Share (%), by Country 2024 & 2032
- Figure 39: Middle East & Africa valerian tea Revenue (million), by Application 2024 & 2032
- Figure 40: Middle East & Africa valerian tea Volume (K), by Application 2024 & 2032
- Figure 41: Middle East & Africa valerian tea Revenue Share (%), by Application 2024 & 2032
- Figure 42: Middle East & Africa valerian tea Volume Share (%), by Application 2024 & 2032
- Figure 43: Middle East & Africa valerian tea Revenue (million), by Types 2024 & 2032
- Figure 44: Middle East & Africa valerian tea Volume (K), by Types 2024 & 2032
- Figure 45: Middle East & Africa valerian tea Revenue Share (%), by Types 2024 & 2032
- Figure 46: Middle East & Africa valerian tea Volume Share (%), by Types 2024 & 2032
- Figure 47: Middle East & Africa valerian tea Revenue (million), by Country 2024 & 2032
- Figure 48: Middle East & Africa valerian tea Volume (K), by Country 2024 & 2032
- Figure 49: Middle East & Africa valerian tea Revenue Share (%), by Country 2024 & 2032
- Figure 50: Middle East & Africa valerian tea Volume Share (%), by Country 2024 & 2032
- Figure 51: Asia Pacific valerian tea Revenue (million), by Application 2024 & 2032
- Figure 52: Asia Pacific valerian tea Volume (K), by Application 2024 & 2032
- Figure 53: Asia Pacific valerian tea Revenue Share (%), by Application 2024 & 2032
- Figure 54: Asia Pacific valerian tea Volume Share (%), by Application 2024 & 2032
- Figure 55: Asia Pacific valerian tea Revenue (million), by Types 2024 & 2032
- Figure 56: Asia Pacific valerian tea Volume (K), by Types 2024 & 2032
- Figure 57: Asia Pacific valerian tea Revenue Share (%), by Types 2024 & 2032
- Figure 58: Asia Pacific valerian tea Volume Share (%), by Types 2024 & 2032
- Figure 59: Asia Pacific valerian tea Revenue (million), by Country 2024 & 2032
- Figure 60: Asia Pacific valerian tea Volume (K), by Country 2024 & 2032
- Figure 61: Asia Pacific valerian tea Revenue Share (%), by Country 2024 & 2032
- Figure 62: Asia Pacific valerian tea Volume Share (%), by Country 2024 & 2032
List of Tables
- Table 1: Global valerian tea Revenue million Forecast, by Region 2019 & 2032
- Table 2: Global valerian tea Volume K Forecast, by Region 2019 & 2032
- Table 3: Global valerian tea Revenue million Forecast, by Application 2019 & 2032
- Table 4: Global valerian tea Volume K Forecast, by Application 2019 & 2032
- Table 5: Global valerian tea Revenue million Forecast, by Types 2019 & 2032
- Table 6: Global valerian tea Volume K Forecast, by Types 2019 & 2032
- Table 7: Global valerian tea Revenue million Forecast, by Region 2019 & 2032
- Table 8: Global valerian tea Volume K Forecast, by Region 2019 & 2032
- Table 9: Global valerian tea Revenue million Forecast, by Application 2019 & 2032
- Table 10: Global valerian tea Volume K Forecast, by Application 2019 & 2032
- Table 11: Global valerian tea Revenue million Forecast, by Types 2019 & 2032
- Table 12: Global valerian tea Volume K Forecast, by Types 2019 & 2032
- Table 13: Global valerian tea Revenue million Forecast, by Country 2019 & 2032
- Table 14: Global valerian tea Volume K Forecast, by Country 2019 & 2032
- Table 15: United States valerian tea Revenue (million) Forecast, by Application 2019 & 2032
- Table 16: United States valerian tea Volume (K) Forecast, by Application 2019 & 2032
- Table 17: Canada valerian tea Revenue (million) Forecast, by Application 2019 & 2032
- Table 18: Canada valerian tea Volume (K) Forecast, by Application 2019 & 2032
- Table 19: Mexico valerian tea Revenue (million) Forecast, by Application 2019 & 2032
- Table 20: Mexico valerian tea Volume (K) Forecast, by Application 2019 & 2032
- Table 21: Global valerian tea Revenue million Forecast, by Application 2019 & 2032
- Table 22: Global valerian tea Volume K Forecast, by Application 2019 & 2032
- Table 23: Global valerian tea Revenue million Forecast, by Types 2019 & 2032
- Table 24: Global valerian tea Volume K Forecast, by Types 2019 & 2032
- Table 25: Global valerian tea Revenue million Forecast, by Country 2019 & 2032
- Table 26: Global valerian tea Volume K Forecast, by Country 2019 & 2032
- Table 27: Brazil valerian tea Revenue (million) Forecast, by Application 2019 & 2032
- Table 28: Brazil valerian tea Volume (K) Forecast, by Application 2019 & 2032
- Table 29: Argentina valerian tea Revenue (million) Forecast, by Application 2019 & 2032
- Table 30: Argentina valerian tea Volume (K) Forecast, by Application 2019 & 2032
- Table 31: Rest of South America valerian tea Revenue (million) Forecast, by Application 2019 & 2032
- Table 32: Rest of South America valerian tea Volume (K) Forecast, by Application 2019 & 2032
- Table 33: Global valerian tea Revenue million Forecast, by Application 2019 & 2032
- Table 34: Global valerian tea Volume K Forecast, by Application 2019 & 2032
- Table 35: Global valerian tea Revenue million Forecast, by Types 2019 & 2032
- Table 36: Global valerian tea Volume K Forecast, by Types 2019 & 2032
- Table 37: Global valerian tea Revenue million Forecast, by Country 2019 & 2032
- Table 38: Global valerian tea Volume K Forecast, by Country 2019 & 2032
- Table 39: United Kingdom valerian tea Revenue (million) Forecast, by Application 2019 & 2032
- Table 40: United Kingdom valerian tea Volume (K) Forecast, by Application 2019 & 2032
- Table 41: Germany valerian tea Revenue (million) Forecast, by Application 2019 & 2032
- Table 42: Germany valerian tea Volume (K) Forecast, by Application 2019 & 2032
- Table 43: France valerian tea Revenue (million) Forecast, by Application 2019 & 2032
- Table 44: France valerian tea Volume (K) Forecast, by Application 2019 & 2032
- Table 45: Italy valerian tea Revenue (million) Forecast, by Application 2019 & 2032
- Table 46: Italy valerian tea Volume (K) Forecast, by Application 2019 & 2032
- Table 47: Spain valerian tea Revenue (million) Forecast, by Application 2019 & 2032
- Table 48: Spain valerian tea Volume (K) Forecast, by Application 2019 & 2032
- Table 49: Russia valerian tea Revenue (million) Forecast, by Application 2019 & 2032
- Table 50: Russia valerian tea Volume (K) Forecast, by Application 2019 & 2032
- Table 51: Benelux valerian tea Revenue (million) Forecast, by Application 2019 & 2032
- Table 52: Benelux valerian tea Volume (K) Forecast, by Application 2019 & 2032
- Table 53: Nordics valerian tea Revenue (million) Forecast, by Application 2019 & 2032
- Table 54: Nordics valerian tea Volume (K) Forecast, by Application 2019 & 2032
- Table 55: Rest of Europe valerian tea Revenue (million) Forecast, by Application 2019 & 2032
- Table 56: Rest of Europe valerian tea Volume (K) Forecast, by Application 2019 & 2032
- Table 57: Global valerian tea Revenue million Forecast, by Application 2019 & 2032
- Table 58: Global valerian tea Volume K Forecast, by Application 2019 & 2032
- Table 59: Global valerian tea Revenue million Forecast, by Types 2019 & 2032
- Table 60: Global valerian tea Volume K Forecast, by Types 2019 & 2032
- Table 61: Global valerian tea Revenue million Forecast, by Country 2019 & 2032
- Table 62: Global valerian tea Volume K Forecast, by Country 2019 & 2032
- Table 63: Turkey valerian tea Revenue (million) Forecast, by Application 2019 & 2032
- Table 64: Turkey valerian tea Volume (K) Forecast, by Application 2019 & 2032
- Table 65: Israel valerian tea Revenue (million) Forecast, by Application 2019 & 2032
- Table 66: Israel valerian tea Volume (K) Forecast, by Application 2019 & 2032
- Table 67: GCC valerian tea Revenue (million) Forecast, by Application 2019 & 2032
- Table 68: GCC valerian tea Volume (K) Forecast, by Application 2019 & 2032
- Table 69: North Africa valerian tea Revenue (million) Forecast, by Application 2019 & 2032
- Table 70: North Africa valerian tea Volume (K) Forecast, by Application 2019 & 2032
- Table 71: South Africa valerian tea Revenue (million) Forecast, by Application 2019 & 2032
- Table 72: South Africa valerian tea Volume (K) Forecast, by Application 2019 & 2032
- Table 73: Rest of Middle East & Africa valerian tea Revenue (million) Forecast, by Application 2019 & 2032
- Table 74: Rest of Middle East & Africa valerian tea Volume (K) Forecast, by Application 2019 & 2032
- Table 75: Global valerian tea Revenue million Forecast, by Application 2019 & 2032
- Table 76: Global valerian tea Volume K Forecast, by Application 2019 & 2032
- Table 77: Global valerian tea Revenue million Forecast, by Types 2019 & 2032
- Table 78: Global valerian tea Volume K Forecast, by Types 2019 & 2032
- Table 79: Global valerian tea Revenue million Forecast, by Country 2019 & 2032
- Table 80: Global valerian tea Volume K Forecast, by Country 2019 & 2032
- Table 81: China valerian tea Revenue (million) Forecast, by Application 2019 & 2032
- Table 82: China valerian tea Volume (K) Forecast, by Application 2019 & 2032
- Table 83: India valerian tea Revenue (million) Forecast, by Application 2019 & 2032
- Table 84: India valerian tea Volume (K) Forecast, by Application 2019 & 2032
- Table 85: Japan valerian tea Revenue (million) Forecast, by Application 2019 & 2032
- Table 86: Japan valerian tea Volume (K) Forecast, by Application 2019 & 2032
- Table 87: South Korea valerian tea Revenue (million) Forecast, by Application 2019 & 2032
- Table 88: South Korea valerian tea Volume (K) Forecast, by Application 2019 & 2032
- Table 89: ASEAN valerian tea Revenue (million) Forecast, by Application 2019 & 2032
- Table 90: ASEAN valerian tea Volume (K) Forecast, by Application 2019 & 2032
- Table 91: Oceania valerian tea Revenue (million) Forecast, by Application 2019 & 2032
- Table 92: Oceania valerian tea Volume (K) Forecast, by Application 2019 & 2032
- Table 93: Rest of Asia Pacific valerian tea Revenue (million) Forecast, by Application 2019 & 2032
- Table 94: Rest of Asia Pacific valerian tea Volume (K) Forecast, by Application 2019 & 2032
Frequently Asked Questions
1. What is the projected Compound Annual Growth Rate (CAGR) of the valerian tea?
The projected CAGR is approximately XX%.
2. Which companies are prominent players in the valerian tea?
Key companies in the market include DAVIDsTEA, Alvita, Tea Life, Traditional Medicials, HerbaZest, Koro, PLAFAR, The Republic of Tea, Dr Stuart's.
3. What are the main segments of the valerian tea?
The market segments include Application, Types.
4. Can you provide details about the market size?
The market size is estimated to be USD XXX million as of 2022.
5. What are some drivers contributing to market growth?
N/A
6. What are the notable trends driving market growth?
N/A
7. Are there any restraints impacting market growth?
N/A
8. Can you provide examples of recent developments in the market?
N/A
9. What pricing options are available for accessing the report?
Pricing options include single-user, multi-user, and enterprise licenses priced at USD 4350.00, USD 6525.00, and USD 8700.00 respectively.
10. Is the market size provided in terms of value or volume?
The market size is provided in terms of value, measured in million and volume, measured in K.
11. Are there any specific market keywords associated with the report?
Yes, the market keyword associated with the report is "valerian tea," which aids in identifying and referencing the specific market segment covered.
12. How do I determine which pricing option suits my needs best?
The pricing options vary based on user requirements and access needs. Individual users may opt for single-user licenses, while businesses requiring broader access may choose multi-user or enterprise licenses for cost-effective access to the report.
13. Are there any additional resources or data provided in the valerian tea report?
While the report offers comprehensive insights, it's advisable to review the specific contents or supplementary materials provided to ascertain if additional resources or data are available.
14. How can I stay updated on further developments or reports in the valerian tea?
To stay informed about further developments, trends, and reports in the valerian tea, consider subscribing to industry newsletters, following relevant companies and organizations, or regularly checking reputable industry news sources and publications.
Methodology
Step 1 - Identification of Relevant Samples Size from Population Database


Step 2 - Approaches for Defining Global Market Size (Value, Volume* & Price*)

Note*: In applicable scenarios
Step 3 - Data Sources
Primary Research
- Web Analytics
- Survey Reports
- Research Institute
- Latest Research Reports
- Opinion Leaders
Secondary Research
- Annual Reports
- White Paper
- Latest Press Release
- Industry Association
- Paid Database
- Investor Presentations

Step 4 - Data Triangulation
Involves using different sources of information in order to increase the validity of a study
These sources are likely to be stakeholders in a program - participants, other researchers, program staff, other community members, and so on.
Then we put all data in single framework & apply various statistical tools to find out the dynamic on the market.
During the analysis stage, feedback from the stakeholder groups would be compared to determine areas of agreement as well as areas of divergence
