

Key Insights
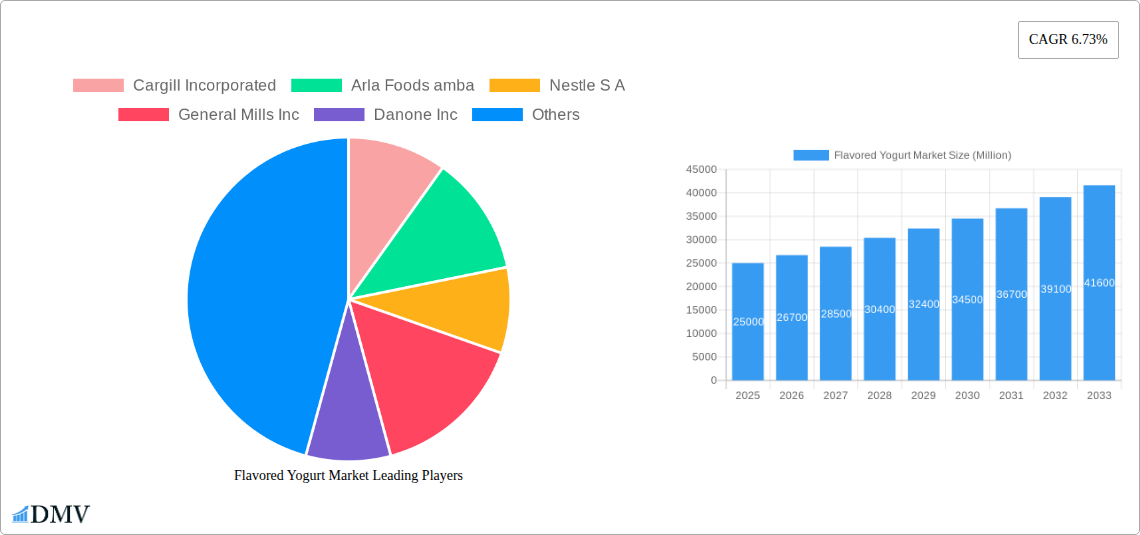
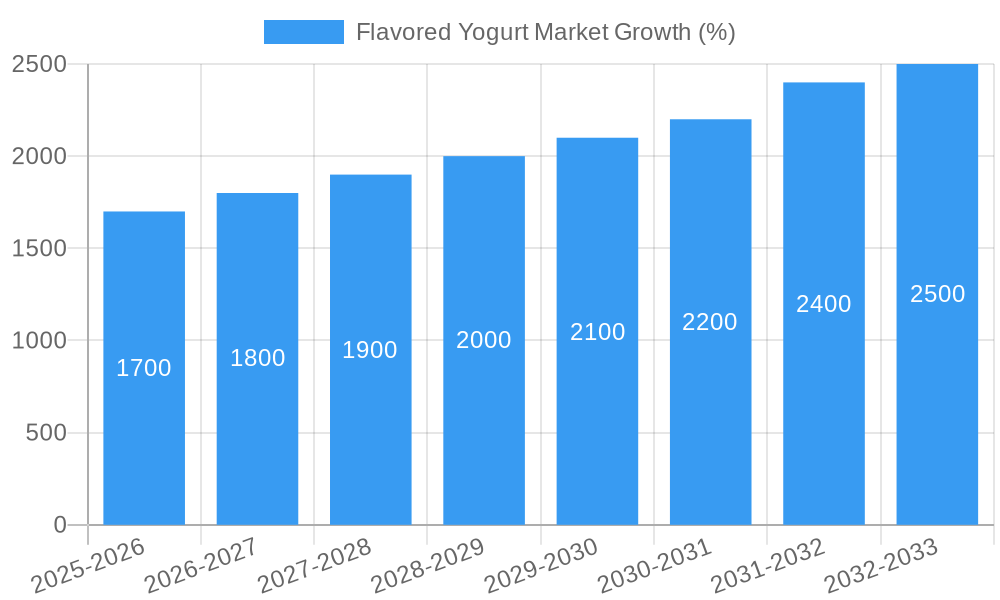
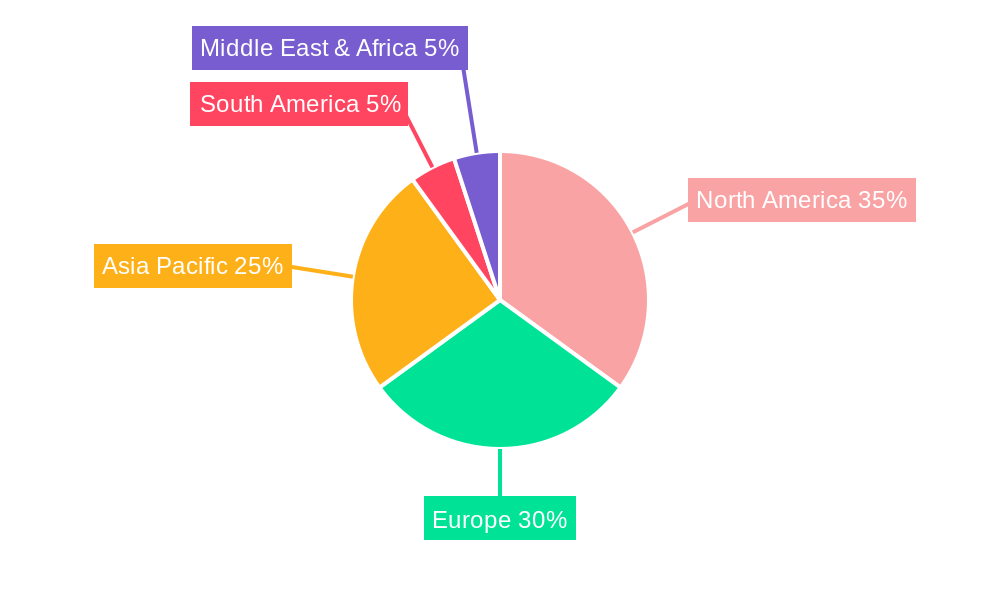
The global flavored yogurt market is experiencing robust growth, projected to maintain a Compound Annual Growth Rate (CAGR) of 6.73% from 2025 to 2033. This expansion is fueled by several key factors. The increasing health consciousness among consumers, coupled with the perception of yogurt as a healthier alternative to other desserts, is a significant driver. Convenience is another crucial factor, with readily available spoonable and drinkable formats catering to busy lifestyles. Furthermore, the rise of online retail channels and innovative product launches with diverse flavors and functional benefits are further propelling market growth. While the market faces some restraints such as price fluctuations in raw materials (milk) and intense competition, the overall outlook remains positive, particularly in regions like North America and Asia-Pacific where consumer preference for convenient and healthier food options is rapidly increasing. The market segmentation reflects this trend, with spoonable yogurt maintaining a larger market share compared to drinkable yogurt due to established consumer preference and wider distribution across different channels, including supermarkets, convenience stores, and online platforms. Key players like Cargill, Arla Foods, Nestlé, and Danone are strategically investing in product innovation, expanding their distribution networks, and focusing on marketing initiatives to capture a greater market share in this competitive landscape.
The segmentation by distribution channel reveals a significant presence across supermarkets/hypermarkets, convenience stores, and online retail stores. Supermarkets and hypermarkets continue to hold the largest share due to their extensive reach and established consumer base. However, the online retail segment is exhibiting rapid growth, driven by the increasing adoption of e-commerce and the convenience it offers to consumers. Growth in specific geographic regions, particularly Asia-Pacific, reflects increasing disposable incomes and changing dietary habits. While Europe and North America maintain strong market positions, Asia-Pacific's rapid economic expansion and growing preference for healthier snack options present significant opportunities for market expansion in the coming years. This indicates a future where the market will see increased product diversification, further penetration of online channels, and a focus on sustainability within the supply chain.
Flavored Yogurt Market: A Comprehensive Report (2019-2033)
This insightful report provides a comprehensive analysis of the Flavored Yogurt Market, offering a detailed examination of market trends, competitive dynamics, and future growth prospects. The study covers the period from 2019 to 2033, with 2025 serving as the base and estimated year. The report is invaluable for stakeholders seeking to understand this dynamic market and make informed strategic decisions. The global Flavored Yogurt Market is projected to reach xx Million by 2033, exhibiting a robust CAGR of xx% during the forecast period (2025-2033).
Flavored Yogurt Market Composition & Trends
This section delves into the intricate structure of the flavored yogurt market, analyzing market concentration, innovation drivers, regulatory frameworks, substitute products, consumer profiles, and mergers & acquisitions (M&A) activities. We examine the market share distribution among key players, revealing the competitive landscape and identifying dominant forces. The analysis includes quantifiable data on M&A deal values and their impact on market dynamics. The report also explores the evolving regulatory landscape and its influence on market growth, considering both opportunities and challenges. The influence of substitute products and changing consumer preferences on market share are also thoroughly discussed.
- Market Concentration: A detailed analysis of market share distribution among key players, including Cargill Incorporated, Arla Foods amba, Nestle S.A., General Mills Inc., Danone Inc., Fonterra Co-operative Group Limited, Lactalis Group, Yakult Honsha Co, Britannia Nutrition Foundation, and Chobani Inc.
- Innovation Catalysts: Examination of factors driving innovation, such as technological advancements in production and flavor development.
- Regulatory Landscape: Analysis of existing and evolving regulations impacting the flavored yogurt market, including labeling requirements and food safety standards.
- Substitute Products: Assessment of alternative products that compete with flavored yogurt and their impact on market share.
- End-User Profiles: A detailed segmentation of consumers based on demographics, preferences, and purchasing behavior.
- M&A Activities: Review of significant mergers and acquisitions in the flavored yogurt industry, including deal values and their strategic implications. Total M&A deal value for the historical period (2019-2024) is estimated at xx Million.
Flavored Yogurt Market Industry Evolution
This section provides a comprehensive overview of the flavored yogurt market's evolution, tracing its growth trajectory, technological advancements, and shifting consumer demands. The analysis includes detailed data on market growth rates, adoption metrics for new technologies, and the impact of evolving consumer preferences on product development and marketing strategies. We examine the transition to healthier options, the rising demand for plant-based yogurts, and the influence of functional ingredients and specific flavor profiles on market trends. The report also explores the impact of economic factors such as disposable income and consumer spending on overall market growth.
Leading Regions, Countries, or Segments in Flavored Yogurt Market
This section identifies the leading regions, countries, and segments within the flavored yogurt market, focusing on By Form (Spoonable, Drinkable) and Distribution Channel (Supermarket/Hypermarkets, Convenience Stores, Online Retail Stores, Other distribution channels). We pinpoint the dominant players and analyze the factors contributing to their success.
- By Form: Analysis of the market share and growth potential of spoonable versus drinkable flavored yogurts, considering consumer preferences and product innovation. Spoonable yogurt is currently the dominant segment, holding an estimated xx% market share in 2025.
- By Distribution Channel: Evaluation of the market share and growth prospects of each distribution channel, highlighting the impact of online retail and changing consumer shopping habits. Supermarket/Hypermarkets remain the largest distribution channel, commanding approximately xx% of the market in 2025.
Key Drivers (Examples):
- High consumer demand for convenient and healthy snacks.
- Growing preference for natural and organic ingredients.
- Increased investment in research and development of new flavors and formulations.
- Government support for the dairy industry in certain regions.
Flavored Yogurt Market Product Innovations
This section showcases recent product innovations, detailing their unique selling propositions (USPs) and technological advancements. The analysis covers new flavor profiles, functional ingredients, and packaging innovations, emphasizing their impact on market competitiveness and consumer appeal. For example, the rise of plant-based yogurts and the incorporation of probiotics and other functional ingredients are key areas of focus.
Propelling Factors for Flavored Yogurt Market Growth
This section identifies the key growth drivers for the flavored yogurt market, focusing on technological advancements, economic factors, and favorable regulatory environments. Examples include the development of new processing technologies, increasing disposable incomes in emerging markets, and government initiatives promoting the dairy industry.
Obstacles in the Flavored Yogurt Market
This section discusses the challenges and restraints impacting the flavored yogurt market, including regulatory hurdles, supply chain disruptions, and intense competition. The report quantifies the impact of these factors on market growth, providing insights into potential mitigation strategies.
Future Opportunities in Flavored Yogurt Market
This section highlights emerging opportunities in the flavored yogurt market, including new markets, innovative technologies, and evolving consumer trends. The analysis focuses on areas with high growth potential and suggests strategies for capitalizing on these opportunities.
Major Players in the Flavored Yogurt Market Ecosystem
- Cargill Incorporated
- Arla Foods amba
- Nestle S.A.
- General Mills Inc.
- Danone Inc.
- Fonterra Co-operative Group Limited
- Lactalis Group
- Yakult Honsha Co
- Britannia Nutrition Foundation
- Chobani Inc
Key Developments in Flavored Yogurt Market Industry
- September 2020: General Mills launched its Ratio brand yogurt, featuring 25 grams of protein and 3 grams of sugar per serving. This launch significantly impacted the market by introducing a higher-protein, lower-sugar option.
- 2021: Danone's Silk launched plant-based Greek yogurt in four flavors (Strawberry, Blueberry, Vanilla, Lemon), tapping into the growing demand for plant-based alternatives.
- March 2022: Muller Yogurt & Desserts launched an Australian-inspired yogurt in the UK, featuring a mango, passionfruit, and coconut blend. This product launch demonstrates successful international expansion strategies and caters to evolving flavor preferences.
Strategic Flavored Yogurt Market Forecast
This section provides a summary of the growth catalysts identified in the report, focusing on the future opportunities and market potential. The forecast emphasizes the expected trajectory of the market based on the analyzed trends and drivers, offering insights into the long-term outlook of the flavored yogurt sector.
Flavored Yogurt Market Segmentation
-
1. Form
- 1.1. Spoonable
- 1.2. Drinkable
-
2. Distribution Channel
- 2.1. Supermarket/Hypermarkets
- 2.2. Convenience Stores
- 2.3. Online Retail Stores
- 2.4. Other distribution channels
Flavored Yogurt Market Segmentation By Geography
-
1. North America
- 1.1. United States
- 1.2. Canada
- 1.3. Mexico
- 1.4. Rest of North America
-
2. Europe
- 2.1. United Kingdom
- 2.2. Germany
- 2.3. Spain
- 2.4. France
- 2.5. Italy
- 2.6. Russia
- 2.7. Rest of Europe
-
3. Asia Pacific
- 3.1. China
- 3.2. Japan
- 3.3. India
- 3.4. Australia
- 3.5. Rest of Asia Pacific
-
4. South America
- 4.1. Brazil
- 4.2. Argentina
- 4.3. Rest of South America
- 5. Middle East
-
6. Saudi Arabia
- 6.1. South Africa
- 6.2. Rest of Middle East
Flavored Yogurt Market REPORT HIGHLIGHTS
| Aspects | Details |
|---|---|
| Study Period | 2019-2033 |
| Base Year | 2024 |
| Estimated Year | 2025 |
| Forecast Period | 2025-2033 |
| Historical Period | 2019-2024 |
| Growth Rate | CAGR of 6.73% from 2019-2033 |
| Segmentation |
|
Table of Contents
- 1. Introduction
- 1.1. Research Scope
- 1.2. Market Segmentation
- 1.3. Research Methodology
- 1.4. Definitions and Assumptions
- 2. Executive Summary
- 2.1. Introduction
- 3. Market Dynamics
- 3.1. Introduction
- 3.2. Market Drivers
- 3.2.1. Growth In Foodservice Expenditure and Tourism Sector; Premiumization with the Growth of Fortified and Flavored Water
- 3.3. Market Restrains
- 3.3.1. Concerns Regarding Plastic Waste and the Rising Inclination Toward Tap Water
- 3.4. Market Trends
- 3.4.1. Rising demand for Plant-based yogurt
- 4. Market Factor Analysis
- 4.1. Porters Five Forces
- 4.2. Supply/Value Chain
- 4.3. PESTEL analysis
- 4.4. Market Entropy
- 4.5. Patent/Trademark Analysis
- 5. Global Flavored Yogurt Market Analysis, Insights and Forecast, 2019-2031
- 5.1. Market Analysis, Insights and Forecast - by Form
- 5.1.1. Spoonable
- 5.1.2. Drinkable
- 5.2. Market Analysis, Insights and Forecast - by Distribution Channel
- 5.2.1. Supermarket/Hypermarkets
- 5.2.2. Convenience Stores
- 5.2.3. Online Retail Stores
- 5.2.4. Other distribution channels
- 5.3. Market Analysis, Insights and Forecast - by Region
- 5.3.1. North America
- 5.3.2. Europe
- 5.3.3. Asia Pacific
- 5.3.4. South America
- 5.3.5. Middle East
- 5.3.6. Saudi Arabia
- 5.1. Market Analysis, Insights and Forecast - by Form
- 6. North America Flavored Yogurt Market Analysis, Insights and Forecast, 2019-2031
- 6.1. Market Analysis, Insights and Forecast - by Form
- 6.1.1. Spoonable
- 6.1.2. Drinkable
- 6.2. Market Analysis, Insights and Forecast - by Distribution Channel
- 6.2.1. Supermarket/Hypermarkets
- 6.2.2. Convenience Stores
- 6.2.3. Online Retail Stores
- 6.2.4. Other distribution channels
- 6.1. Market Analysis, Insights and Forecast - by Form
- 7. Europe Flavored Yogurt Market Analysis, Insights and Forecast, 2019-2031
- 7.1. Market Analysis, Insights and Forecast - by Form
- 7.1.1. Spoonable
- 7.1.2. Drinkable
- 7.2. Market Analysis, Insights and Forecast - by Distribution Channel
- 7.2.1. Supermarket/Hypermarkets
- 7.2.2. Convenience Stores
- 7.2.3. Online Retail Stores
- 7.2.4. Other distribution channels
- 7.1. Market Analysis, Insights and Forecast - by Form
- 8. Asia Pacific Flavored Yogurt Market Analysis, Insights and Forecast, 2019-2031
- 8.1. Market Analysis, Insights and Forecast - by Form
- 8.1.1. Spoonable
- 8.1.2. Drinkable
- 8.2. Market Analysis, Insights and Forecast - by Distribution Channel
- 8.2.1. Supermarket/Hypermarkets
- 8.2.2. Convenience Stores
- 8.2.3. Online Retail Stores
- 8.2.4. Other distribution channels
- 8.1. Market Analysis, Insights and Forecast - by Form
- 9. South America Flavored Yogurt Market Analysis, Insights and Forecast, 2019-2031
- 9.1. Market Analysis, Insights and Forecast - by Form
- 9.1.1. Spoonable
- 9.1.2. Drinkable
- 9.2. Market Analysis, Insights and Forecast - by Distribution Channel
- 9.2.1. Supermarket/Hypermarkets
- 9.2.2. Convenience Stores
- 9.2.3. Online Retail Stores
- 9.2.4. Other distribution channels
- 9.1. Market Analysis, Insights and Forecast - by Form
- 10. Middle East Flavored Yogurt Market Analysis, Insights and Forecast, 2019-2031
- 10.1. Market Analysis, Insights and Forecast - by Form
- 10.1.1. Spoonable
- 10.1.2. Drinkable
- 10.2. Market Analysis, Insights and Forecast - by Distribution Channel
- 10.2.1. Supermarket/Hypermarkets
- 10.2.2. Convenience Stores
- 10.2.3. Online Retail Stores
- 10.2.4. Other distribution channels
- 10.1. Market Analysis, Insights and Forecast - by Form
- 11. Saudi Arabia Flavored Yogurt Market Analysis, Insights and Forecast, 2019-2031
- 11.1. Market Analysis, Insights and Forecast - by Form
- 11.1.1. Spoonable
- 11.1.2. Drinkable
- 11.2. Market Analysis, Insights and Forecast - by Distribution Channel
- 11.2.1. Supermarket/Hypermarkets
- 11.2.2. Convenience Stores
- 11.2.3. Online Retail Stores
- 11.2.4. Other distribution channels
- 11.1. Market Analysis, Insights and Forecast - by Form
- 12. North America Flavored Yogurt Market Analysis, Insights and Forecast, 2019-2031
- 12.1. Market Analysis, Insights and Forecast - By Country/Sub-region
- 12.1.1 United States
- 12.1.2 Canada
- 12.1.3 Mexico
- 12.1.4 Rest of North America
- 13. Europe Flavored Yogurt Market Analysis, Insights and Forecast, 2019-2031
- 13.1. Market Analysis, Insights and Forecast - By Country/Sub-region
- 13.1.1 United Kingdom
- 13.1.2 Germany
- 13.1.3 Spain
- 13.1.4 France
- 13.1.5 Italy
- 13.1.6 Russia
- 13.1.7 Rest of Europe
- 14. Asia Pacific Flavored Yogurt Market Analysis, Insights and Forecast, 2019-2031
- 14.1. Market Analysis, Insights and Forecast - By Country/Sub-region
- 14.1.1 China
- 14.1.2 Japan
- 14.1.3 India
- 14.1.4 Australia
- 14.1.5 Rest of Asia Pacific
- 15. South America Flavored Yogurt Market Analysis, Insights and Forecast, 2019-2031
- 15.1. Market Analysis, Insights and Forecast - By Country/Sub-region
- 15.1.1 Brazil
- 15.1.2 Argentina
- 15.1.3 Rest of South America
- 16. Middle East Flavored Yogurt Market Analysis, Insights and Forecast, 2019-2031
- 16.1. Market Analysis, Insights and Forecast - By Country/Sub-region
- 16.1.1.
- 17. Saudi Arabia Flavored Yogurt Market Analysis, Insights and Forecast, 2019-2031
- 17.1. Market Analysis, Insights and Forecast - By Country/Sub-region
- 17.1.1 South Africa
- 17.1.2 Rest of Middle East
- 18. Competitive Analysis
- 18.1. Global Market Share Analysis 2024
- 18.2. Company Profiles
- 18.2.1 Cargill Incorporated
- 18.2.1.1. Overview
- 18.2.1.2. Products
- 18.2.1.3. SWOT Analysis
- 18.2.1.4. Recent Developments
- 18.2.1.5. Financials (Based on Availability)
- 18.2.2 Arla Foods amba
- 18.2.2.1. Overview
- 18.2.2.2. Products
- 18.2.2.3. SWOT Analysis
- 18.2.2.4. Recent Developments
- 18.2.2.5. Financials (Based on Availability)
- 18.2.3 Nestle S A
- 18.2.3.1. Overview
- 18.2.3.2. Products
- 18.2.3.3. SWOT Analysis
- 18.2.3.4. Recent Developments
- 18.2.3.5. Financials (Based on Availability)
- 18.2.4 General Mills Inc
- 18.2.4.1. Overview
- 18.2.4.2. Products
- 18.2.4.3. SWOT Analysis
- 18.2.4.4. Recent Developments
- 18.2.4.5. Financials (Based on Availability)
- 18.2.5 Danone Inc
- 18.2.5.1. Overview
- 18.2.5.2. Products
- 18.2.5.3. SWOT Analysis
- 18.2.5.4. Recent Developments
- 18.2.5.5. Financials (Based on Availability)
- 18.2.6 Fonterra Co-operative Group Limited
- 18.2.6.1. Overview
- 18.2.6.2. Products
- 18.2.6.3. SWOT Analysis
- 18.2.6.4. Recent Developments
- 18.2.6.5. Financials (Based on Availability)
- 18.2.7 Lactalis Group*List Not Exhaustive
- 18.2.7.1. Overview
- 18.2.7.2. Products
- 18.2.7.3. SWOT Analysis
- 18.2.7.4. Recent Developments
- 18.2.7.5. Financials (Based on Availability)
- 18.2.8 Yakult Honsha Co
- 18.2.8.1. Overview
- 18.2.8.2. Products
- 18.2.8.3. SWOT Analysis
- 18.2.8.4. Recent Developments
- 18.2.8.5. Financials (Based on Availability)
- 18.2.9 Britannia Nutrition Foundation
- 18.2.9.1. Overview
- 18.2.9.2. Products
- 18.2.9.3. SWOT Analysis
- 18.2.9.4. Recent Developments
- 18.2.9.5. Financials (Based on Availability)
- 18.2.10 Chobani Inc
- 18.2.10.1. Overview
- 18.2.10.2. Products
- 18.2.10.3. SWOT Analysis
- 18.2.10.4. Recent Developments
- 18.2.10.5. Financials (Based on Availability)
- 18.2.1 Cargill Incorporated
List of Figures
- Figure 1: Global Flavored Yogurt Market Revenue Breakdown (Million, %) by Region 2024 & 2032
- Figure 2: North America Flavored Yogurt Market Revenue (Million), by Country 2024 & 2032
- Figure 3: North America Flavored Yogurt Market Revenue Share (%), by Country 2024 & 2032
- Figure 4: Europe Flavored Yogurt Market Revenue (Million), by Country 2024 & 2032
- Figure 5: Europe Flavored Yogurt Market Revenue Share (%), by Country 2024 & 2032
- Figure 6: Asia Pacific Flavored Yogurt Market Revenue (Million), by Country 2024 & 2032
- Figure 7: Asia Pacific Flavored Yogurt Market Revenue Share (%), by Country 2024 & 2032
- Figure 8: South America Flavored Yogurt Market Revenue (Million), by Country 2024 & 2032
- Figure 9: South America Flavored Yogurt Market Revenue Share (%), by Country 2024 & 2032
- Figure 10: Middle East Flavored Yogurt Market Revenue (Million), by Country 2024 & 2032
- Figure 11: Middle East Flavored Yogurt Market Revenue Share (%), by Country 2024 & 2032
- Figure 12: Saudi Arabia Flavored Yogurt Market Revenue (Million), by Country 2024 & 2032
- Figure 13: Saudi Arabia Flavored Yogurt Market Revenue Share (%), by Country 2024 & 2032
- Figure 14: North America Flavored Yogurt Market Revenue (Million), by Form 2024 & 2032
- Figure 15: North America Flavored Yogurt Market Revenue Share (%), by Form 2024 & 2032
- Figure 16: North America Flavored Yogurt Market Revenue (Million), by Distribution Channel 2024 & 2032
- Figure 17: North America Flavored Yogurt Market Revenue Share (%), by Distribution Channel 2024 & 2032
- Figure 18: North America Flavored Yogurt Market Revenue (Million), by Country 2024 & 2032
- Figure 19: North America Flavored Yogurt Market Revenue Share (%), by Country 2024 & 2032
- Figure 20: Europe Flavored Yogurt Market Revenue (Million), by Form 2024 & 2032
- Figure 21: Europe Flavored Yogurt Market Revenue Share (%), by Form 2024 & 2032
- Figure 22: Europe Flavored Yogurt Market Revenue (Million), by Distribution Channel 2024 & 2032
- Figure 23: Europe Flavored Yogurt Market Revenue Share (%), by Distribution Channel 2024 & 2032
- Figure 24: Europe Flavored Yogurt Market Revenue (Million), by Country 2024 & 2032
- Figure 25: Europe Flavored Yogurt Market Revenue Share (%), by Country 2024 & 2032
- Figure 26: Asia Pacific Flavored Yogurt Market Revenue (Million), by Form 2024 & 2032
- Figure 27: Asia Pacific Flavored Yogurt Market Revenue Share (%), by Form 2024 & 2032
- Figure 28: Asia Pacific Flavored Yogurt Market Revenue (Million), by Distribution Channel 2024 & 2032
- Figure 29: Asia Pacific Flavored Yogurt Market Revenue Share (%), by Distribution Channel 2024 & 2032
- Figure 30: Asia Pacific Flavored Yogurt Market Revenue (Million), by Country 2024 & 2032
- Figure 31: Asia Pacific Flavored Yogurt Market Revenue Share (%), by Country 2024 & 2032
- Figure 32: South America Flavored Yogurt Market Revenue (Million), by Form 2024 & 2032
- Figure 33: South America Flavored Yogurt Market Revenue Share (%), by Form 2024 & 2032
- Figure 34: South America Flavored Yogurt Market Revenue (Million), by Distribution Channel 2024 & 2032
- Figure 35: South America Flavored Yogurt Market Revenue Share (%), by Distribution Channel 2024 & 2032
- Figure 36: South America Flavored Yogurt Market Revenue (Million), by Country 2024 & 2032
- Figure 37: South America Flavored Yogurt Market Revenue Share (%), by Country 2024 & 2032
- Figure 38: Middle East Flavored Yogurt Market Revenue (Million), by Form 2024 & 2032
- Figure 39: Middle East Flavored Yogurt Market Revenue Share (%), by Form 2024 & 2032
- Figure 40: Middle East Flavored Yogurt Market Revenue (Million), by Distribution Channel 2024 & 2032
- Figure 41: Middle East Flavored Yogurt Market Revenue Share (%), by Distribution Channel 2024 & 2032
- Figure 42: Middle East Flavored Yogurt Market Revenue (Million), by Country 2024 & 2032
- Figure 43: Middle East Flavored Yogurt Market Revenue Share (%), by Country 2024 & 2032
- Figure 44: Saudi Arabia Flavored Yogurt Market Revenue (Million), by Form 2024 & 2032
- Figure 45: Saudi Arabia Flavored Yogurt Market Revenue Share (%), by Form 2024 & 2032
- Figure 46: Saudi Arabia Flavored Yogurt Market Revenue (Million), by Distribution Channel 2024 & 2032
- Figure 47: Saudi Arabia Flavored Yogurt Market Revenue Share (%), by Distribution Channel 2024 & 2032
- Figure 48: Saudi Arabia Flavored Yogurt Market Revenue (Million), by Country 2024 & 2032
- Figure 49: Saudi Arabia Flavored Yogurt Market Revenue Share (%), by Country 2024 & 2032
List of Tables
- Table 1: Global Flavored Yogurt Market Revenue Million Forecast, by Region 2019 & 2032
- Table 2: Global Flavored Yogurt Market Revenue Million Forecast, by Form 2019 & 2032
- Table 3: Global Flavored Yogurt Market Revenue Million Forecast, by Distribution Channel 2019 & 2032
- Table 4: Global Flavored Yogurt Market Revenue Million Forecast, by Region 2019 & 2032
- Table 5: Global Flavored Yogurt Market Revenue Million Forecast, by Country 2019 & 2032
- Table 6: United States Flavored Yogurt Market Revenue (Million) Forecast, by Application 2019 & 2032
- Table 7: Canada Flavored Yogurt Market Revenue (Million) Forecast, by Application 2019 & 2032
- Table 8: Mexico Flavored Yogurt Market Revenue (Million) Forecast, by Application 2019 & 2032
- Table 9: Rest of North America Flavored Yogurt Market Revenue (Million) Forecast, by Application 2019 & 2032
- Table 10: Global Flavored Yogurt Market Revenue Million Forecast, by Country 2019 & 2032
- Table 11: United Kingdom Flavored Yogurt Market Revenue (Million) Forecast, by Application 2019 & 2032
- Table 12: Germany Flavored Yogurt Market Revenue (Million) Forecast, by Application 2019 & 2032
- Table 13: Spain Flavored Yogurt Market Revenue (Million) Forecast, by Application 2019 & 2032
- Table 14: France Flavored Yogurt Market Revenue (Million) Forecast, by Application 2019 & 2032
- Table 15: Italy Flavored Yogurt Market Revenue (Million) Forecast, by Application 2019 & 2032
- Table 16: Russia Flavored Yogurt Market Revenue (Million) Forecast, by Application 2019 & 2032
- Table 17: Rest of Europe Flavored Yogurt Market Revenue (Million) Forecast, by Application 2019 & 2032
- Table 18: Global Flavored Yogurt Market Revenue Million Forecast, by Country 2019 & 2032
- Table 19: China Flavored Yogurt Market Revenue (Million) Forecast, by Application 2019 & 2032
- Table 20: Japan Flavored Yogurt Market Revenue (Million) Forecast, by Application 2019 & 2032
- Table 21: India Flavored Yogurt Market Revenue (Million) Forecast, by Application 2019 & 2032
- Table 22: Australia Flavored Yogurt Market Revenue (Million) Forecast, by Application 2019 & 2032
- Table 23: Rest of Asia Pacific Flavored Yogurt Market Revenue (Million) Forecast, by Application 2019 & 2032
- Table 24: Global Flavored Yogurt Market Revenue Million Forecast, by Country 2019 & 2032
- Table 25: Brazil Flavored Yogurt Market Revenue (Million) Forecast, by Application 2019 & 2032
- Table 26: Argentina Flavored Yogurt Market Revenue (Million) Forecast, by Application 2019 & 2032
- Table 27: Rest of South America Flavored Yogurt Market Revenue (Million) Forecast, by Application 2019 & 2032
- Table 28: Global Flavored Yogurt Market Revenue Million Forecast, by Country 2019 & 2032
- Table 29: Flavored Yogurt Market Revenue (Million) Forecast, by Application 2019 & 2032
- Table 30: Global Flavored Yogurt Market Revenue Million Forecast, by Country 2019 & 2032
- Table 31: South Africa Flavored Yogurt Market Revenue (Million) Forecast, by Application 2019 & 2032
- Table 32: Rest of Middle East Flavored Yogurt Market Revenue (Million) Forecast, by Application 2019 & 2032
- Table 33: Global Flavored Yogurt Market Revenue Million Forecast, by Form 2019 & 2032
- Table 34: Global Flavored Yogurt Market Revenue Million Forecast, by Distribution Channel 2019 & 2032
- Table 35: Global Flavored Yogurt Market Revenue Million Forecast, by Country 2019 & 2032
- Table 36: United States Flavored Yogurt Market Revenue (Million) Forecast, by Application 2019 & 2032
- Table 37: Canada Flavored Yogurt Market Revenue (Million) Forecast, by Application 2019 & 2032
- Table 38: Mexico Flavored Yogurt Market Revenue (Million) Forecast, by Application 2019 & 2032
- Table 39: Rest of North America Flavored Yogurt Market Revenue (Million) Forecast, by Application 2019 & 2032
- Table 40: Global Flavored Yogurt Market Revenue Million Forecast, by Form 2019 & 2032
- Table 41: Global Flavored Yogurt Market Revenue Million Forecast, by Distribution Channel 2019 & 2032
- Table 42: Global Flavored Yogurt Market Revenue Million Forecast, by Country 2019 & 2032
- Table 43: United Kingdom Flavored Yogurt Market Revenue (Million) Forecast, by Application 2019 & 2032
- Table 44: Germany Flavored Yogurt Market Revenue (Million) Forecast, by Application 2019 & 2032
- Table 45: Spain Flavored Yogurt Market Revenue (Million) Forecast, by Application 2019 & 2032
- Table 46: France Flavored Yogurt Market Revenue (Million) Forecast, by Application 2019 & 2032
- Table 47: Italy Flavored Yogurt Market Revenue (Million) Forecast, by Application 2019 & 2032
- Table 48: Russia Flavored Yogurt Market Revenue (Million) Forecast, by Application 2019 & 2032
- Table 49: Rest of Europe Flavored Yogurt Market Revenue (Million) Forecast, by Application 2019 & 2032
- Table 50: Global Flavored Yogurt Market Revenue Million Forecast, by Form 2019 & 2032
- Table 51: Global Flavored Yogurt Market Revenue Million Forecast, by Distribution Channel 2019 & 2032
- Table 52: Global Flavored Yogurt Market Revenue Million Forecast, by Country 2019 & 2032
- Table 53: China Flavored Yogurt Market Revenue (Million) Forecast, by Application 2019 & 2032
- Table 54: Japan Flavored Yogurt Market Revenue (Million) Forecast, by Application 2019 & 2032
- Table 55: India Flavored Yogurt Market Revenue (Million) Forecast, by Application 2019 & 2032
- Table 56: Australia Flavored Yogurt Market Revenue (Million) Forecast, by Application 2019 & 2032
- Table 57: Rest of Asia Pacific Flavored Yogurt Market Revenue (Million) Forecast, by Application 2019 & 2032
- Table 58: Global Flavored Yogurt Market Revenue Million Forecast, by Form 2019 & 2032
- Table 59: Global Flavored Yogurt Market Revenue Million Forecast, by Distribution Channel 2019 & 2032
- Table 60: Global Flavored Yogurt Market Revenue Million Forecast, by Country 2019 & 2032
- Table 61: Brazil Flavored Yogurt Market Revenue (Million) Forecast, by Application 2019 & 2032
- Table 62: Argentina Flavored Yogurt Market Revenue (Million) Forecast, by Application 2019 & 2032
- Table 63: Rest of South America Flavored Yogurt Market Revenue (Million) Forecast, by Application 2019 & 2032
- Table 64: Global Flavored Yogurt Market Revenue Million Forecast, by Form 2019 & 2032
- Table 65: Global Flavored Yogurt Market Revenue Million Forecast, by Distribution Channel 2019 & 2032
- Table 66: Global Flavored Yogurt Market Revenue Million Forecast, by Country 2019 & 2032
- Table 67: Global Flavored Yogurt Market Revenue Million Forecast, by Form 2019 & 2032
- Table 68: Global Flavored Yogurt Market Revenue Million Forecast, by Distribution Channel 2019 & 2032
- Table 69: Global Flavored Yogurt Market Revenue Million Forecast, by Country 2019 & 2032
- Table 70: South Africa Flavored Yogurt Market Revenue (Million) Forecast, by Application 2019 & 2032
- Table 71: Rest of Middle East Flavored Yogurt Market Revenue (Million) Forecast, by Application 2019 & 2032
Frequently Asked Questions
1. What is the projected Compound Annual Growth Rate (CAGR) of the Flavored Yogurt Market?
The projected CAGR is approximately 6.73%.
2. Which companies are prominent players in the Flavored Yogurt Market?
Key companies in the market include Cargill Incorporated, Arla Foods amba, Nestle S A, General Mills Inc, Danone Inc, Fonterra Co-operative Group Limited, Lactalis Group*List Not Exhaustive, Yakult Honsha Co, Britannia Nutrition Foundation, Chobani Inc.
3. What are the main segments of the Flavored Yogurt Market?
The market segments include Form, Distribution Channel.
4. Can you provide details about the market size?
The market size is estimated to be USD XX Million as of 2022.
5. What are some drivers contributing to market growth?
Growth In Foodservice Expenditure and Tourism Sector; Premiumization with the Growth of Fortified and Flavored Water.
6. What are the notable trends driving market growth?
Rising demand for Plant-based yogurt.
7. Are there any restraints impacting market growth?
Concerns Regarding Plastic Waste and the Rising Inclination Toward Tap Water.
8. Can you provide examples of recent developments in the market?
In March 2022, Muller Yogurt & Desserts launched its latest Australian-inspired yogurt in the United Kingdom. It is a creamy yogurt that has a 3-in-1 fruit blend in the corner, including a mixture of mango, passionfruit, and coconut.
9. What pricing options are available for accessing the report?
Pricing options include single-user, multi-user, and enterprise licenses priced at USD 4750, USD 5250, and USD 8750 respectively.
10. Is the market size provided in terms of value or volume?
The market size is provided in terms of value, measured in Million.
11. Are there any specific market keywords associated with the report?
Yes, the market keyword associated with the report is "Flavored Yogurt Market," which aids in identifying and referencing the specific market segment covered.
12. How do I determine which pricing option suits my needs best?
The pricing options vary based on user requirements and access needs. Individual users may opt for single-user licenses, while businesses requiring broader access may choose multi-user or enterprise licenses for cost-effective access to the report.
13. Are there any additional resources or data provided in the Flavored Yogurt Market report?
While the report offers comprehensive insights, it's advisable to review the specific contents or supplementary materials provided to ascertain if additional resources or data are available.
14. How can I stay updated on further developments or reports in the Flavored Yogurt Market?
To stay informed about further developments, trends, and reports in the Flavored Yogurt Market, consider subscribing to industry newsletters, following relevant companies and organizations, or regularly checking reputable industry news sources and publications.
Methodology
Step 1 - Identification of Relevant Samples Size from Population Database


Step 2 - Approaches for Defining Global Market Size (Value, Volume* & Price*)

Note*: In applicable scenarios
Step 3 - Data Sources
Primary Research
- Web Analytics
- Survey Reports
- Research Institute
- Latest Research Reports
- Opinion Leaders
Secondary Research
- Annual Reports
- White Paper
- Latest Press Release
- Industry Association
- Paid Database
- Investor Presentations

Step 4 - Data Triangulation
Involves using different sources of information in order to increase the validity of a study
These sources are likely to be stakeholders in a program - participants, other researchers, program staff, other community members, and so on.
Then we put all data in single framework & apply various statistical tools to find out the dynamic on the market.
During the analysis stage, feedback from the stakeholder groups would be compared to determine areas of agreement as well as areas of divergence
