

Key Insights
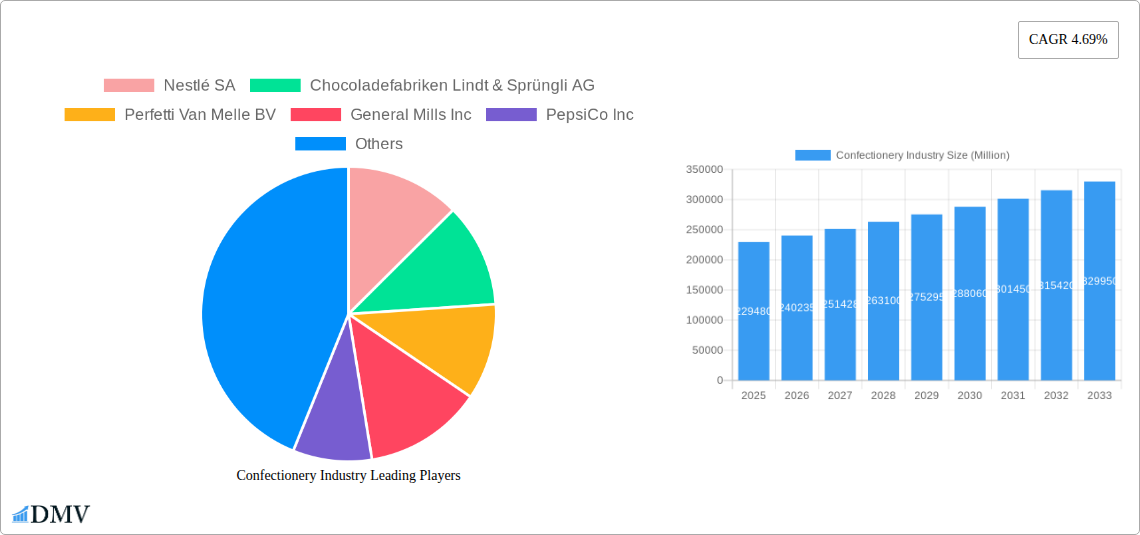
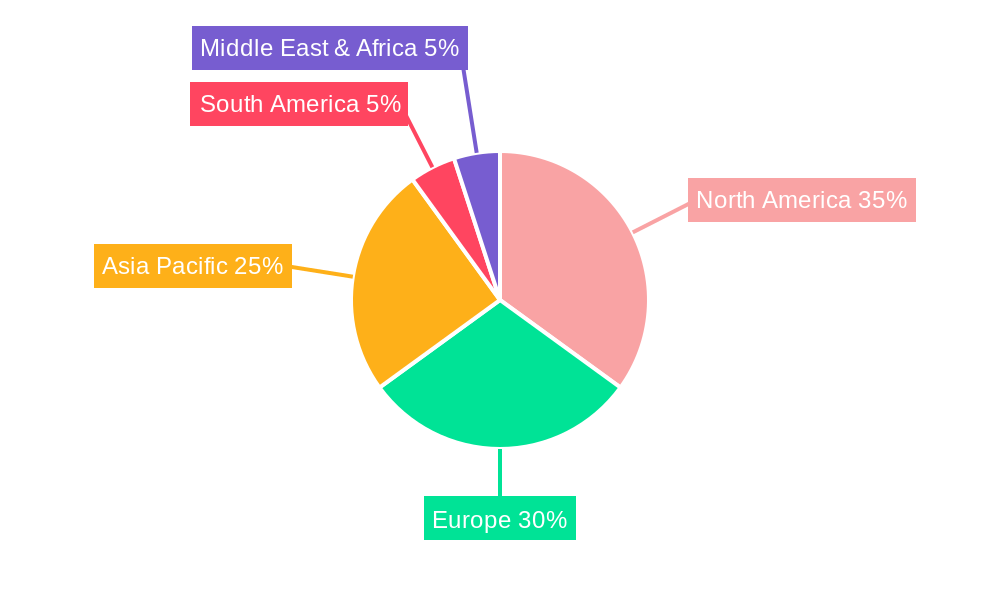
The global confectionery market, valued at $229.48 billion in 2025, is projected to experience robust growth, driven by several key factors. Increasing disposable incomes, particularly in developing economies, fuel demand for indulgent treats. Changing consumer preferences towards premium and healthier confectionery options, such as organic and fair-trade chocolates, are also shaping market dynamics. The rise of e-commerce platforms provides convenient access to a wider variety of confectionery products, further boosting market expansion. However, growing health consciousness, concerns about sugar consumption, and increasing government regulations on added sugars present challenges. Competition among established players and the emergence of innovative confectionery brands will continue to influence market share. The market segmentation reveals that online retail stores are experiencing rapid growth, while the convenience store channel remains a significant contributor. Chocolate continues to dominate the confectionery segment, though other categories like gummies and hard candies are gaining traction. Regional variations are evident, with North America and Europe holding significant market shares due to established consumer bases and well-developed distribution networks. However, the Asia-Pacific region demonstrates considerable growth potential, driven by rising middle-class populations and changing consumption patterns. The forecast period (2025-2033) anticipates sustained growth, propelled by product innovation, targeted marketing campaigns, and expansion into new markets.
This growth trajectory will likely be influenced by successful brand strategies and product diversification. Companies are increasingly focused on adapting to evolving consumer needs by offering healthier alternatives, unique flavors, and sustainable sourcing practices. Strategic partnerships and mergers and acquisitions are expected to play a significant role in shaping the competitive landscape. Furthermore, the confectionery market’s response to economic fluctuations and global events will be a determining factor in achieving the projected growth rates. Understanding consumer behavior, adapting to shifting preferences, and embracing sustainable and ethical practices will be crucial for success within this dynamic and competitive market.
Confectionery Industry Market Report: 2019-2033
This comprehensive report provides a detailed analysis of the global confectionery industry, projecting a market value exceeding $XXX Million by 2033. Covering the period from 2019 to 2033 (base year 2025), this study offers invaluable insights for stakeholders seeking to navigate this dynamic market.
Confectionery Industry Market Composition & Trends
This section delves into the intricate structure of the confectionery market, examining key players, innovation drivers, and regulatory influences. We analyze market concentration, revealing the dominance of leading players like Nestlé SA, Mars Incorporated, and Mondelez International Inc., who collectively hold an estimated xx% market share. The report further explores the impact of mergers and acquisitions (M&A), analyzing deals worth over $XX Million in the last five years, highlighting their influence on market consolidation and innovation. Innovation catalysts, such as the increasing demand for healthier confectionery options and sustainable packaging, are also discussed. Finally, the report examines the evolving regulatory landscape, including labeling requirements and sugar taxes, and their impact on product development and market growth. Substitute products, consumer preferences, and end-user profiles are also analyzed to provide a complete picture of market dynamics.
- Market Share Distribution: Nestlé SA (xx%), Mars Incorporated (xx%), Mondelez International Inc. (xx%), others (xx%).
- M&A Deal Value (2019-2024): $XX Million
- Key Innovation Drivers: Healthier options, sustainable packaging, personalized experiences.
- Regulatory Landscape: Evolving sugar taxes and labeling regulations.
Confectionery Industry Evolution
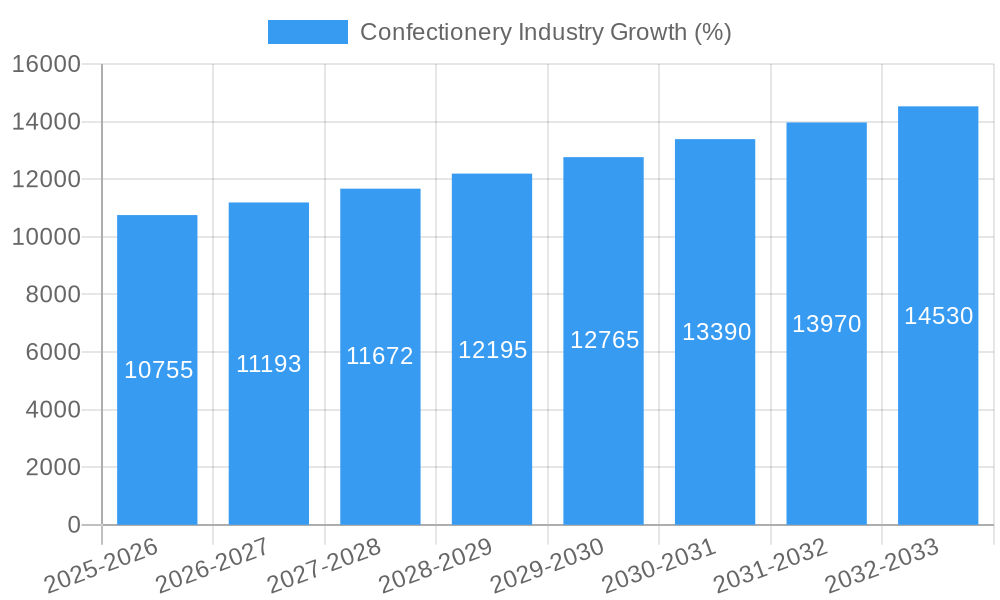
This section analyzes the confectionery industry's growth trajectory over the study period (2019-2033), detailing market size, growth rates, and technological advancements. We explore the shifting consumer preferences towards healthier options, premium products, and ethical sourcing, which are reshaping product portfolios and marketing strategies. The report also looks at technological advancements in production, packaging, and distribution, impacting efficiency and consumer engagement. Specific data points, including compound annual growth rates (CAGR) and adoption metrics for innovative technologies (e.g., automation, 3D printing), provide a quantitative perspective on the industry's evolution. The impact of macroeconomic factors, such as economic growth and consumer spending patterns, on the market is also explored. The forecast period (2025-2033) projects a CAGR of xx%, driven by factors such as increasing disposable incomes in emerging markets and the continued innovation in product offerings.
Leading Regions, Countries, or Segments in Confectionery Industry
This section identifies the leading regions, countries, and segments within the confectionery market. While precise market share data is proprietary to the full report, we will highlight key dominance factors.
Dominant Segments:
- Distribution Channel: Supermarket/Hypermarket is expected to remain the largest distribution channel, due to its wide reach and established infrastructure. Online retail stores are showing significant growth, fueled by e-commerce expansion and consumer convenience.
- Confections: Chocolate continues to be the leading confectionery segment, driven by its enduring popularity and diverse product offerings.
Key Drivers of Dominance (Illustrative examples):
- Supermarket/Hypermarket: Established distribution network, consumer loyalty programs.
- Chocolate: Broad appeal, product diversification, consistent consumer demand.
- North America: Large consumer base, high disposable income.
- Europe: Well-established confectionery industry, high levels of product innovation.
Confectionery Industry Product Innovations
Recent innovations in the confectionery industry focus on healthier alternatives, using natural ingredients and reduced sugar content. Functional confections are gaining traction, incorporating health benefits like probiotics or vitamins. Premiumization is another trend, with manufacturers offering high-quality ingredients and unique flavor profiles to command higher prices. Technological advancements such as 3D printing are emerging, offering customized and personalized confectionery experiences. Smart packaging incorporating sensors for freshness tracking is also gaining momentum.
Propelling Factors for Confectionery Industry Growth
The confectionery market is driven by several key factors. Rising disposable incomes in emerging economies fuel higher demand. Technological innovations like automation improve production efficiency and lower costs. Favorable regulatory environments in some regions encourage industry expansion. Finally, constant product innovation in areas such as healthier options and premiumization keeps the market dynamic and appealing to a broader consumer base.
Obstacles in the Confectionery Industry Market
The confectionery industry faces significant challenges. Fluctuating raw material prices increase production costs. Stricter health and safety regulations in certain markets could constrain growth. Intense competition from established and emerging players necessitates continuous innovation and efficient marketing strategies. Supply chain disruptions due to global events can impact production and distribution, causing price increases and potential shortages.
Future Opportunities in Confectionery Industry
Future opportunities lie in untapped markets, such as emerging economies with increasing consumer spending power. Functional confections with added health benefits present a strong avenue for growth. Sustainable and ethically sourced ingredients are increasingly demanded by consumers, presenting opportunities for brands. Technological advancements like personalized confectionery production and innovative packaging further unlock new avenues for market expansion.
Major Players in the Confectionery Industry Ecosystem
- Nestlé SA
- Chocoladefabriken Lindt & Sprüngli AG
- Perfetti Van Melle BV
- General Mills Inc
- PepsiCo Inc
- August Storck KG
- Ferrero International SA
- Mars Incorporated
- Yıldız Holding A.Ş.
- Lotte Corporation
- HARIBO Holding GmbH & Co KG
- Mondelēz International Inc
- Meiji Holdings Company Ltd
- The Hershey Company
- Kellogg Company
Key Developments in Confectionery Industry Industry
- July 2023: HARIBO® opened its first North American manufacturing facility, significantly increasing its US production capacity.
- July 2023: Ferrara Candy Co. (Ferrero's sister company) acquired Dori Alimentos, expanding its presence in the Brazilian confectionery market.
- August 2023: Ferrero North America showcased new Kinder Chocolate products at the Sweets & Snacks Expo, signaling further product innovation.
Strategic Confectionery Industry Market Forecast
The confectionery market is poised for continued growth, driven by sustained consumer demand, product innovation, and expansion into new markets. Emerging trends, such as healthier options and sustainable practices, will shape future market dynamics. The forecast period (2025-2033) presents significant opportunities for established and emerging players alike, necessitating strategic planning and adaptation to the changing landscape. The market is expected to surpass $XXX Million by 2033, presenting significant investment potential for stakeholders.
Confectionery Industry Segmentation
-
1. Confections
-
1.1. Chocolate
-
1.1.1. By Confectionery Variant
- 1.1.1.1. Dark Chocolate
- 1.1.1.2. Milk and White Chocolate
-
1.1.1. By Confectionery Variant
-
1.2. Gums
- 1.2.1. Bubble Gum
-
1.2.2. Chewing Gum
-
1.2.2.1. By Sugar Content
- 1.2.2.1.1. Sugar Chewing Gum
- 1.2.2.1.2. Sugar-free Chewing Gum
-
1.2.2.1. By Sugar Content
-
1.3. Snack Bar
- 1.3.1. Cereal Bar
- 1.3.2. Fruit & Nut Bar
- 1.3.3. Protein Bar
-
1.4. Sugar Confectionery
- 1.4.1. Hard Candy
- 1.4.2. Lollipops
- 1.4.3. Mints
- 1.4.4. Pastilles, Gummies, and Jellies
- 1.4.5. Toffees and Nougats
- 1.4.6. Others
-
1.1. Chocolate
-
2. Distribution Channel
- 2.1. Convenience Store
- 2.2. Online Retail Store
- 2.3. Supermarket/Hypermarket
- 2.4. Others
Confectionery Industry Segmentation By Geography
-
1. North America
- 1.1. United States
- 1.2. Canada
- 1.3. Mexico
-
2. South America
- 2.1. Brazil
- 2.2. Argentina
- 2.3. Rest of South America
-
3. Europe
- 3.1. United Kingdom
- 3.2. Germany
- 3.3. France
- 3.4. Italy
- 3.5. Spain
- 3.6. Russia
- 3.7. Benelux
- 3.8. Nordics
- 3.9. Rest of Europe
-
4. Middle East & Africa
- 4.1. Turkey
- 4.2. Israel
- 4.3. GCC
- 4.4. North Africa
- 4.5. South Africa
- 4.6. Rest of Middle East & Africa
-
5. Asia Pacific
- 5.1. China
- 5.2. India
- 5.3. Japan
- 5.4. South Korea
- 5.5. ASEAN
- 5.6. Oceania
- 5.7. Rest of Asia Pacific
Confectionery Industry REPORT HIGHLIGHTS
| Aspects | Details |
|---|---|
| Study Period | 2019-2033 |
| Base Year | 2024 |
| Estimated Year | 2025 |
| Forecast Period | 2025-2033 |
| Historical Period | 2019-2024 |
| Growth Rate | CAGR of 4.69% from 2019-2033 |
| Segmentation |
|
Table of Contents
- 1. Introduction
- 1.1. Research Scope
- 1.2. Market Segmentation
- 1.3. Research Methodology
- 1.4. Definitions and Assumptions
- 2. Executive Summary
- 2.1. Introduction
- 3. Market Dynamics
- 3.1. Introduction
- 3.2. Market Drivers
- 3.2.1. Increased Consumption of Baked Goods; Demand for Indigenous Fermented Foods
- 3.3. Market Restrains
- 3.3.1. Potential Side-effects of Yeast
- 3.4. Market Trends
- 3.4.1. OTHER KEY INDUSTRY TRENDS COVERED IN THE REPORT
- 4. Market Factor Analysis
- 4.1. Porters Five Forces
- 4.2. Supply/Value Chain
- 4.3. PESTEL analysis
- 4.4. Market Entropy
- 4.5. Patent/Trademark Analysis
- 5. Global Confectionery Industry Analysis, Insights and Forecast, 2019-2031
- 5.1. Market Analysis, Insights and Forecast - by Confections
- 5.1.1. Chocolate
- 5.1.1.1. By Confectionery Variant
- 5.1.1.1.1. Dark Chocolate
- 5.1.1.1.2. Milk and White Chocolate
- 5.1.1.1. By Confectionery Variant
- 5.1.2. Gums
- 5.1.2.1. Bubble Gum
- 5.1.2.2. Chewing Gum
- 5.1.2.2.1. By Sugar Content
- 5.1.2.2.1.1. Sugar Chewing Gum
- 5.1.2.2.1.2. Sugar-free Chewing Gum
- 5.1.2.2.1. By Sugar Content
- 5.1.3. Snack Bar
- 5.1.3.1. Cereal Bar
- 5.1.3.2. Fruit & Nut Bar
- 5.1.3.3. Protein Bar
- 5.1.4. Sugar Confectionery
- 5.1.4.1. Hard Candy
- 5.1.4.2. Lollipops
- 5.1.4.3. Mints
- 5.1.4.4. Pastilles, Gummies, and Jellies
- 5.1.4.5. Toffees and Nougats
- 5.1.4.6. Others
- 5.1.1. Chocolate
- 5.2. Market Analysis, Insights and Forecast - by Distribution Channel
- 5.2.1. Convenience Store
- 5.2.2. Online Retail Store
- 5.2.3. Supermarket/Hypermarket
- 5.2.4. Others
- 5.3. Market Analysis, Insights and Forecast - by Region
- 5.3.1. North America
- 5.3.2. South America
- 5.3.3. Europe
- 5.3.4. Middle East & Africa
- 5.3.5. Asia Pacific
- 5.1. Market Analysis, Insights and Forecast - by Confections
- 6. North America Confectionery Industry Analysis, Insights and Forecast, 2019-2031
- 6.1. Market Analysis, Insights and Forecast - by Confections
- 6.1.1. Chocolate
- 6.1.1.1. By Confectionery Variant
- 6.1.1.1.1. Dark Chocolate
- 6.1.1.1.2. Milk and White Chocolate
- 6.1.1.1. By Confectionery Variant
- 6.1.2. Gums
- 6.1.2.1. Bubble Gum
- 6.1.2.2. Chewing Gum
- 6.1.2.2.1. By Sugar Content
- 6.1.2.2.1.1. Sugar Chewing Gum
- 6.1.2.2.1.2. Sugar-free Chewing Gum
- 6.1.2.2.1. By Sugar Content
- 6.1.3. Snack Bar
- 6.1.3.1. Cereal Bar
- 6.1.3.2. Fruit & Nut Bar
- 6.1.3.3. Protein Bar
- 6.1.4. Sugar Confectionery
- 6.1.4.1. Hard Candy
- 6.1.4.2. Lollipops
- 6.1.4.3. Mints
- 6.1.4.4. Pastilles, Gummies, and Jellies
- 6.1.4.5. Toffees and Nougats
- 6.1.4.6. Others
- 6.1.1. Chocolate
- 6.2. Market Analysis, Insights and Forecast - by Distribution Channel
- 6.2.1. Convenience Store
- 6.2.2. Online Retail Store
- 6.2.3. Supermarket/Hypermarket
- 6.2.4. Others
- 6.1. Market Analysis, Insights and Forecast - by Confections
- 7. South America Confectionery Industry Analysis, Insights and Forecast, 2019-2031
- 7.1. Market Analysis, Insights and Forecast - by Confections
- 7.1.1. Chocolate
- 7.1.1.1. By Confectionery Variant
- 7.1.1.1.1. Dark Chocolate
- 7.1.1.1.2. Milk and White Chocolate
- 7.1.1.1. By Confectionery Variant
- 7.1.2. Gums
- 7.1.2.1. Bubble Gum
- 7.1.2.2. Chewing Gum
- 7.1.2.2.1. By Sugar Content
- 7.1.2.2.1.1. Sugar Chewing Gum
- 7.1.2.2.1.2. Sugar-free Chewing Gum
- 7.1.2.2.1. By Sugar Content
- 7.1.3. Snack Bar
- 7.1.3.1. Cereal Bar
- 7.1.3.2. Fruit & Nut Bar
- 7.1.3.3. Protein Bar
- 7.1.4. Sugar Confectionery
- 7.1.4.1. Hard Candy
- 7.1.4.2. Lollipops
- 7.1.4.3. Mints
- 7.1.4.4. Pastilles, Gummies, and Jellies
- 7.1.4.5. Toffees and Nougats
- 7.1.4.6. Others
- 7.1.1. Chocolate
- 7.2. Market Analysis, Insights and Forecast - by Distribution Channel
- 7.2.1. Convenience Store
- 7.2.2. Online Retail Store
- 7.2.3. Supermarket/Hypermarket
- 7.2.4. Others
- 7.1. Market Analysis, Insights and Forecast - by Confections
- 8. Europe Confectionery Industry Analysis, Insights and Forecast, 2019-2031
- 8.1. Market Analysis, Insights and Forecast - by Confections
- 8.1.1. Chocolate
- 8.1.1.1. By Confectionery Variant
- 8.1.1.1.1. Dark Chocolate
- 8.1.1.1.2. Milk and White Chocolate
- 8.1.1.1. By Confectionery Variant
- 8.1.2. Gums
- 8.1.2.1. Bubble Gum
- 8.1.2.2. Chewing Gum
- 8.1.2.2.1. By Sugar Content
- 8.1.2.2.1.1. Sugar Chewing Gum
- 8.1.2.2.1.2. Sugar-free Chewing Gum
- 8.1.2.2.1. By Sugar Content
- 8.1.3. Snack Bar
- 8.1.3.1. Cereal Bar
- 8.1.3.2. Fruit & Nut Bar
- 8.1.3.3. Protein Bar
- 8.1.4. Sugar Confectionery
- 8.1.4.1. Hard Candy
- 8.1.4.2. Lollipops
- 8.1.4.3. Mints
- 8.1.4.4. Pastilles, Gummies, and Jellies
- 8.1.4.5. Toffees and Nougats
- 8.1.4.6. Others
- 8.1.1. Chocolate
- 8.2. Market Analysis, Insights and Forecast - by Distribution Channel
- 8.2.1. Convenience Store
- 8.2.2. Online Retail Store
- 8.2.3. Supermarket/Hypermarket
- 8.2.4. Others
- 8.1. Market Analysis, Insights and Forecast - by Confections
- 9. Middle East & Africa Confectionery Industry Analysis, Insights and Forecast, 2019-2031
- 9.1. Market Analysis, Insights and Forecast - by Confections
- 9.1.1. Chocolate
- 9.1.1.1. By Confectionery Variant
- 9.1.1.1.1. Dark Chocolate
- 9.1.1.1.2. Milk and White Chocolate
- 9.1.1.1. By Confectionery Variant
- 9.1.2. Gums
- 9.1.2.1. Bubble Gum
- 9.1.2.2. Chewing Gum
- 9.1.2.2.1. By Sugar Content
- 9.1.2.2.1.1. Sugar Chewing Gum
- 9.1.2.2.1.2. Sugar-free Chewing Gum
- 9.1.2.2.1. By Sugar Content
- 9.1.3. Snack Bar
- 9.1.3.1. Cereal Bar
- 9.1.3.2. Fruit & Nut Bar
- 9.1.3.3. Protein Bar
- 9.1.4. Sugar Confectionery
- 9.1.4.1. Hard Candy
- 9.1.4.2. Lollipops
- 9.1.4.3. Mints
- 9.1.4.4. Pastilles, Gummies, and Jellies
- 9.1.4.5. Toffees and Nougats
- 9.1.4.6. Others
- 9.1.1. Chocolate
- 9.2. Market Analysis, Insights and Forecast - by Distribution Channel
- 9.2.1. Convenience Store
- 9.2.2. Online Retail Store
- 9.2.3. Supermarket/Hypermarket
- 9.2.4. Others
- 9.1. Market Analysis, Insights and Forecast - by Confections
- 10. Asia Pacific Confectionery Industry Analysis, Insights and Forecast, 2019-2031
- 10.1. Market Analysis, Insights and Forecast - by Confections
- 10.1.1. Chocolate
- 10.1.1.1. By Confectionery Variant
- 10.1.1.1.1. Dark Chocolate
- 10.1.1.1.2. Milk and White Chocolate
- 10.1.1.1. By Confectionery Variant
- 10.1.2. Gums
- 10.1.2.1. Bubble Gum
- 10.1.2.2. Chewing Gum
- 10.1.2.2.1. By Sugar Content
- 10.1.2.2.1.1. Sugar Chewing Gum
- 10.1.2.2.1.2. Sugar-free Chewing Gum
- 10.1.2.2.1. By Sugar Content
- 10.1.3. Snack Bar
- 10.1.3.1. Cereal Bar
- 10.1.3.2. Fruit & Nut Bar
- 10.1.3.3. Protein Bar
- 10.1.4. Sugar Confectionery
- 10.1.4.1. Hard Candy
- 10.1.4.2. Lollipops
- 10.1.4.3. Mints
- 10.1.4.4. Pastilles, Gummies, and Jellies
- 10.1.4.5. Toffees and Nougats
- 10.1.4.6. Others
- 10.1.1. Chocolate
- 10.2. Market Analysis, Insights and Forecast - by Distribution Channel
- 10.2.1. Convenience Store
- 10.2.2. Online Retail Store
- 10.2.3. Supermarket/Hypermarket
- 10.2.4. Others
- 10.1. Market Analysis, Insights and Forecast - by Confections
- 11. North America Confectionery Industry Analysis, Insights and Forecast, 2019-2031
- 11.1. Market Analysis, Insights and Forecast - By Country/Sub-region
- 11.1.1 United States
- 11.1.2 Canada
- 11.1.3 Mexico
- 11.1.4 Rest of North America
- 12. Europe Confectionery Industry Analysis, Insights and Forecast, 2019-2031
- 12.1. Market Analysis, Insights and Forecast - By Country/Sub-region
- 12.1.1 Germany
- 12.1.2 France
- 12.1.3 Italy
- 12.1.4 United Kingdom
- 12.1.5 Netherlands
- 12.1.6 Sweden
- 12.1.7 Rest of Europe
- 13. Asia Pacific Confectionery Industry Analysis, Insights and Forecast, 2019-2031
- 13.1. Market Analysis, Insights and Forecast - By Country/Sub-region
- 13.1.1 China
- 13.1.2 India
- 13.1.3 Japan
- 13.1.4 South Korea
- 13.1.5 Rest of Asia Pacific
- 14. South America Confectionery Industry Analysis, Insights and Forecast, 2019-2031
- 14.1. Market Analysis, Insights and Forecast - By Country/Sub-region
- 14.1.1 Brazil
- 14.1.2 Argentina
- 14.1.3 Rest of South America
- 15. Middle East Confectionery Industry Analysis, Insights and Forecast, 2019-2031
- 15.1. Market Analysis, Insights and Forecast - By Country/Sub-region
- 15.1.1 Middle East
- 15.1.2 Africa
- 16. Competitive Analysis
- 16.1. Global Market Share Analysis 2024
- 16.2. Company Profiles
- 16.2.1 Nestlé SA
- 16.2.1.1. Overview
- 16.2.1.2. Products
- 16.2.1.3. SWOT Analysis
- 16.2.1.4. Recent Developments
- 16.2.1.5. Financials (Based on Availability)
- 16.2.2 Chocoladefabriken Lindt & Sprüngli AG
- 16.2.2.1. Overview
- 16.2.2.2. Products
- 16.2.2.3. SWOT Analysis
- 16.2.2.4. Recent Developments
- 16.2.2.5. Financials (Based on Availability)
- 16.2.3 Perfetti Van Melle BV
- 16.2.3.1. Overview
- 16.2.3.2. Products
- 16.2.3.3. SWOT Analysis
- 16.2.3.4. Recent Developments
- 16.2.3.5. Financials (Based on Availability)
- 16.2.4 General Mills Inc
- 16.2.4.1. Overview
- 16.2.4.2. Products
- 16.2.4.3. SWOT Analysis
- 16.2.4.4. Recent Developments
- 16.2.4.5. Financials (Based on Availability)
- 16.2.5 PepsiCo Inc
- 16.2.5.1. Overview
- 16.2.5.2. Products
- 16.2.5.3. SWOT Analysis
- 16.2.5.4. Recent Developments
- 16.2.5.5. Financials (Based on Availability)
- 16.2.6 August Storck KG
- 16.2.6.1. Overview
- 16.2.6.2. Products
- 16.2.6.3. SWOT Analysis
- 16.2.6.4. Recent Developments
- 16.2.6.5. Financials (Based on Availability)
- 16.2.7 Ferrero International SA
- 16.2.7.1. Overview
- 16.2.7.2. Products
- 16.2.7.3. SWOT Analysis
- 16.2.7.4. Recent Developments
- 16.2.7.5. Financials (Based on Availability)
- 16.2.8 Mars Incorporated
- 16.2.8.1. Overview
- 16.2.8.2. Products
- 16.2.8.3. SWOT Analysis
- 16.2.8.4. Recent Developments
- 16.2.8.5. Financials (Based on Availability)
- 16.2.9 Yıldız Holding A
- 16.2.9.1. Overview
- 16.2.9.2. Products
- 16.2.9.3. SWOT Analysis
- 16.2.9.4. Recent Developments
- 16.2.9.5. Financials (Based on Availability)
- 16.2.10 Lotte Corporation
- 16.2.10.1. Overview
- 16.2.10.2. Products
- 16.2.10.3. SWOT Analysis
- 16.2.10.4. Recent Developments
- 16.2.10.5. Financials (Based on Availability)
- 16.2.11 HARIBO Holding GmbH & Co KG
- 16.2.11.1. Overview
- 16.2.11.2. Products
- 16.2.11.3. SWOT Analysis
- 16.2.11.4. Recent Developments
- 16.2.11.5. Financials (Based on Availability)
- 16.2.12 Mondelēz International Inc
- 16.2.12.1. Overview
- 16.2.12.2. Products
- 16.2.12.3. SWOT Analysis
- 16.2.12.4. Recent Developments
- 16.2.12.5. Financials (Based on Availability)
- 16.2.13 Meiji Holdings Company Ltd
- 16.2.13.1. Overview
- 16.2.13.2. Products
- 16.2.13.3. SWOT Analysis
- 16.2.13.4. Recent Developments
- 16.2.13.5. Financials (Based on Availability)
- 16.2.14 The Hershey Company
- 16.2.14.1. Overview
- 16.2.14.2. Products
- 16.2.14.3. SWOT Analysis
- 16.2.14.4. Recent Developments
- 16.2.14.5. Financials (Based on Availability)
- 16.2.15 Kellogg Company
- 16.2.15.1. Overview
- 16.2.15.2. Products
- 16.2.15.3. SWOT Analysis
- 16.2.15.4. Recent Developments
- 16.2.15.5. Financials (Based on Availability)
- 16.2.1 Nestlé SA
List of Figures
- Figure 1: Global Confectionery Industry Revenue Breakdown (Million, %) by Region 2024 & 2032
- Figure 2: Global Confectionery Industry Volume Breakdown (K Tons, %) by Region 2024 & 2032
- Figure 3: North America Confectionery Industry Revenue (Million), by Country 2024 & 2032
- Figure 4: North America Confectionery Industry Volume (K Tons), by Country 2024 & 2032
- Figure 5: North America Confectionery Industry Revenue Share (%), by Country 2024 & 2032
- Figure 6: North America Confectionery Industry Volume Share (%), by Country 2024 & 2032
- Figure 7: Europe Confectionery Industry Revenue (Million), by Country 2024 & 2032
- Figure 8: Europe Confectionery Industry Volume (K Tons), by Country 2024 & 2032
- Figure 9: Europe Confectionery Industry Revenue Share (%), by Country 2024 & 2032
- Figure 10: Europe Confectionery Industry Volume Share (%), by Country 2024 & 2032
- Figure 11: Asia Pacific Confectionery Industry Revenue (Million), by Country 2024 & 2032
- Figure 12: Asia Pacific Confectionery Industry Volume (K Tons), by Country 2024 & 2032
- Figure 13: Asia Pacific Confectionery Industry Revenue Share (%), by Country 2024 & 2032
- Figure 14: Asia Pacific Confectionery Industry Volume Share (%), by Country 2024 & 2032
- Figure 15: South America Confectionery Industry Revenue (Million), by Country 2024 & 2032
- Figure 16: South America Confectionery Industry Volume (K Tons), by Country 2024 & 2032
- Figure 17: South America Confectionery Industry Revenue Share (%), by Country 2024 & 2032
- Figure 18: South America Confectionery Industry Volume Share (%), by Country 2024 & 2032
- Figure 19: Middle East Confectionery Industry Revenue (Million), by Country 2024 & 2032
- Figure 20: Middle East Confectionery Industry Volume (K Tons), by Country 2024 & 2032
- Figure 21: Middle East Confectionery Industry Revenue Share (%), by Country 2024 & 2032
- Figure 22: Middle East Confectionery Industry Volume Share (%), by Country 2024 & 2032
- Figure 23: North America Confectionery Industry Revenue (Million), by Confections 2024 & 2032
- Figure 24: North America Confectionery Industry Volume (K Tons), by Confections 2024 & 2032
- Figure 25: North America Confectionery Industry Revenue Share (%), by Confections 2024 & 2032
- Figure 26: North America Confectionery Industry Volume Share (%), by Confections 2024 & 2032
- Figure 27: North America Confectionery Industry Revenue (Million), by Distribution Channel 2024 & 2032
- Figure 28: North America Confectionery Industry Volume (K Tons), by Distribution Channel 2024 & 2032
- Figure 29: North America Confectionery Industry Revenue Share (%), by Distribution Channel 2024 & 2032
- Figure 30: North America Confectionery Industry Volume Share (%), by Distribution Channel 2024 & 2032
- Figure 31: North America Confectionery Industry Revenue (Million), by Country 2024 & 2032
- Figure 32: North America Confectionery Industry Volume (K Tons), by Country 2024 & 2032
- Figure 33: North America Confectionery Industry Revenue Share (%), by Country 2024 & 2032
- Figure 34: North America Confectionery Industry Volume Share (%), by Country 2024 & 2032
- Figure 35: South America Confectionery Industry Revenue (Million), by Confections 2024 & 2032
- Figure 36: South America Confectionery Industry Volume (K Tons), by Confections 2024 & 2032
- Figure 37: South America Confectionery Industry Revenue Share (%), by Confections 2024 & 2032
- Figure 38: South America Confectionery Industry Volume Share (%), by Confections 2024 & 2032
- Figure 39: South America Confectionery Industry Revenue (Million), by Distribution Channel 2024 & 2032
- Figure 40: South America Confectionery Industry Volume (K Tons), by Distribution Channel 2024 & 2032
- Figure 41: South America Confectionery Industry Revenue Share (%), by Distribution Channel 2024 & 2032
- Figure 42: South America Confectionery Industry Volume Share (%), by Distribution Channel 2024 & 2032
- Figure 43: South America Confectionery Industry Revenue (Million), by Country 2024 & 2032
- Figure 44: South America Confectionery Industry Volume (K Tons), by Country 2024 & 2032
- Figure 45: South America Confectionery Industry Revenue Share (%), by Country 2024 & 2032
- Figure 46: South America Confectionery Industry Volume Share (%), by Country 2024 & 2032
- Figure 47: Europe Confectionery Industry Revenue (Million), by Confections 2024 & 2032
- Figure 48: Europe Confectionery Industry Volume (K Tons), by Confections 2024 & 2032
- Figure 49: Europe Confectionery Industry Revenue Share (%), by Confections 2024 & 2032
- Figure 50: Europe Confectionery Industry Volume Share (%), by Confections 2024 & 2032
- Figure 51: Europe Confectionery Industry Revenue (Million), by Distribution Channel 2024 & 2032
- Figure 52: Europe Confectionery Industry Volume (K Tons), by Distribution Channel 2024 & 2032
- Figure 53: Europe Confectionery Industry Revenue Share (%), by Distribution Channel 2024 & 2032
- Figure 54: Europe Confectionery Industry Volume Share (%), by Distribution Channel 2024 & 2032
- Figure 55: Europe Confectionery Industry Revenue (Million), by Country 2024 & 2032
- Figure 56: Europe Confectionery Industry Volume (K Tons), by Country 2024 & 2032
- Figure 57: Europe Confectionery Industry Revenue Share (%), by Country 2024 & 2032
- Figure 58: Europe Confectionery Industry Volume Share (%), by Country 2024 & 2032
- Figure 59: Middle East & Africa Confectionery Industry Revenue (Million), by Confections 2024 & 2032
- Figure 60: Middle East & Africa Confectionery Industry Volume (K Tons), by Confections 2024 & 2032
- Figure 61: Middle East & Africa Confectionery Industry Revenue Share (%), by Confections 2024 & 2032
- Figure 62: Middle East & Africa Confectionery Industry Volume Share (%), by Confections 2024 & 2032
- Figure 63: Middle East & Africa Confectionery Industry Revenue (Million), by Distribution Channel 2024 & 2032
- Figure 64: Middle East & Africa Confectionery Industry Volume (K Tons), by Distribution Channel 2024 & 2032
- Figure 65: Middle East & Africa Confectionery Industry Revenue Share (%), by Distribution Channel 2024 & 2032
- Figure 66: Middle East & Africa Confectionery Industry Volume Share (%), by Distribution Channel 2024 & 2032
- Figure 67: Middle East & Africa Confectionery Industry Revenue (Million), by Country 2024 & 2032
- Figure 68: Middle East & Africa Confectionery Industry Volume (K Tons), by Country 2024 & 2032
- Figure 69: Middle East & Africa Confectionery Industry Revenue Share (%), by Country 2024 & 2032
- Figure 70: Middle East & Africa Confectionery Industry Volume Share (%), by Country 2024 & 2032
- Figure 71: Asia Pacific Confectionery Industry Revenue (Million), by Confections 2024 & 2032
- Figure 72: Asia Pacific Confectionery Industry Volume (K Tons), by Confections 2024 & 2032
- Figure 73: Asia Pacific Confectionery Industry Revenue Share (%), by Confections 2024 & 2032
- Figure 74: Asia Pacific Confectionery Industry Volume Share (%), by Confections 2024 & 2032
- Figure 75: Asia Pacific Confectionery Industry Revenue (Million), by Distribution Channel 2024 & 2032
- Figure 76: Asia Pacific Confectionery Industry Volume (K Tons), by Distribution Channel 2024 & 2032
- Figure 77: Asia Pacific Confectionery Industry Revenue Share (%), by Distribution Channel 2024 & 2032
- Figure 78: Asia Pacific Confectionery Industry Volume Share (%), by Distribution Channel 2024 & 2032
- Figure 79: Asia Pacific Confectionery Industry Revenue (Million), by Country 2024 & 2032
- Figure 80: Asia Pacific Confectionery Industry Volume (K Tons), by Country 2024 & 2032
- Figure 81: Asia Pacific Confectionery Industry Revenue Share (%), by Country 2024 & 2032
- Figure 82: Asia Pacific Confectionery Industry Volume Share (%), by Country 2024 & 2032
List of Tables
- Table 1: Global Confectionery Industry Revenue Million Forecast, by Region 2019 & 2032
- Table 2: Global Confectionery Industry Volume K Tons Forecast, by Region 2019 & 2032
- Table 3: Global Confectionery Industry Revenue Million Forecast, by Confections 2019 & 2032
- Table 4: Global Confectionery Industry Volume K Tons Forecast, by Confections 2019 & 2032
- Table 5: Global Confectionery Industry Revenue Million Forecast, by Distribution Channel 2019 & 2032
- Table 6: Global Confectionery Industry Volume K Tons Forecast, by Distribution Channel 2019 & 2032
- Table 7: Global Confectionery Industry Revenue Million Forecast, by Region 2019 & 2032
- Table 8: Global Confectionery Industry Volume K Tons Forecast, by Region 2019 & 2032
- Table 9: Global Confectionery Industry Revenue Million Forecast, by Country 2019 & 2032
- Table 10: Global Confectionery Industry Volume K Tons Forecast, by Country 2019 & 2032
- Table 11: United States Confectionery Industry Revenue (Million) Forecast, by Application 2019 & 2032
- Table 12: United States Confectionery Industry Volume (K Tons) Forecast, by Application 2019 & 2032
- Table 13: Canada Confectionery Industry Revenue (Million) Forecast, by Application 2019 & 2032
- Table 14: Canada Confectionery Industry Volume (K Tons) Forecast, by Application 2019 & 2032
- Table 15: Mexico Confectionery Industry Revenue (Million) Forecast, by Application 2019 & 2032
- Table 16: Mexico Confectionery Industry Volume (K Tons) Forecast, by Application 2019 & 2032
- Table 17: Rest of North America Confectionery Industry Revenue (Million) Forecast, by Application 2019 & 2032
- Table 18: Rest of North America Confectionery Industry Volume (K Tons) Forecast, by Application 2019 & 2032
- Table 19: Global Confectionery Industry Revenue Million Forecast, by Country 2019 & 2032
- Table 20: Global Confectionery Industry Volume K Tons Forecast, by Country 2019 & 2032
- Table 21: Germany Confectionery Industry Revenue (Million) Forecast, by Application 2019 & 2032
- Table 22: Germany Confectionery Industry Volume (K Tons) Forecast, by Application 2019 & 2032
- Table 23: France Confectionery Industry Revenue (Million) Forecast, by Application 2019 & 2032
- Table 24: France Confectionery Industry Volume (K Tons) Forecast, by Application 2019 & 2032
- Table 25: Italy Confectionery Industry Revenue (Million) Forecast, by Application 2019 & 2032
- Table 26: Italy Confectionery Industry Volume (K Tons) Forecast, by Application 2019 & 2032
- Table 27: United Kingdom Confectionery Industry Revenue (Million) Forecast, by Application 2019 & 2032
- Table 28: United Kingdom Confectionery Industry Volume (K Tons) Forecast, by Application 2019 & 2032
- Table 29: Netherlands Confectionery Industry Revenue (Million) Forecast, by Application 2019 & 2032
- Table 30: Netherlands Confectionery Industry Volume (K Tons) Forecast, by Application 2019 & 2032
- Table 31: Sweden Confectionery Industry Revenue (Million) Forecast, by Application 2019 & 2032
- Table 32: Sweden Confectionery Industry Volume (K Tons) Forecast, by Application 2019 & 2032
- Table 33: Rest of Europe Confectionery Industry Revenue (Million) Forecast, by Application 2019 & 2032
- Table 34: Rest of Europe Confectionery Industry Volume (K Tons) Forecast, by Application 2019 & 2032
- Table 35: Global Confectionery Industry Revenue Million Forecast, by Country 2019 & 2032
- Table 36: Global Confectionery Industry Volume K Tons Forecast, by Country 2019 & 2032
- Table 37: China Confectionery Industry Revenue (Million) Forecast, by Application 2019 & 2032
- Table 38: China Confectionery Industry Volume (K Tons) Forecast, by Application 2019 & 2032
- Table 39: India Confectionery Industry Revenue (Million) Forecast, by Application 2019 & 2032
- Table 40: India Confectionery Industry Volume (K Tons) Forecast, by Application 2019 & 2032
- Table 41: Japan Confectionery Industry Revenue (Million) Forecast, by Application 2019 & 2032
- Table 42: Japan Confectionery Industry Volume (K Tons) Forecast, by Application 2019 & 2032
- Table 43: South Korea Confectionery Industry Revenue (Million) Forecast, by Application 2019 & 2032
- Table 44: South Korea Confectionery Industry Volume (K Tons) Forecast, by Application 2019 & 2032
- Table 45: Rest of Asia Pacific Confectionery Industry Revenue (Million) Forecast, by Application 2019 & 2032
- Table 46: Rest of Asia Pacific Confectionery Industry Volume (K Tons) Forecast, by Application 2019 & 2032
- Table 47: Global Confectionery Industry Revenue Million Forecast, by Country 2019 & 2032
- Table 48: Global Confectionery Industry Volume K Tons Forecast, by Country 2019 & 2032
- Table 49: Brazil Confectionery Industry Revenue (Million) Forecast, by Application 2019 & 2032
- Table 50: Brazil Confectionery Industry Volume (K Tons) Forecast, by Application 2019 & 2032
- Table 51: Argentina Confectionery Industry Revenue (Million) Forecast, by Application 2019 & 2032
- Table 52: Argentina Confectionery Industry Volume (K Tons) Forecast, by Application 2019 & 2032
- Table 53: Rest of South America Confectionery Industry Revenue (Million) Forecast, by Application 2019 & 2032
- Table 54: Rest of South America Confectionery Industry Volume (K Tons) Forecast, by Application 2019 & 2032
- Table 55: Global Confectionery Industry Revenue Million Forecast, by Country 2019 & 2032
- Table 56: Global Confectionery Industry Volume K Tons Forecast, by Country 2019 & 2032
- Table 57: Middle East Confectionery Industry Revenue (Million) Forecast, by Application 2019 & 2032
- Table 58: Middle East Confectionery Industry Volume (K Tons) Forecast, by Application 2019 & 2032
- Table 59: Africa Confectionery Industry Revenue (Million) Forecast, by Application 2019 & 2032
- Table 60: Africa Confectionery Industry Volume (K Tons) Forecast, by Application 2019 & 2032
- Table 61: Global Confectionery Industry Revenue Million Forecast, by Confections 2019 & 2032
- Table 62: Global Confectionery Industry Volume K Tons Forecast, by Confections 2019 & 2032
- Table 63: Global Confectionery Industry Revenue Million Forecast, by Distribution Channel 2019 & 2032
- Table 64: Global Confectionery Industry Volume K Tons Forecast, by Distribution Channel 2019 & 2032
- Table 65: Global Confectionery Industry Revenue Million Forecast, by Country 2019 & 2032
- Table 66: Global Confectionery Industry Volume K Tons Forecast, by Country 2019 & 2032
- Table 67: United States Confectionery Industry Revenue (Million) Forecast, by Application 2019 & 2032
- Table 68: United States Confectionery Industry Volume (K Tons) Forecast, by Application 2019 & 2032
- Table 69: Canada Confectionery Industry Revenue (Million) Forecast, by Application 2019 & 2032
- Table 70: Canada Confectionery Industry Volume (K Tons) Forecast, by Application 2019 & 2032
- Table 71: Mexico Confectionery Industry Revenue (Million) Forecast, by Application 2019 & 2032
- Table 72: Mexico Confectionery Industry Volume (K Tons) Forecast, by Application 2019 & 2032
- Table 73: Global Confectionery Industry Revenue Million Forecast, by Confections 2019 & 2032
- Table 74: Global Confectionery Industry Volume K Tons Forecast, by Confections 2019 & 2032
- Table 75: Global Confectionery Industry Revenue Million Forecast, by Distribution Channel 2019 & 2032
- Table 76: Global Confectionery Industry Volume K Tons Forecast, by Distribution Channel 2019 & 2032
- Table 77: Global Confectionery Industry Revenue Million Forecast, by Country 2019 & 2032
- Table 78: Global Confectionery Industry Volume K Tons Forecast, by Country 2019 & 2032
- Table 79: Brazil Confectionery Industry Revenue (Million) Forecast, by Application 2019 & 2032
- Table 80: Brazil Confectionery Industry Volume (K Tons) Forecast, by Application 2019 & 2032
- Table 81: Argentina Confectionery Industry Revenue (Million) Forecast, by Application 2019 & 2032
- Table 82: Argentina Confectionery Industry Volume (K Tons) Forecast, by Application 2019 & 2032
- Table 83: Rest of South America Confectionery Industry Revenue (Million) Forecast, by Application 2019 & 2032
- Table 84: Rest of South America Confectionery Industry Volume (K Tons) Forecast, by Application 2019 & 2032
- Table 85: Global Confectionery Industry Revenue Million Forecast, by Confections 2019 & 2032
- Table 86: Global Confectionery Industry Volume K Tons Forecast, by Confections 2019 & 2032
- Table 87: Global Confectionery Industry Revenue Million Forecast, by Distribution Channel 2019 & 2032
- Table 88: Global Confectionery Industry Volume K Tons Forecast, by Distribution Channel 2019 & 2032
- Table 89: Global Confectionery Industry Revenue Million Forecast, by Country 2019 & 2032
- Table 90: Global Confectionery Industry Volume K Tons Forecast, by Country 2019 & 2032
- Table 91: United Kingdom Confectionery Industry Revenue (Million) Forecast, by Application 2019 & 2032
- Table 92: United Kingdom Confectionery Industry Volume (K Tons) Forecast, by Application 2019 & 2032
- Table 93: Germany Confectionery Industry Revenue (Million) Forecast, by Application 2019 & 2032
- Table 94: Germany Confectionery Industry Volume (K Tons) Forecast, by Application 2019 & 2032
- Table 95: France Confectionery Industry Revenue (Million) Forecast, by Application 2019 & 2032
- Table 96: France Confectionery Industry Volume (K Tons) Forecast, by Application 2019 & 2032
- Table 97: Italy Confectionery Industry Revenue (Million) Forecast, by Application 2019 & 2032
- Table 98: Italy Confectionery Industry Volume (K Tons) Forecast, by Application 2019 & 2032
- Table 99: Spain Confectionery Industry Revenue (Million) Forecast, by Application 2019 & 2032
- Table 100: Spain Confectionery Industry Volume (K Tons) Forecast, by Application 2019 & 2032
- Table 101: Russia Confectionery Industry Revenue (Million) Forecast, by Application 2019 & 2032
- Table 102: Russia Confectionery Industry Volume (K Tons) Forecast, by Application 2019 & 2032
- Table 103: Benelux Confectionery Industry Revenue (Million) Forecast, by Application 2019 & 2032
- Table 104: Benelux Confectionery Industry Volume (K Tons) Forecast, by Application 2019 & 2032
- Table 105: Nordics Confectionery Industry Revenue (Million) Forecast, by Application 2019 & 2032
- Table 106: Nordics Confectionery Industry Volume (K Tons) Forecast, by Application 2019 & 2032
- Table 107: Rest of Europe Confectionery Industry Revenue (Million) Forecast, by Application 2019 & 2032
- Table 108: Rest of Europe Confectionery Industry Volume (K Tons) Forecast, by Application 2019 & 2032
- Table 109: Global Confectionery Industry Revenue Million Forecast, by Confections 2019 & 2032
- Table 110: Global Confectionery Industry Volume K Tons Forecast, by Confections 2019 & 2032
- Table 111: Global Confectionery Industry Revenue Million Forecast, by Distribution Channel 2019 & 2032
- Table 112: Global Confectionery Industry Volume K Tons Forecast, by Distribution Channel 2019 & 2032
- Table 113: Global Confectionery Industry Revenue Million Forecast, by Country 2019 & 2032
- Table 114: Global Confectionery Industry Volume K Tons Forecast, by Country 2019 & 2032
- Table 115: Turkey Confectionery Industry Revenue (Million) Forecast, by Application 2019 & 2032
- Table 116: Turkey Confectionery Industry Volume (K Tons) Forecast, by Application 2019 & 2032
- Table 117: Israel Confectionery Industry Revenue (Million) Forecast, by Application 2019 & 2032
- Table 118: Israel Confectionery Industry Volume (K Tons) Forecast, by Application 2019 & 2032
- Table 119: GCC Confectionery Industry Revenue (Million) Forecast, by Application 2019 & 2032
- Table 120: GCC Confectionery Industry Volume (K Tons) Forecast, by Application 2019 & 2032
- Table 121: North Africa Confectionery Industry Revenue (Million) Forecast, by Application 2019 & 2032
- Table 122: North Africa Confectionery Industry Volume (K Tons) Forecast, by Application 2019 & 2032
- Table 123: South Africa Confectionery Industry Revenue (Million) Forecast, by Application 2019 & 2032
- Table 124: South Africa Confectionery Industry Volume (K Tons) Forecast, by Application 2019 & 2032
- Table 125: Rest of Middle East & Africa Confectionery Industry Revenue (Million) Forecast, by Application 2019 & 2032
- Table 126: Rest of Middle East & Africa Confectionery Industry Volume (K Tons) Forecast, by Application 2019 & 2032
- Table 127: Global Confectionery Industry Revenue Million Forecast, by Confections 2019 & 2032
- Table 128: Global Confectionery Industry Volume K Tons Forecast, by Confections 2019 & 2032
- Table 129: Global Confectionery Industry Revenue Million Forecast, by Distribution Channel 2019 & 2032
- Table 130: Global Confectionery Industry Volume K Tons Forecast, by Distribution Channel 2019 & 2032
- Table 131: Global Confectionery Industry Revenue Million Forecast, by Country 2019 & 2032
- Table 132: Global Confectionery Industry Volume K Tons Forecast, by Country 2019 & 2032
- Table 133: China Confectionery Industry Revenue (Million) Forecast, by Application 2019 & 2032
- Table 134: China Confectionery Industry Volume (K Tons) Forecast, by Application 2019 & 2032
- Table 135: India Confectionery Industry Revenue (Million) Forecast, by Application 2019 & 2032
- Table 136: India Confectionery Industry Volume (K Tons) Forecast, by Application 2019 & 2032
- Table 137: Japan Confectionery Industry Revenue (Million) Forecast, by Application 2019 & 2032
- Table 138: Japan Confectionery Industry Volume (K Tons) Forecast, by Application 2019 & 2032
- Table 139: South Korea Confectionery Industry Revenue (Million) Forecast, by Application 2019 & 2032
- Table 140: South Korea Confectionery Industry Volume (K Tons) Forecast, by Application 2019 & 2032
- Table 141: ASEAN Confectionery Industry Revenue (Million) Forecast, by Application 2019 & 2032
- Table 142: ASEAN Confectionery Industry Volume (K Tons) Forecast, by Application 2019 & 2032
- Table 143: Oceania Confectionery Industry Revenue (Million) Forecast, by Application 2019 & 2032
- Table 144: Oceania Confectionery Industry Volume (K Tons) Forecast, by Application 2019 & 2032
- Table 145: Rest of Asia Pacific Confectionery Industry Revenue (Million) Forecast, by Application 2019 & 2032
- Table 146: Rest of Asia Pacific Confectionery Industry Volume (K Tons) Forecast, by Application 2019 & 2032
Frequently Asked Questions
1. What is the projected Compound Annual Growth Rate (CAGR) of the Confectionery Industry?
The projected CAGR is approximately 4.69%.
2. Which companies are prominent players in the Confectionery Industry?
Key companies in the market include Nestlé SA, Chocoladefabriken Lindt & Sprüngli AG, Perfetti Van Melle BV, General Mills Inc, PepsiCo Inc, August Storck KG, Ferrero International SA, Mars Incorporated, Yıldız Holding A, Lotte Corporation, HARIBO Holding GmbH & Co KG, Mondelēz International Inc, Meiji Holdings Company Ltd, The Hershey Company, Kellogg Company.
3. What are the main segments of the Confectionery Industry?
The market segments include Confections, Distribution Channel.
4. Can you provide details about the market size?
The market size is estimated to be USD 229480 Million as of 2022.
5. What are some drivers contributing to market growth?
Increased Consumption of Baked Goods; Demand for Indigenous Fermented Foods.
6. What are the notable trends driving market growth?
OTHER KEY INDUSTRY TRENDS COVERED IN THE REPORT.
7. Are there any restraints impacting market growth?
Potential Side-effects of Yeast.
8. Can you provide examples of recent developments in the market?
August 2023: Ferrero North America, in the United States, revealed new products and seasonal offerings, including Kinder Chocolate, at the Annual Sweets & Snacks Expo in Chicago.July 2023: HARIBO® officially began gummi production at its first-ever North American manufacturing facility, located in Pleasant Prairie, Wis. The brand-new, state-of-the-art factory was created to meet the growing demand by US consumers of the beloved gummi brand, which produces over 25 varieties of gummi treats in the US and more than 1,200 types globally.July 2023: Ferrero's sister company, Ferrara Candy Co., announced the acquisition of Brazilian snacks company Dori Alimentos, which sells a variety of chocolate and sugar confectionery brands, including Dori, Pettiz, and Jubes.
9. What pricing options are available for accessing the report?
Pricing options include single-user, multi-user, and enterprise licenses priced at USD 3800, USD 4500, and USD 5800 respectively.
10. Is the market size provided in terms of value or volume?
The market size is provided in terms of value, measured in Million and volume, measured in K Tons.
11. Are there any specific market keywords associated with the report?
Yes, the market keyword associated with the report is "Confectionery Industry," which aids in identifying and referencing the specific market segment covered.
12. How do I determine which pricing option suits my needs best?
The pricing options vary based on user requirements and access needs. Individual users may opt for single-user licenses, while businesses requiring broader access may choose multi-user or enterprise licenses for cost-effective access to the report.
13. Are there any additional resources or data provided in the Confectionery Industry report?
While the report offers comprehensive insights, it's advisable to review the specific contents or supplementary materials provided to ascertain if additional resources or data are available.
14. How can I stay updated on further developments or reports in the Confectionery Industry?
To stay informed about further developments, trends, and reports in the Confectionery Industry, consider subscribing to industry newsletters, following relevant companies and organizations, or regularly checking reputable industry news sources and publications.
Methodology
Step 1 - Identification of Relevant Samples Size from Population Database


Step 2 - Approaches for Defining Global Market Size (Value, Volume* & Price*)

Note*: In applicable scenarios
Step 3 - Data Sources
Primary Research
- Web Analytics
- Survey Reports
- Research Institute
- Latest Research Reports
- Opinion Leaders
Secondary Research
- Annual Reports
- White Paper
- Latest Press Release
- Industry Association
- Paid Database
- Investor Presentations

Step 4 - Data Triangulation
Involves using different sources of information in order to increase the validity of a study
These sources are likely to be stakeholders in a program - participants, other researchers, program staff, other community members, and so on.
Then we put all data in single framework & apply various statistical tools to find out the dynamic on the market.
During the analysis stage, feedback from the stakeholder groups would be compared to determine areas of agreement as well as areas of divergence
