

Key Insights
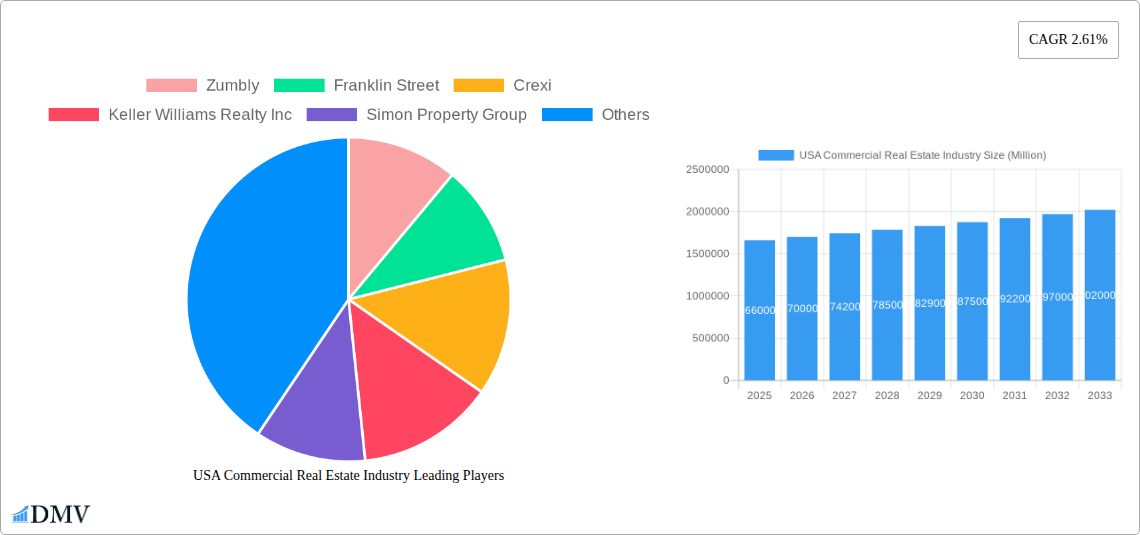
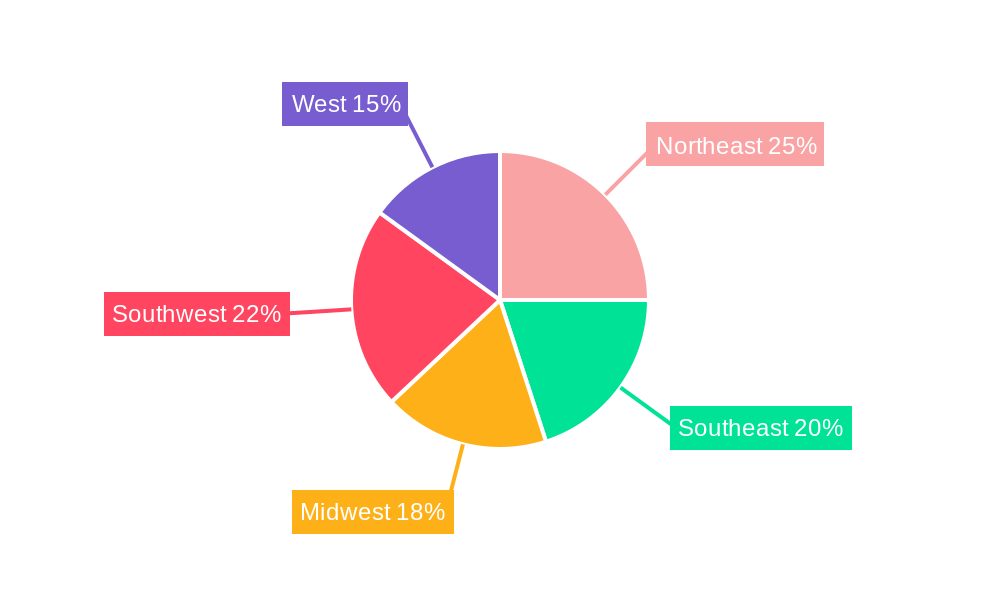
The US commercial real estate (CRE) market, valued at $1.66 trillion in 2025, is projected to experience steady growth, with a compound annual growth rate (CAGR) of 2.61% from 2025 to 2033. This growth is driven by several factors. Strong economic fundamentals, including a robust job market and increasing population density in key urban centers like New York, Los Angeles, and Chicago, fuel demand for office, retail, and multi-family spaces. The expansion of e-commerce and the growing need for efficient logistics networks are boosting the industrial and logistics sectors. Furthermore, the ongoing trend of urbanization and population shifts within the US continue to impact CRE demand across various property types and regions. However, rising interest rates, inflation, and potential economic slowdowns pose significant restraints to market growth, potentially tempering expansion in certain sectors. The market is segmented by property type (offices, retail, industrial, logistics, multi-family, hospitality) and key cities (New York, Chicago, Los Angeles, San Francisco, Boston, Denver, Houston, Phoenix, Atlanta, Salt Lake City), reflecting varying levels of growth potential and vulnerability to economic fluctuations. The competitive landscape includes a mix of large national firms like Keller Williams Realty Inc. and Simon Property Group, along with regional players and specialized boutique firms like Zumbly and John Propp Commercial Group. The regional distribution of CRE assets across the Northeast, Southeast, Midwest, Southwest, and West reflects differing market conditions and investment opportunities.
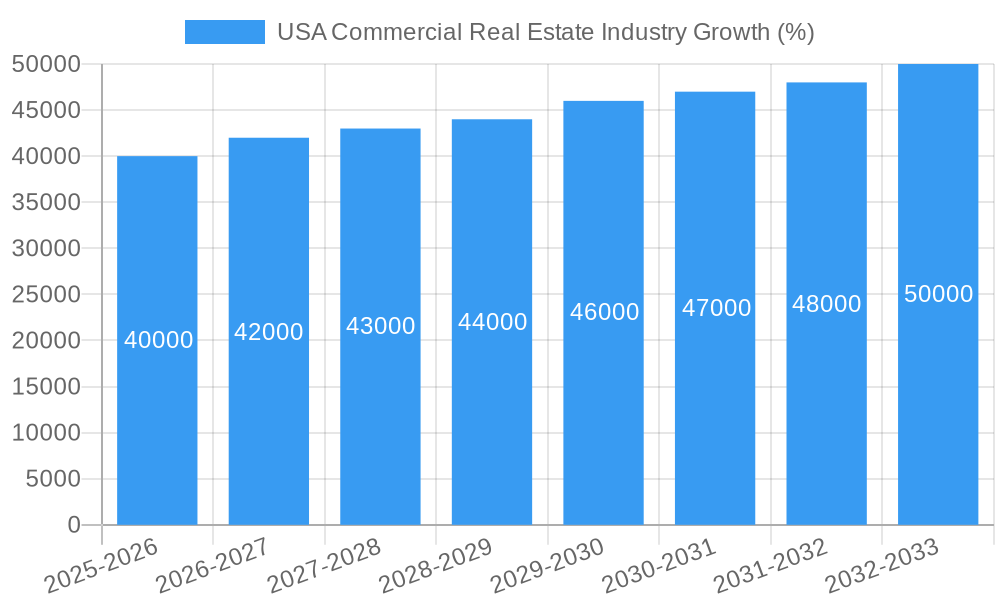
The forecast for 2026-2033 anticipates continued, albeit potentially moderated, expansion. While the overall CAGR remains positive, specific segments may experience varied growth rates depending on economic conditions and evolving market preferences. The industrial and logistics sectors are expected to remain strong, fueled by supply chain optimization and e-commerce growth. However, the office sector might face challenges as remote work arrangements continue to evolve, potentially leading to adjustments in demand and rental rates. The multi-family sector is anticipated to remain relatively resilient, driven by sustained population growth and urbanization. Careful analysis of individual market segments and geographical regions is crucial for informed investment decisions within the dynamic US commercial real estate market. Understanding the interplay of macroeconomic factors, specific sector trends, and localized market dynamics is critical for navigating the complexities of this evolving landscape.
This insightful report provides a comprehensive analysis of the USA Commercial Real Estate Industry, offering a detailed forecast from 2025 to 2033. Leveraging extensive data from 2019 to 2024, this study unveils key market trends, identifies leading players, and highlights future growth opportunities across various segments. The report is crucial for stakeholders seeking to navigate the dynamic landscape of this multi-billion-dollar market. The Base Year is 2025, and the Estimated Year is 2025.
USA Commercial Real Estate Industry Market Composition & Trends
This section analyzes the competitive landscape of the US Commercial Real Estate market, encompassing market concentration, innovation drivers, regulatory frameworks, substitute products, and end-user profiles. We delve into the impact of mergers and acquisitions (M&A), providing insights into deal values and market share distribution. The market size in 2025 is estimated at $xx Million, projected to reach $xx Million by 2033.
- Market Concentration: The US Commercial Real Estate market exhibits a moderately concentrated structure, with a few major players holding significant market share. Smaller, specialized firms often focus on niche segments.
- Innovation Catalysts: PropTech advancements, including AI-driven property management and data analytics, are reshaping the industry. Sustainable building practices and flexible workspace solutions are driving innovation.
- Regulatory Landscape: Zoning regulations, environmental compliance, and tax policies significantly impact market dynamics. Changes in these regulations can create both opportunities and challenges.
- Substitute Products: The rise of co-working spaces and remote work arrangements presents a degree of substitution for traditional office spaces.
- End-User Profiles: The report profiles key end-users, including corporations, institutional investors, and individual investors, highlighting their investment preferences and strategies.
- M&A Activities: The study analyzes M&A activity during the historical period (2019-2024), noting a total deal value of approximately $xx Million across xx transactions. The forecast period anticipates increased M&A activity driven by consolidation and expansion strategies.
USA Commercial Real Estate Industry Industry Evolution
This section examines the evolution of the US Commercial Real Estate market, tracing its growth trajectory, technological advancements, and changing consumer preferences. We analyze the impact of macroeconomic factors, technological disruptions, and evolving end-user needs on market dynamics. The market witnessed a Compound Annual Growth Rate (CAGR) of xx% during the historical period (2019-2024). The forecast period (2025-2033) projects a CAGR of xx%, driven by factors such as increasing urbanization and demand for modern, sustainable commercial spaces. The adoption of PropTech solutions is expected to accelerate significantly, with xx% of commercial properties projected to utilize such technologies by 2033.
Leading Regions, Countries, or Segments in USA Commercial Real Estate Industry
This section identifies the dominant segments and regions within the US Commercial Real Estate market. We analyze key drivers for growth in these areas, focusing on investment trends, regulatory support, and market size.
By Type: The Industrial/Logistics segment is projected to be the fastest-growing sector, driven by e-commerce expansion and supply chain optimization. Multi-family and office spaces maintain substantial market share.
By Key City: New York, Los Angeles, and San Francisco consistently rank among the leading markets due to high population density, strong economic activity, and significant investor interest. However, secondary markets like Atlanta and Denver are also experiencing considerable growth.
Key Drivers:
- Strong Economic Growth: Robust economic activity in key regions fuels demand for commercial real estate.
- Favorable Regulatory Environment: Government incentives and supportive policies encourage investment in specific segments.
- Infrastructure Development: Investments in transportation and other infrastructure enhance the attractiveness of certain locations.
- Technological Advancements: The adoption of smart building technologies increases efficiency and property values.
USA Commercial Real Estate Industry Product Innovations
Recent innovations in the US Commercial Real Estate sector include smart building technologies that optimize energy consumption, security systems incorporating AI, and the rise of flexible workspaces designed to cater to evolving user preferences. These innovations enhance efficiency, sustainability, and tenant satisfaction, creating unique selling propositions and driving demand.
Propelling Factors for USA Commercial Real Estate Industry Growth
Several factors drive the growth of the US Commercial Real Estate market. Technological advancements, such as the adoption of PropTech, are streamlining processes and boosting efficiency. Strong economic growth and rising urbanization contribute to increased demand for commercial spaces. Furthermore, supportive government policies and infrastructure development further fuel market expansion.
Obstacles in the USA Commercial Real Estate Industry Market
The US Commercial Real Estate market faces challenges like stringent regulatory compliance requirements, supply chain disruptions affecting construction projects, and intense competition amongst developers and investors. These factors can impact project timelines and profitability, requiring strategic mitigation.
Future Opportunities in USA Commercial Real Estate Industry
Emerging opportunities include the growth of sustainable and green buildings, increasing demand for flexible workspace solutions, and expansion into secondary markets with high growth potential. Technological advancements, such as the Internet of Things (IoT) and Artificial Intelligence (AI), present opportunities for innovation in property management and tenant experience.
Major Players in the USA Commercial Real Estate Industry Ecosystem
- Zumbly
- Franklin Street
- Crexi
- Keller Williams Realty Inc
- Simon Property Group
- Hightower
- Mohr Partners
- Lamudi
- Coldwell Banker
- ERA Real Estate
- RE/MAX
- John Propp Commercial Group
- HqO
- Century
- Progressive Real Estate Partners
- Shannon-Waltchack
Key Developments in USA Commercial Real Estate Industry Industry
- Jan 2023: Increased adoption of PropTech solutions by major players.
- Mar 2022: Significant M&A activity in the Industrial/Logistics sector.
- June 2021: Launch of several new sustainable building projects in major cities.
- Oct 2020: Regulatory changes impacting zoning and environmental compliance. (Further developments to be included in the full report)
Strategic USA Commercial Real Estate Industry Market Forecast
The US Commercial Real Estate market is poised for continued growth, driven by technological innovation, evolving consumer preferences, and economic expansion. Opportunities exist across various segments and regions, with the Industrial/Logistics sector expected to outperform others. Strategic investments in technology and sustainable practices will be critical for success in this dynamic market.
USA Commercial Real Estate Industry Segmentation
-
1. Type
- 1.1. Offices
- 1.2. Retail
- 1.3. Industrial
- 1.4. Logistics
- 1.5. Multi-family
- 1.6. Hospitality
-
2. Key City
- 2.1. New York
- 2.2. Chicago
- 2.3. Los Angeles
- 2.4. San Francisco
- 2.5. Boston
- 2.6. Denver
- 2.7. Houston
- 2.8. Phoenix
- 2.9. Atlanta
- 2.10. Salt Lake City
USA Commercial Real Estate Industry Segmentation By Geography
-
1. North America
- 1.1. United States
- 1.2. Canada
- 1.3. Mexico
-
2. South America
- 2.1. Brazil
- 2.2. Argentina
- 2.3. Rest of South America
-
3. Europe
- 3.1. United Kingdom
- 3.2. Germany
- 3.3. France
- 3.4. Italy
- 3.5. Spain
- 3.6. Russia
- 3.7. Benelux
- 3.8. Nordics
- 3.9. Rest of Europe
-
4. Middle East & Africa
- 4.1. Turkey
- 4.2. Israel
- 4.3. GCC
- 4.4. North Africa
- 4.5. South Africa
- 4.6. Rest of Middle East & Africa
-
5. Asia Pacific
- 5.1. China
- 5.2. India
- 5.3. Japan
- 5.4. South Korea
- 5.5. ASEAN
- 5.6. Oceania
- 5.7. Rest of Asia Pacific
USA Commercial Real Estate Industry REPORT HIGHLIGHTS
| Aspects | Details |
|---|---|
| Study Period | 2019-2033 |
| Base Year | 2024 |
| Estimated Year | 2025 |
| Forecast Period | 2025-2033 |
| Historical Period | 2019-2024 |
| Growth Rate | CAGR of 2.61% from 2019-2033 |
| Segmentation |
|
Table of Contents
- 1. Introduction
- 1.1. Research Scope
- 1.2. Market Segmentation
- 1.3. Research Methodology
- 1.4. Definitions and Assumptions
- 2. Executive Summary
- 2.1. Introduction
- 3. Market Dynamics
- 3.1. Introduction
- 3.2. Market Drivers
- 3.2.1. Increasing number of startups
- 3.3. Market Restrains
- 3.3.1. Low Awareness and Privacy Issues
- 3.4. Market Trends
- 3.4.1. Industrial Sector Expected to Record High Demand
- 4. Market Factor Analysis
- 4.1. Porters Five Forces
- 4.2. Supply/Value Chain
- 4.3. PESTEL analysis
- 4.4. Market Entropy
- 4.5. Patent/Trademark Analysis
- 5. Global USA Commercial Real Estate Industry Analysis, Insights and Forecast, 2019-2031
- 5.1. Market Analysis, Insights and Forecast - by Type
- 5.1.1. Offices
- 5.1.2. Retail
- 5.1.3. Industrial
- 5.1.4. Logistics
- 5.1.5. Multi-family
- 5.1.6. Hospitality
- 5.2. Market Analysis, Insights and Forecast - by Key City
- 5.2.1. New York
- 5.2.2. Chicago
- 5.2.3. Los Angeles
- 5.2.4. San Francisco
- 5.2.5. Boston
- 5.2.6. Denver
- 5.2.7. Houston
- 5.2.8. Phoenix
- 5.2.9. Atlanta
- 5.2.10. Salt Lake City
- 5.3. Market Analysis, Insights and Forecast - by Region
- 5.3.1. North America
- 5.3.2. South America
- 5.3.3. Europe
- 5.3.4. Middle East & Africa
- 5.3.5. Asia Pacific
- 5.1. Market Analysis, Insights and Forecast - by Type
- 6. North America USA Commercial Real Estate Industry Analysis, Insights and Forecast, 2019-2031
- 6.1. Market Analysis, Insights and Forecast - by Type
- 6.1.1. Offices
- 6.1.2. Retail
- 6.1.3. Industrial
- 6.1.4. Logistics
- 6.1.5. Multi-family
- 6.1.6. Hospitality
- 6.2. Market Analysis, Insights and Forecast - by Key City
- 6.2.1. New York
- 6.2.2. Chicago
- 6.2.3. Los Angeles
- 6.2.4. San Francisco
- 6.2.5. Boston
- 6.2.6. Denver
- 6.2.7. Houston
- 6.2.8. Phoenix
- 6.2.9. Atlanta
- 6.2.10. Salt Lake City
- 6.1. Market Analysis, Insights and Forecast - by Type
- 7. South America USA Commercial Real Estate Industry Analysis, Insights and Forecast, 2019-2031
- 7.1. Market Analysis, Insights and Forecast - by Type
- 7.1.1. Offices
- 7.1.2. Retail
- 7.1.3. Industrial
- 7.1.4. Logistics
- 7.1.5. Multi-family
- 7.1.6. Hospitality
- 7.2. Market Analysis, Insights and Forecast - by Key City
- 7.2.1. New York
- 7.2.2. Chicago
- 7.2.3. Los Angeles
- 7.2.4. San Francisco
- 7.2.5. Boston
- 7.2.6. Denver
- 7.2.7. Houston
- 7.2.8. Phoenix
- 7.2.9. Atlanta
- 7.2.10. Salt Lake City
- 7.1. Market Analysis, Insights and Forecast - by Type
- 8. Europe USA Commercial Real Estate Industry Analysis, Insights and Forecast, 2019-2031
- 8.1. Market Analysis, Insights and Forecast - by Type
- 8.1.1. Offices
- 8.1.2. Retail
- 8.1.3. Industrial
- 8.1.4. Logistics
- 8.1.5. Multi-family
- 8.1.6. Hospitality
- 8.2. Market Analysis, Insights and Forecast - by Key City
- 8.2.1. New York
- 8.2.2. Chicago
- 8.2.3. Los Angeles
- 8.2.4. San Francisco
- 8.2.5. Boston
- 8.2.6. Denver
- 8.2.7. Houston
- 8.2.8. Phoenix
- 8.2.9. Atlanta
- 8.2.10. Salt Lake City
- 8.1. Market Analysis, Insights and Forecast - by Type
- 9. Middle East & Africa USA Commercial Real Estate Industry Analysis, Insights and Forecast, 2019-2031
- 9.1. Market Analysis, Insights and Forecast - by Type
- 9.1.1. Offices
- 9.1.2. Retail
- 9.1.3. Industrial
- 9.1.4. Logistics
- 9.1.5. Multi-family
- 9.1.6. Hospitality
- 9.2. Market Analysis, Insights and Forecast - by Key City
- 9.2.1. New York
- 9.2.2. Chicago
- 9.2.3. Los Angeles
- 9.2.4. San Francisco
- 9.2.5. Boston
- 9.2.6. Denver
- 9.2.7. Houston
- 9.2.8. Phoenix
- 9.2.9. Atlanta
- 9.2.10. Salt Lake City
- 9.1. Market Analysis, Insights and Forecast - by Type
- 10. Asia Pacific USA Commercial Real Estate Industry Analysis, Insights and Forecast, 2019-2031
- 10.1. Market Analysis, Insights and Forecast - by Type
- 10.1.1. Offices
- 10.1.2. Retail
- 10.1.3. Industrial
- 10.1.4. Logistics
- 10.1.5. Multi-family
- 10.1.6. Hospitality
- 10.2. Market Analysis, Insights and Forecast - by Key City
- 10.2.1. New York
- 10.2.2. Chicago
- 10.2.3. Los Angeles
- 10.2.4. San Francisco
- 10.2.5. Boston
- 10.2.6. Denver
- 10.2.7. Houston
- 10.2.8. Phoenix
- 10.2.9. Atlanta
- 10.2.10. Salt Lake City
- 10.1. Market Analysis, Insights and Forecast - by Type
- 11. Northeast USA Commercial Real Estate Industry Analysis, Insights and Forecast, 2019-2031
- 12. Southeast USA Commercial Real Estate Industry Analysis, Insights and Forecast, 2019-2031
- 13. Midwest USA Commercial Real Estate Industry Analysis, Insights and Forecast, 2019-2031
- 14. Southwest USA Commercial Real Estate Industry Analysis, Insights and Forecast, 2019-2031
- 15. West USA Commercial Real Estate Industry Analysis, Insights and Forecast, 2019-2031
- 16. Competitive Analysis
- 16.1. Global Market Share Analysis 2024
- 16.2. Company Profiles
- 16.2.1 Zumbly
- 16.2.1.1. Overview
- 16.2.1.2. Products
- 16.2.1.3. SWOT Analysis
- 16.2.1.4. Recent Developments
- 16.2.1.5. Financials (Based on Availability)
- 16.2.2 Franklin Street
- 16.2.2.1. Overview
- 16.2.2.2. Products
- 16.2.2.3. SWOT Analysis
- 16.2.2.4. Recent Developments
- 16.2.2.5. Financials (Based on Availability)
- 16.2.3 Crexi
- 16.2.3.1. Overview
- 16.2.3.2. Products
- 16.2.3.3. SWOT Analysis
- 16.2.3.4. Recent Developments
- 16.2.3.5. Financials (Based on Availability)
- 16.2.4 Keller Williams Realty Inc
- 16.2.4.1. Overview
- 16.2.4.2. Products
- 16.2.4.3. SWOT Analysis
- 16.2.4.4. Recent Developments
- 16.2.4.5. Financials (Based on Availability)
- 16.2.5 Simon Property Group
- 16.2.5.1. Overview
- 16.2.5.2. Products
- 16.2.5.3. SWOT Analysis
- 16.2.5.4. Recent Developments
- 16.2.5.5. Financials (Based on Availability)
- 16.2.6 Hightower
- 16.2.6.1. Overview
- 16.2.6.2. Products
- 16.2.6.3. SWOT Analysis
- 16.2.6.4. Recent Developments
- 16.2.6.5. Financials (Based on Availability)
- 16.2.7 Mohr Partners
- 16.2.7.1. Overview
- 16.2.7.2. Products
- 16.2.7.3. SWOT Analysis
- 16.2.7.4. Recent Developments
- 16.2.7.5. Financials (Based on Availability)
- 16.2.8 Lamudi
- 16.2.8.1. Overview
- 16.2.8.2. Products
- 16.2.8.3. SWOT Analysis
- 16.2.8.4. Recent Developments
- 16.2.8.5. Financials (Based on Availability)
- 16.2.9 Coldwell Banker
- 16.2.9.1. Overview
- 16.2.9.2. Products
- 16.2.9.3. SWOT Analysis
- 16.2.9.4. Recent Developments
- 16.2.9.5. Financials (Based on Availability)
- 16.2.10 ERA Real Estate
- 16.2.10.1. Overview
- 16.2.10.2. Products
- 16.2.10.3. SWOT Analysis
- 16.2.10.4. Recent Developments
- 16.2.10.5. Financials (Based on Availability)
- 16.2.11 RE/MAX
- 16.2.11.1. Overview
- 16.2.11.2. Products
- 16.2.11.3. SWOT Analysis
- 16.2.11.4. Recent Developments
- 16.2.11.5. Financials (Based on Availability)
- 16.2.12 John Propp Commercial Group
- 16.2.12.1. Overview
- 16.2.12.2. Products
- 16.2.12.3. SWOT Analysis
- 16.2.12.4. Recent Developments
- 16.2.12.5. Financials (Based on Availability)
- 16.2.13 HqO**List Not Exhaustive
- 16.2.13.1. Overview
- 16.2.13.2. Products
- 16.2.13.3. SWOT Analysis
- 16.2.13.4. Recent Developments
- 16.2.13.5. Financials (Based on Availability)
- 16.2.14 Century
- 16.2.14.1. Overview
- 16.2.14.2. Products
- 16.2.14.3. SWOT Analysis
- 16.2.14.4. Recent Developments
- 16.2.14.5. Financials (Based on Availability)
- 16.2.15 Progressive Real Estate Partners
- 16.2.15.1. Overview
- 16.2.15.2. Products
- 16.2.15.3. SWOT Analysis
- 16.2.15.4. Recent Developments
- 16.2.15.5. Financials (Based on Availability)
- 16.2.16 Shannon-Waltchack
- 16.2.16.1. Overview
- 16.2.16.2. Products
- 16.2.16.3. SWOT Analysis
- 16.2.16.4. Recent Developments
- 16.2.16.5. Financials (Based on Availability)
- 16.2.1 Zumbly
List of Figures
- Figure 1: Global USA Commercial Real Estate Industry Revenue Breakdown (Million, %) by Region 2024 & 2032
- Figure 2: United states USA Commercial Real Estate Industry Revenue (Million), by Country 2024 & 2032
- Figure 3: United states USA Commercial Real Estate Industry Revenue Share (%), by Country 2024 & 2032
- Figure 4: North America USA Commercial Real Estate Industry Revenue (Million), by Type 2024 & 2032
- Figure 5: North America USA Commercial Real Estate Industry Revenue Share (%), by Type 2024 & 2032
- Figure 6: North America USA Commercial Real Estate Industry Revenue (Million), by Key City 2024 & 2032
- Figure 7: North America USA Commercial Real Estate Industry Revenue Share (%), by Key City 2024 & 2032
- Figure 8: North America USA Commercial Real Estate Industry Revenue (Million), by Country 2024 & 2032
- Figure 9: North America USA Commercial Real Estate Industry Revenue Share (%), by Country 2024 & 2032
- Figure 10: South America USA Commercial Real Estate Industry Revenue (Million), by Type 2024 & 2032
- Figure 11: South America USA Commercial Real Estate Industry Revenue Share (%), by Type 2024 & 2032
- Figure 12: South America USA Commercial Real Estate Industry Revenue (Million), by Key City 2024 & 2032
- Figure 13: South America USA Commercial Real Estate Industry Revenue Share (%), by Key City 2024 & 2032
- Figure 14: South America USA Commercial Real Estate Industry Revenue (Million), by Country 2024 & 2032
- Figure 15: South America USA Commercial Real Estate Industry Revenue Share (%), by Country 2024 & 2032
- Figure 16: Europe USA Commercial Real Estate Industry Revenue (Million), by Type 2024 & 2032
- Figure 17: Europe USA Commercial Real Estate Industry Revenue Share (%), by Type 2024 & 2032
- Figure 18: Europe USA Commercial Real Estate Industry Revenue (Million), by Key City 2024 & 2032
- Figure 19: Europe USA Commercial Real Estate Industry Revenue Share (%), by Key City 2024 & 2032
- Figure 20: Europe USA Commercial Real Estate Industry Revenue (Million), by Country 2024 & 2032
- Figure 21: Europe USA Commercial Real Estate Industry Revenue Share (%), by Country 2024 & 2032
- Figure 22: Middle East & Africa USA Commercial Real Estate Industry Revenue (Million), by Type 2024 & 2032
- Figure 23: Middle East & Africa USA Commercial Real Estate Industry Revenue Share (%), by Type 2024 & 2032
- Figure 24: Middle East & Africa USA Commercial Real Estate Industry Revenue (Million), by Key City 2024 & 2032
- Figure 25: Middle East & Africa USA Commercial Real Estate Industry Revenue Share (%), by Key City 2024 & 2032
- Figure 26: Middle East & Africa USA Commercial Real Estate Industry Revenue (Million), by Country 2024 & 2032
- Figure 27: Middle East & Africa USA Commercial Real Estate Industry Revenue Share (%), by Country 2024 & 2032
- Figure 28: Asia Pacific USA Commercial Real Estate Industry Revenue (Million), by Type 2024 & 2032
- Figure 29: Asia Pacific USA Commercial Real Estate Industry Revenue Share (%), by Type 2024 & 2032
- Figure 30: Asia Pacific USA Commercial Real Estate Industry Revenue (Million), by Key City 2024 & 2032
- Figure 31: Asia Pacific USA Commercial Real Estate Industry Revenue Share (%), by Key City 2024 & 2032
- Figure 32: Asia Pacific USA Commercial Real Estate Industry Revenue (Million), by Country 2024 & 2032
- Figure 33: Asia Pacific USA Commercial Real Estate Industry Revenue Share (%), by Country 2024 & 2032
List of Tables
- Table 1: Global USA Commercial Real Estate Industry Revenue Million Forecast, by Region 2019 & 2032
- Table 2: Global USA Commercial Real Estate Industry Revenue Million Forecast, by Type 2019 & 2032
- Table 3: Global USA Commercial Real Estate Industry Revenue Million Forecast, by Key City 2019 & 2032
- Table 4: Global USA Commercial Real Estate Industry Revenue Million Forecast, by Region 2019 & 2032
- Table 5: Global USA Commercial Real Estate Industry Revenue Million Forecast, by Country 2019 & 2032
- Table 6: Northeast USA Commercial Real Estate Industry Revenue (Million) Forecast, by Application 2019 & 2032
- Table 7: Southeast USA Commercial Real Estate Industry Revenue (Million) Forecast, by Application 2019 & 2032
- Table 8: Midwest USA Commercial Real Estate Industry Revenue (Million) Forecast, by Application 2019 & 2032
- Table 9: Southwest USA Commercial Real Estate Industry Revenue (Million) Forecast, by Application 2019 & 2032
- Table 10: West USA Commercial Real Estate Industry Revenue (Million) Forecast, by Application 2019 & 2032
- Table 11: Global USA Commercial Real Estate Industry Revenue Million Forecast, by Type 2019 & 2032
- Table 12: Global USA Commercial Real Estate Industry Revenue Million Forecast, by Key City 2019 & 2032
- Table 13: Global USA Commercial Real Estate Industry Revenue Million Forecast, by Country 2019 & 2032
- Table 14: United States USA Commercial Real Estate Industry Revenue (Million) Forecast, by Application 2019 & 2032
- Table 15: Canada USA Commercial Real Estate Industry Revenue (Million) Forecast, by Application 2019 & 2032
- Table 16: Mexico USA Commercial Real Estate Industry Revenue (Million) Forecast, by Application 2019 & 2032
- Table 17: Global USA Commercial Real Estate Industry Revenue Million Forecast, by Type 2019 & 2032
- Table 18: Global USA Commercial Real Estate Industry Revenue Million Forecast, by Key City 2019 & 2032
- Table 19: Global USA Commercial Real Estate Industry Revenue Million Forecast, by Country 2019 & 2032
- Table 20: Brazil USA Commercial Real Estate Industry Revenue (Million) Forecast, by Application 2019 & 2032
- Table 21: Argentina USA Commercial Real Estate Industry Revenue (Million) Forecast, by Application 2019 & 2032
- Table 22: Rest of South America USA Commercial Real Estate Industry Revenue (Million) Forecast, by Application 2019 & 2032
- Table 23: Global USA Commercial Real Estate Industry Revenue Million Forecast, by Type 2019 & 2032
- Table 24: Global USA Commercial Real Estate Industry Revenue Million Forecast, by Key City 2019 & 2032
- Table 25: Global USA Commercial Real Estate Industry Revenue Million Forecast, by Country 2019 & 2032
- Table 26: United Kingdom USA Commercial Real Estate Industry Revenue (Million) Forecast, by Application 2019 & 2032
- Table 27: Germany USA Commercial Real Estate Industry Revenue (Million) Forecast, by Application 2019 & 2032
- Table 28: France USA Commercial Real Estate Industry Revenue (Million) Forecast, by Application 2019 & 2032
- Table 29: Italy USA Commercial Real Estate Industry Revenue (Million) Forecast, by Application 2019 & 2032
- Table 30: Spain USA Commercial Real Estate Industry Revenue (Million) Forecast, by Application 2019 & 2032
- Table 31: Russia USA Commercial Real Estate Industry Revenue (Million) Forecast, by Application 2019 & 2032
- Table 32: Benelux USA Commercial Real Estate Industry Revenue (Million) Forecast, by Application 2019 & 2032
- Table 33: Nordics USA Commercial Real Estate Industry Revenue (Million) Forecast, by Application 2019 & 2032
- Table 34: Rest of Europe USA Commercial Real Estate Industry Revenue (Million) Forecast, by Application 2019 & 2032
- Table 35: Global USA Commercial Real Estate Industry Revenue Million Forecast, by Type 2019 & 2032
- Table 36: Global USA Commercial Real Estate Industry Revenue Million Forecast, by Key City 2019 & 2032
- Table 37: Global USA Commercial Real Estate Industry Revenue Million Forecast, by Country 2019 & 2032
- Table 38: Turkey USA Commercial Real Estate Industry Revenue (Million) Forecast, by Application 2019 & 2032
- Table 39: Israel USA Commercial Real Estate Industry Revenue (Million) Forecast, by Application 2019 & 2032
- Table 40: GCC USA Commercial Real Estate Industry Revenue (Million) Forecast, by Application 2019 & 2032
- Table 41: North Africa USA Commercial Real Estate Industry Revenue (Million) Forecast, by Application 2019 & 2032
- Table 42: South Africa USA Commercial Real Estate Industry Revenue (Million) Forecast, by Application 2019 & 2032
- Table 43: Rest of Middle East & Africa USA Commercial Real Estate Industry Revenue (Million) Forecast, by Application 2019 & 2032
- Table 44: Global USA Commercial Real Estate Industry Revenue Million Forecast, by Type 2019 & 2032
- Table 45: Global USA Commercial Real Estate Industry Revenue Million Forecast, by Key City 2019 & 2032
- Table 46: Global USA Commercial Real Estate Industry Revenue Million Forecast, by Country 2019 & 2032
- Table 47: China USA Commercial Real Estate Industry Revenue (Million) Forecast, by Application 2019 & 2032
- Table 48: India USA Commercial Real Estate Industry Revenue (Million) Forecast, by Application 2019 & 2032
- Table 49: Japan USA Commercial Real Estate Industry Revenue (Million) Forecast, by Application 2019 & 2032
- Table 50: South Korea USA Commercial Real Estate Industry Revenue (Million) Forecast, by Application 2019 & 2032
- Table 51: ASEAN USA Commercial Real Estate Industry Revenue (Million) Forecast, by Application 2019 & 2032
- Table 52: Oceania USA Commercial Real Estate Industry Revenue (Million) Forecast, by Application 2019 & 2032
- Table 53: Rest of Asia Pacific USA Commercial Real Estate Industry Revenue (Million) Forecast, by Application 2019 & 2032
Frequently Asked Questions
1. What is the projected Compound Annual Growth Rate (CAGR) of the USA Commercial Real Estate Industry?
The projected CAGR is approximately 2.61%.
2. Which companies are prominent players in the USA Commercial Real Estate Industry?
Key companies in the market include Zumbly, Franklin Street, Crexi, Keller Williams Realty Inc, Simon Property Group, Hightower, Mohr Partners, Lamudi, Coldwell Banker, ERA Real Estate, RE/MAX, John Propp Commercial Group, HqO**List Not Exhaustive, Century, Progressive Real Estate Partners, Shannon-Waltchack.
3. What are the main segments of the USA Commercial Real Estate Industry?
The market segments include Type, Key City.
4. Can you provide details about the market size?
The market size is estimated to be USD 1.66 Million as of 2022.
5. What are some drivers contributing to market growth?
Increasing number of startups.
6. What are the notable trends driving market growth?
Industrial Sector Expected to Record High Demand.
7. Are there any restraints impacting market growth?
Low Awareness and Privacy Issues.
8. Can you provide examples of recent developments in the market?
N/A
9. What pricing options are available for accessing the report?
Pricing options include single-user, multi-user, and enterprise licenses priced at USD 3800, USD 4500, and USD 5800 respectively.
10. Is the market size provided in terms of value or volume?
The market size is provided in terms of value, measured in Million.
11. Are there any specific market keywords associated with the report?
Yes, the market keyword associated with the report is "USA Commercial Real Estate Industry," which aids in identifying and referencing the specific market segment covered.
12. How do I determine which pricing option suits my needs best?
The pricing options vary based on user requirements and access needs. Individual users may opt for single-user licenses, while businesses requiring broader access may choose multi-user or enterprise licenses for cost-effective access to the report.
13. Are there any additional resources or data provided in the USA Commercial Real Estate Industry report?
While the report offers comprehensive insights, it's advisable to review the specific contents or supplementary materials provided to ascertain if additional resources or data are available.
14. How can I stay updated on further developments or reports in the USA Commercial Real Estate Industry?
To stay informed about further developments, trends, and reports in the USA Commercial Real Estate Industry, consider subscribing to industry newsletters, following relevant companies and organizations, or regularly checking reputable industry news sources and publications.
Methodology
Step 1 - Identification of Relevant Samples Size from Population Database


Step 2 - Approaches for Defining Global Market Size (Value, Volume* & Price*)

Note*: In applicable scenarios
Step 3 - Data Sources
Primary Research
- Web Analytics
- Survey Reports
- Research Institute
- Latest Research Reports
- Opinion Leaders
Secondary Research
- Annual Reports
- White Paper
- Latest Press Release
- Industry Association
- Paid Database
- Investor Presentations

Step 4 - Data Triangulation
Involves using different sources of information in order to increase the validity of a study
These sources are likely to be stakeholders in a program - participants, other researchers, program staff, other community members, and so on.
Then we put all data in single framework & apply various statistical tools to find out the dynamic on the market.
During the analysis stage, feedback from the stakeholder groups would be compared to determine areas of agreement as well as areas of divergence
