

Key Insights
The US residential smart meters market is experiencing robust growth, driven by increasing energy efficiency concerns, government mandates for grid modernization, and the rising adoption of smart home technologies. The market's expansion is fueled by the ability of smart meters to provide real-time energy consumption data, enabling consumers to better manage their energy usage and reduce bills. This granular data also empowers utility companies to optimize grid management, improve outage detection and response, and implement demand-response programs, ultimately enhancing grid reliability and efficiency. While the initial investment in infrastructure presents a barrier to entry for some consumers and utilities, the long-term benefits of reduced energy consumption and improved grid stability outweigh the upfront costs. Technological advancements, particularly in wireless communication technologies like cellular and advanced metering infrastructure (AMI), are contributing significantly to market growth. These technologies are enabling more efficient and cost-effective smart meter deployments and data transmission compared to traditional wired systems. The market is segmented by meter type (electric and gas), communication technology (wireless and wired), and application (energy monitoring, outage management, and demand response). Electric smart meters currently dominate the market share, but gas smart meter adoption is expected to grow steadily.
The forecast period (2025-2033) anticipates continued market expansion, driven primarily by the increasing penetration of smart homes and the expanding need for advanced grid management capabilities. Growth will be further propelled by technological innovation, including the integration of smart meters with other smart home devices and the development of more sophisticated data analytics platforms. The competitive landscape comprises both established players like Itron, Honeywell, and Landis+GYR, and newer entrants leveraging technological advancements to gain market share. Despite the strong growth trajectory, factors such as high initial deployment costs and potential cybersecurity concerns remain challenges that the market needs to address to sustain its momentum. However, ongoing government support and incentives, along with the increasing awareness of the benefits of smart meters among consumers, are expected to mitigate these challenges and ensure continued market expansion.
US Residential Smart Meters Market: A Comprehensive Report (2019-2033)
This insightful report provides a detailed analysis of the US Residential Smart Meters Market, offering a comprehensive overview of market dynamics, growth drivers, challenges, and future opportunities. Spanning the period from 2019 to 2033, with a focus on 2025 as the base and estimated year, this report is an essential resource for stakeholders seeking to understand and capitalize on this rapidly evolving market. The US Residential Smart Meters Market is projected to reach xx Million by 2033, exhibiting a robust Compound Annual Growth Rate (CAGR) of xx% during the forecast period (2025-2033).
US Residential Smart Meters Market Composition & Trends
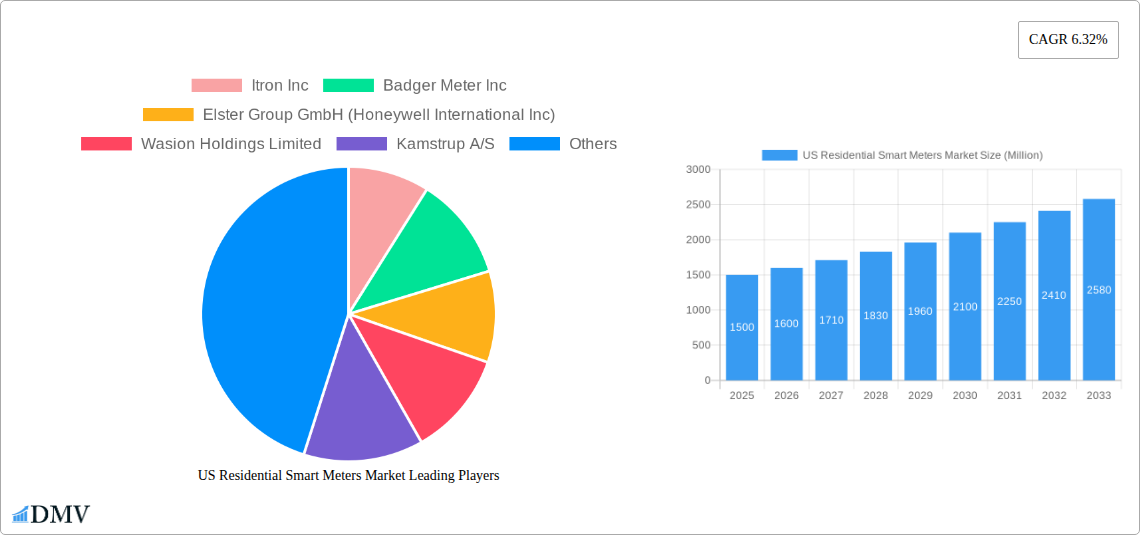
The US residential smart meters market is characterized by a moderately concentrated landscape, with several key players vying for market share. Market concentration is influenced by factors such as technological advancements, regulatory changes, and the scale of deployment projects. Innovation is driven by the need for improved energy efficiency, enhanced grid management, and advanced metering infrastructure (AMI). Stringent regulatory frameworks, including those focused on energy conservation and grid modernization, significantly influence market growth. Substitute products, such as traditional electromechanical meters, are gradually being phased out due to their limitations in data collection and management. The end-user profile encompasses residential consumers, utility companies, and energy management service providers. Mergers and acquisitions (M&A) activity has been moderate, with deal values averaging xx Million in recent years. Key M&A activities include [insert specific examples of M&A deals with deal values if available, otherwise state "Data unavailable"].
- Market Share Distribution (2024): Itron Inc. (xx%), Badger Meter Inc. (xx%), Elster Group GmbH (xx%), Others (xx%). (Note: Exact figures unavailable, estimated based on available data).
- Average M&A Deal Value (2019-2024): xx Million.
US Residential Smart Meters Market Industry Evolution
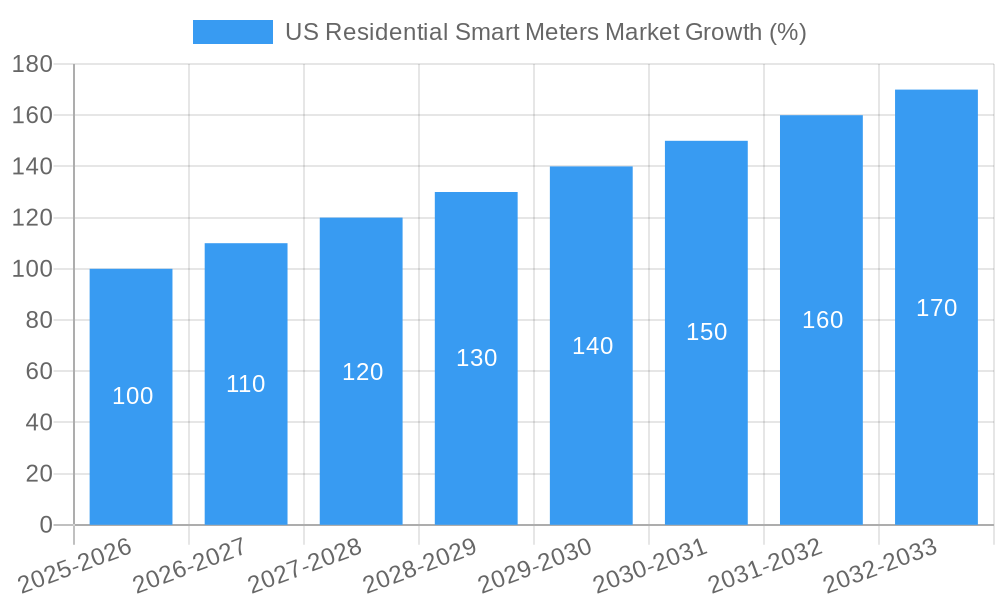
The US residential smart meters market has witnessed significant growth during the historical period (2019-2024), driven by increasing demand for energy efficiency, improved grid management, and the rising adoption of smart home technologies. This growth trajectory is anticipated to continue throughout the forecast period (2025-2033), fueled by technological advancements in communication technologies (e.g., narrowband IoT, cellular), data analytics capabilities, and the expansion of AMI networks. Consumer demand for real-time energy monitoring, personalized energy management tools, and reduced energy bills further accelerates market growth. Adoption rates for smart meters have been steadily increasing, with xx% of US households estimated to have adopted smart meters by 2024. The market is also witnessing a shift towards advanced functionalities, such as integration with renewable energy sources, demand response programs, and enhanced cybersecurity features. The average annual growth rate for smart meter adoption from 2019 to 2024 was xx%, and projections indicate a xx% growth rate from 2025 to 2033. This growth is influenced by both government incentives and the increasing desire for consumers to have greater control over their energy consumption.
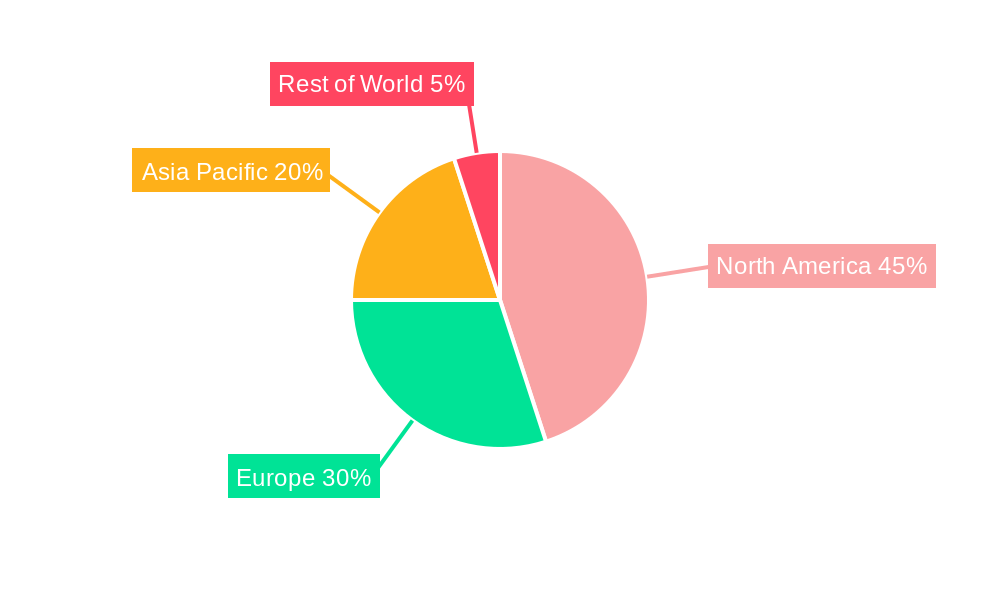
Leading Regions, Countries, or Segments in US Residential Smart Meters Market
Dominant Segment: The electric smart meter segment holds the largest market share, driven by the widespread adoption of electricity smart meters in residential areas across the US.
Key Drivers for Electric Smart Meters:
- Extensive government support through funding programs and incentive schemes promoting smart grid modernization.
- Rising energy costs and increasing consumer awareness of energy efficiency measures.
- Technological advancements improving meter accuracy and data transmission reliability.
Dominant Technology: Wireless smart meters lead the market, favored for their ease of installation, scalability, and cost-effectiveness compared to wired alternatives.
Key Drivers for Wireless Smart Meters:
- Improved network coverage and advancements in low-power wide-area networks (LPWAN) technologies.
- Decreasing hardware and communication costs.
- Government initiatives aimed at promoting the deployment of advanced metering infrastructure (AMI).
Dominant Application: Energy monitoring remains the dominant application, offering consumers valuable insights into their energy usage patterns and enabling informed decision-making regarding consumption habits.
Key Drivers for Energy Monitoring:
- Enhanced consumer awareness of energy costs and sustainable practices.
- Growing availability of energy management tools and mobile applications.
- Integration with smart home platforms and energy efficiency programs.
The report further details the market share of other segments including gas smart meters, wired smart meters, and applications like outage management and demand response programs. Geographic variations in market penetration and adoption rates are also analyzed based on factors such as grid infrastructure, regulatory policies, and consumer preferences.
US Residential Smart Meters Market Product Innovations
Recent innovations focus on improving energy efficiency, enhancing data security, and integrating with broader smart home ecosystems. Advancements include enhanced communication protocols, improved data analytics capabilities, and the integration of artificial intelligence (AI) for predictive maintenance and improved grid management. These innovations translate into enhanced customer experience, more accurate billing, and reduced operational costs for utility companies. Unique selling propositions are centered around superior data accuracy, reliability, and reduced energy losses, resulting in cost savings for both consumers and utilities.
Propelling Factors for US Residential Smart Meters Market Growth
The market is fueled by several key drivers. Technological advancements, including the development of low-power wide-area network (LPWAN) technologies and improved data analytics capabilities, enable more efficient and cost-effective deployment of smart meters. Government regulations mandating the adoption of smart meters in certain areas, combined with incentives and rebates aimed at encouraging energy conservation, further boost market expansion. The increasing consumer preference for real-time energy monitoring and smart home integration also contributes to growth. Furthermore, the growing concerns regarding climate change and the need to enhance grid resilience are significant factors promoting the market's expansion.
Obstacles in the US Residential Smart Meters Market
Despite considerable growth potential, the market faces certain challenges. High initial investment costs associated with smart meter deployment and infrastructure upgrades can deter some utility companies and consumers. Concerns about data security and privacy are also significant obstacles, requiring robust security measures to address potential vulnerabilities. The complexity of integrating smart meters into existing grid infrastructure may pose deployment obstacles. Furthermore, supply chain disruptions and the increasing cost of components pose a threat to timely project completion and overall market growth. These factors, if not carefully managed, may impact the projected growth rate by xx% in the coming years.
Future Opportunities in US Residential Smart Meters Market
The future presents significant opportunities for growth. Expansion into underserved areas with limited smart meter penetration offers considerable potential. The integration of smart meters with renewable energy sources, smart grids, and energy storage systems will open new avenues for market expansion. Advancements in artificial intelligence (AI) and machine learning (ML) offer opportunities to develop more sophisticated energy management and predictive maintenance solutions. The increasing adoption of smart home technologies further creates synergistic opportunities to offer bundled solutions and enhanced user experiences.
Major Players in the US Residential Smart Meters Market Ecosystem
- Itron Inc.
- Badger Meter Inc.
- Elster Group GmbH (Honeywell International Inc.)
- Wasion Holdings Limited
- Kamstrup A/S
- Neptune Technology Group Inc
- Sensus USA Inc (Xylem Inc)
- Aclara Technologies Inc (Hubbel Inc)
- Landis+GYR Group AG
- General Electric Company
- Diehl Metering U S
- Mueller Systems LLC
Key Developments in US Residential Smart Meters Market Industry
- September 2023: Southwestern Electric Power Co. announced the installation of smart meters for approximately 234,000 Louisiana customers, impacting market growth through increased deployment activity.
- August 2023: Rankin Road West MUD partnered with WasteWater Management Services and Accurate Meter to implement smart water meters, highlighting market expansion beyond electricity and gas.
Strategic US Residential Smart Meters Market Forecast
The US residential smart meters market is poised for continued strong growth, driven by the ongoing modernization of the energy grid, increasing consumer demand for energy efficiency and smart home solutions, and supportive government policies. Future opportunities lie in the expansion of smart meter applications beyond basic energy monitoring, including integration with renewable energy systems, demand-side management programs, and advanced analytics for grid optimization. The market is expected to experience sustained growth, with substantial opportunities for market participants who can adapt to evolving consumer preferences and technological advancements. The projected CAGR of xx% reflects this positive outlook.
US Residential Smart Meters Market Segmentation
-
1. Type
- 1.1. Electric smart meters
- 1.2. Gas smart meters
- 1.3. Communication
-
2. Technology
- 2.1. Wireless smart meters
- 2.2. Wired smart meters
-
3. Application
- 3.1. Energy monitoring
- 3.2. Outage management
- 3.3. Demand response
US Residential Smart Meters Market Segmentation By Geography
-
1. North America
- 1.1. United States
- 1.2. Canada
- 1.3. Mexico
-
2. South America
- 2.1. Brazil
- 2.2. Argentina
- 2.3. Rest of South America
-
3. Europe
- 3.1. United Kingdom
- 3.2. Germany
- 3.3. France
- 3.4. Italy
- 3.5. Spain
- 3.6. Russia
- 3.7. Benelux
- 3.8. Nordics
- 3.9. Rest of Europe
-
4. Middle East & Africa
- 4.1. Turkey
- 4.2. Israel
- 4.3. GCC
- 4.4. North Africa
- 4.5. South Africa
- 4.6. Rest of Middle East & Africa
-
5. Asia Pacific
- 5.1. China
- 5.2. India
- 5.3. Japan
- 5.4. South Korea
- 5.5. ASEAN
- 5.6. Oceania
- 5.7. Rest of Asia Pacific
US Residential Smart Meters Market REPORT HIGHLIGHTS
| Aspects | Details |
|---|---|
| Study Period | 2019-2033 |
| Base Year | 2024 |
| Estimated Year | 2025 |
| Forecast Period | 2025-2033 |
| Historical Period | 2019-2024 |
| Growth Rate | CAGR of 6.32% from 2019-2033 |
| Segmentation |
|
Table of Contents
- 1. Introduction
- 1.1. Research Scope
- 1.2. Market Segmentation
- 1.3. Research Methodology
- 1.4. Definitions and Assumptions
- 2. Executive Summary
- 2.1. Introduction
- 3. Market Dynamics
- 3.1. Introduction
- 3.2. Market Drivers
- 3.2.1. Increased Investments in Smart Grid Projects; Growth in Smart City Deployment
- 3.3. Market Restrains
- 3.3.1. High Installation Cost and Longer ROI Period; Longer Replacement Cycle of Water Meters
- 3.4. Market Trends
- 3.4.1. Increased Investments in Smart Grid Projects to Drive the Market
- 4. Market Factor Analysis
- 4.1. Porters Five Forces
- 4.2. Supply/Value Chain
- 4.3. PESTEL analysis
- 4.4. Market Entropy
- 4.5. Patent/Trademark Analysis
- 5. Global US Residential Smart Meters Market Analysis, Insights and Forecast, 2019-2031
- 5.1. Market Analysis, Insights and Forecast - by Type
- 5.1.1. Electric smart meters
- 5.1.2. Gas smart meters
- 5.1.3. Communication
- 5.2. Market Analysis, Insights and Forecast - by Technology
- 5.2.1. Wireless smart meters
- 5.2.2. Wired smart meters
- 5.3. Market Analysis, Insights and Forecast - by Application
- 5.3.1. Energy monitoring
- 5.3.2. Outage management
- 5.3.3. Demand response
- 5.4. Market Analysis, Insights and Forecast - by Region
- 5.4.1. North America
- 5.4.2. South America
- 5.4.3. Europe
- 5.4.4. Middle East & Africa
- 5.4.5. Asia Pacific
- 5.1. Market Analysis, Insights and Forecast - by Type
- 6. North America US Residential Smart Meters Market Analysis, Insights and Forecast, 2019-2031
- 6.1. Market Analysis, Insights and Forecast - by Type
- 6.1.1. Electric smart meters
- 6.1.2. Gas smart meters
- 6.1.3. Communication
- 6.2. Market Analysis, Insights and Forecast - by Technology
- 6.2.1. Wireless smart meters
- 6.2.2. Wired smart meters
- 6.3. Market Analysis, Insights and Forecast - by Application
- 6.3.1. Energy monitoring
- 6.3.2. Outage management
- 6.3.3. Demand response
- 6.1. Market Analysis, Insights and Forecast - by Type
- 7. South America US Residential Smart Meters Market Analysis, Insights and Forecast, 2019-2031
- 7.1. Market Analysis, Insights and Forecast - by Type
- 7.1.1. Electric smart meters
- 7.1.2. Gas smart meters
- 7.1.3. Communication
- 7.2. Market Analysis, Insights and Forecast - by Technology
- 7.2.1. Wireless smart meters
- 7.2.2. Wired smart meters
- 7.3. Market Analysis, Insights and Forecast - by Application
- 7.3.1. Energy monitoring
- 7.3.2. Outage management
- 7.3.3. Demand response
- 7.1. Market Analysis, Insights and Forecast - by Type
- 8. Europe US Residential Smart Meters Market Analysis, Insights and Forecast, 2019-2031
- 8.1. Market Analysis, Insights and Forecast - by Type
- 8.1.1. Electric smart meters
- 8.1.2. Gas smart meters
- 8.1.3. Communication
- 8.2. Market Analysis, Insights and Forecast - by Technology
- 8.2.1. Wireless smart meters
- 8.2.2. Wired smart meters
- 8.3. Market Analysis, Insights and Forecast - by Application
- 8.3.1. Energy monitoring
- 8.3.2. Outage management
- 8.3.3. Demand response
- 8.1. Market Analysis, Insights and Forecast - by Type
- 9. Middle East & Africa US Residential Smart Meters Market Analysis, Insights and Forecast, 2019-2031
- 9.1. Market Analysis, Insights and Forecast - by Type
- 9.1.1. Electric smart meters
- 9.1.2. Gas smart meters
- 9.1.3. Communication
- 9.2. Market Analysis, Insights and Forecast - by Technology
- 9.2.1. Wireless smart meters
- 9.2.2. Wired smart meters
- 9.3. Market Analysis, Insights and Forecast - by Application
- 9.3.1. Energy monitoring
- 9.3.2. Outage management
- 9.3.3. Demand response
- 9.1. Market Analysis, Insights and Forecast - by Type
- 10. Asia Pacific US Residential Smart Meters Market Analysis, Insights and Forecast, 2019-2031
- 10.1. Market Analysis, Insights and Forecast - by Type
- 10.1.1. Electric smart meters
- 10.1.2. Gas smart meters
- 10.1.3. Communication
- 10.2. Market Analysis, Insights and Forecast - by Technology
- 10.2.1. Wireless smart meters
- 10.2.2. Wired smart meters
- 10.3. Market Analysis, Insights and Forecast - by Application
- 10.3.1. Energy monitoring
- 10.3.2. Outage management
- 10.3.3. Demand response
- 10.1. Market Analysis, Insights and Forecast - by Type
- 11. United States US Residential Smart Meters Market Analysis, Insights and Forecast, 2019-2031
- 12. Canada US Residential Smart Meters Market Analysis, Insights and Forecast, 2019-2031
- 13. Mexico US Residential Smart Meters Market Analysis, Insights and Forecast, 2019-2031
- 14. Competitive Analysis
- 14.1. Global Market Share Analysis 2024
- 14.2. Company Profiles
- 14.2.1 Itron Inc
- 14.2.1.1. Overview
- 14.2.1.2. Products
- 14.2.1.3. SWOT Analysis
- 14.2.1.4. Recent Developments
- 14.2.1.5. Financials (Based on Availability)
- 14.2.2 Badger Meter Inc
- 14.2.2.1. Overview
- 14.2.2.2. Products
- 14.2.2.3. SWOT Analysis
- 14.2.2.4. Recent Developments
- 14.2.2.5. Financials (Based on Availability)
- 14.2.3 Elster Group GmbH (Honeywell International Inc)
- 14.2.3.1. Overview
- 14.2.3.2. Products
- 14.2.3.3. SWOT Analysis
- 14.2.3.4. Recent Developments
- 14.2.3.5. Financials (Based on Availability)
- 14.2.4 Wasion Holdings Limited
- 14.2.4.1. Overview
- 14.2.4.2. Products
- 14.2.4.3. SWOT Analysis
- 14.2.4.4. Recent Developments
- 14.2.4.5. Financials (Based on Availability)
- 14.2.5 Kamstrup A/S
- 14.2.5.1. Overview
- 14.2.5.2. Products
- 14.2.5.3. SWOT Analysis
- 14.2.5.4. Recent Developments
- 14.2.5.5. Financials (Based on Availability)
- 14.2.6 Neptune Technology Group Inc
- 14.2.6.1. Overview
- 14.2.6.2. Products
- 14.2.6.3. SWOT Analysis
- 14.2.6.4. Recent Developments
- 14.2.6.5. Financials (Based on Availability)
- 14.2.7 Sensus USA Inc (Xylem Inc )
- 14.2.7.1. Overview
- 14.2.7.2. Products
- 14.2.7.3. SWOT Analysis
- 14.2.7.4. Recent Developments
- 14.2.7.5. Financials (Based on Availability)
- 14.2.8 Aclara Technologies Inc (Hubbel Inc )
- 14.2.8.1. Overview
- 14.2.8.2. Products
- 14.2.8.3. SWOT Analysis
- 14.2.8.4. Recent Developments
- 14.2.8.5. Financials (Based on Availability)
- 14.2.9 Landis+GYR Group AG
- 14.2.9.1. Overview
- 14.2.9.2. Products
- 14.2.9.3. SWOT Analysis
- 14.2.9.4. Recent Developments
- 14.2.9.5. Financials (Based on Availability)
- 14.2.10 General Electric Company
- 14.2.10.1. Overview
- 14.2.10.2. Products
- 14.2.10.3. SWOT Analysis
- 14.2.10.4. Recent Developments
- 14.2.10.5. Financials (Based on Availability)
- 14.2.11 Diehl Metering U S
- 14.2.11.1. Overview
- 14.2.11.2. Products
- 14.2.11.3. SWOT Analysis
- 14.2.11.4. Recent Developments
- 14.2.11.5. Financials (Based on Availability)
- 14.2.12 Mueller Systems LLC
- 14.2.12.1. Overview
- 14.2.12.2. Products
- 14.2.12.3. SWOT Analysis
- 14.2.12.4. Recent Developments
- 14.2.12.5. Financials (Based on Availability)
- 14.2.1 Itron Inc
List of Figures
- Figure 1: Global US Residential Smart Meters Market Revenue Breakdown (Million, %) by Region 2024 & 2032
- Figure 2: Global US Residential Smart Meters Market Volume Breakdown (Million, %) by Region 2024 & 2032
- Figure 3: North America US Residential Smart Meters Market Revenue (Million), by Country 2024 & 2032
- Figure 4: North America US Residential Smart Meters Market Volume (Million), by Country 2024 & 2032
- Figure 5: North America US Residential Smart Meters Market Revenue Share (%), by Country 2024 & 2032
- Figure 6: North America US Residential Smart Meters Market Volume Share (%), by Country 2024 & 2032
- Figure 7: North America US Residential Smart Meters Market Revenue (Million), by Type 2024 & 2032
- Figure 8: North America US Residential Smart Meters Market Volume (Million), by Type 2024 & 2032
- Figure 9: North America US Residential Smart Meters Market Revenue Share (%), by Type 2024 & 2032
- Figure 10: North America US Residential Smart Meters Market Volume Share (%), by Type 2024 & 2032
- Figure 11: North America US Residential Smart Meters Market Revenue (Million), by Technology 2024 & 2032
- Figure 12: North America US Residential Smart Meters Market Volume (Million), by Technology 2024 & 2032
- Figure 13: North America US Residential Smart Meters Market Revenue Share (%), by Technology 2024 & 2032
- Figure 14: North America US Residential Smart Meters Market Volume Share (%), by Technology 2024 & 2032
- Figure 15: North America US Residential Smart Meters Market Revenue (Million), by Application 2024 & 2032
- Figure 16: North America US Residential Smart Meters Market Volume (Million), by Application 2024 & 2032
- Figure 17: North America US Residential Smart Meters Market Revenue Share (%), by Application 2024 & 2032
- Figure 18: North America US Residential Smart Meters Market Volume Share (%), by Application 2024 & 2032
- Figure 19: North America US Residential Smart Meters Market Revenue (Million), by Country 2024 & 2032
- Figure 20: North America US Residential Smart Meters Market Volume (Million), by Country 2024 & 2032
- Figure 21: North America US Residential Smart Meters Market Revenue Share (%), by Country 2024 & 2032
- Figure 22: North America US Residential Smart Meters Market Volume Share (%), by Country 2024 & 2032
- Figure 23: South America US Residential Smart Meters Market Revenue (Million), by Type 2024 & 2032
- Figure 24: South America US Residential Smart Meters Market Volume (Million), by Type 2024 & 2032
- Figure 25: South America US Residential Smart Meters Market Revenue Share (%), by Type 2024 & 2032
- Figure 26: South America US Residential Smart Meters Market Volume Share (%), by Type 2024 & 2032
- Figure 27: South America US Residential Smart Meters Market Revenue (Million), by Technology 2024 & 2032
- Figure 28: South America US Residential Smart Meters Market Volume (Million), by Technology 2024 & 2032
- Figure 29: South America US Residential Smart Meters Market Revenue Share (%), by Technology 2024 & 2032
- Figure 30: South America US Residential Smart Meters Market Volume Share (%), by Technology 2024 & 2032
- Figure 31: South America US Residential Smart Meters Market Revenue (Million), by Application 2024 & 2032
- Figure 32: South America US Residential Smart Meters Market Volume (Million), by Application 2024 & 2032
- Figure 33: South America US Residential Smart Meters Market Revenue Share (%), by Application 2024 & 2032
- Figure 34: South America US Residential Smart Meters Market Volume Share (%), by Application 2024 & 2032
- Figure 35: South America US Residential Smart Meters Market Revenue (Million), by Country 2024 & 2032
- Figure 36: South America US Residential Smart Meters Market Volume (Million), by Country 2024 & 2032
- Figure 37: South America US Residential Smart Meters Market Revenue Share (%), by Country 2024 & 2032
- Figure 38: South America US Residential Smart Meters Market Volume Share (%), by Country 2024 & 2032
- Figure 39: Europe US Residential Smart Meters Market Revenue (Million), by Type 2024 & 2032
- Figure 40: Europe US Residential Smart Meters Market Volume (Million), by Type 2024 & 2032
- Figure 41: Europe US Residential Smart Meters Market Revenue Share (%), by Type 2024 & 2032
- Figure 42: Europe US Residential Smart Meters Market Volume Share (%), by Type 2024 & 2032
- Figure 43: Europe US Residential Smart Meters Market Revenue (Million), by Technology 2024 & 2032
- Figure 44: Europe US Residential Smart Meters Market Volume (Million), by Technology 2024 & 2032
- Figure 45: Europe US Residential Smart Meters Market Revenue Share (%), by Technology 2024 & 2032
- Figure 46: Europe US Residential Smart Meters Market Volume Share (%), by Technology 2024 & 2032
- Figure 47: Europe US Residential Smart Meters Market Revenue (Million), by Application 2024 & 2032
- Figure 48: Europe US Residential Smart Meters Market Volume (Million), by Application 2024 & 2032
- Figure 49: Europe US Residential Smart Meters Market Revenue Share (%), by Application 2024 & 2032
- Figure 50: Europe US Residential Smart Meters Market Volume Share (%), by Application 2024 & 2032
- Figure 51: Europe US Residential Smart Meters Market Revenue (Million), by Country 2024 & 2032
- Figure 52: Europe US Residential Smart Meters Market Volume (Million), by Country 2024 & 2032
- Figure 53: Europe US Residential Smart Meters Market Revenue Share (%), by Country 2024 & 2032
- Figure 54: Europe US Residential Smart Meters Market Volume Share (%), by Country 2024 & 2032
- Figure 55: Middle East & Africa US Residential Smart Meters Market Revenue (Million), by Type 2024 & 2032
- Figure 56: Middle East & Africa US Residential Smart Meters Market Volume (Million), by Type 2024 & 2032
- Figure 57: Middle East & Africa US Residential Smart Meters Market Revenue Share (%), by Type 2024 & 2032
- Figure 58: Middle East & Africa US Residential Smart Meters Market Volume Share (%), by Type 2024 & 2032
- Figure 59: Middle East & Africa US Residential Smart Meters Market Revenue (Million), by Technology 2024 & 2032
- Figure 60: Middle East & Africa US Residential Smart Meters Market Volume (Million), by Technology 2024 & 2032
- Figure 61: Middle East & Africa US Residential Smart Meters Market Revenue Share (%), by Technology 2024 & 2032
- Figure 62: Middle East & Africa US Residential Smart Meters Market Volume Share (%), by Technology 2024 & 2032
- Figure 63: Middle East & Africa US Residential Smart Meters Market Revenue (Million), by Application 2024 & 2032
- Figure 64: Middle East & Africa US Residential Smart Meters Market Volume (Million), by Application 2024 & 2032
- Figure 65: Middle East & Africa US Residential Smart Meters Market Revenue Share (%), by Application 2024 & 2032
- Figure 66: Middle East & Africa US Residential Smart Meters Market Volume Share (%), by Application 2024 & 2032
- Figure 67: Middle East & Africa US Residential Smart Meters Market Revenue (Million), by Country 2024 & 2032
- Figure 68: Middle East & Africa US Residential Smart Meters Market Volume (Million), by Country 2024 & 2032
- Figure 69: Middle East & Africa US Residential Smart Meters Market Revenue Share (%), by Country 2024 & 2032
- Figure 70: Middle East & Africa US Residential Smart Meters Market Volume Share (%), by Country 2024 & 2032
- Figure 71: Asia Pacific US Residential Smart Meters Market Revenue (Million), by Type 2024 & 2032
- Figure 72: Asia Pacific US Residential Smart Meters Market Volume (Million), by Type 2024 & 2032
- Figure 73: Asia Pacific US Residential Smart Meters Market Revenue Share (%), by Type 2024 & 2032
- Figure 74: Asia Pacific US Residential Smart Meters Market Volume Share (%), by Type 2024 & 2032
- Figure 75: Asia Pacific US Residential Smart Meters Market Revenue (Million), by Technology 2024 & 2032
- Figure 76: Asia Pacific US Residential Smart Meters Market Volume (Million), by Technology 2024 & 2032
- Figure 77: Asia Pacific US Residential Smart Meters Market Revenue Share (%), by Technology 2024 & 2032
- Figure 78: Asia Pacific US Residential Smart Meters Market Volume Share (%), by Technology 2024 & 2032
- Figure 79: Asia Pacific US Residential Smart Meters Market Revenue (Million), by Application 2024 & 2032
- Figure 80: Asia Pacific US Residential Smart Meters Market Volume (Million), by Application 2024 & 2032
- Figure 81: Asia Pacific US Residential Smart Meters Market Revenue Share (%), by Application 2024 & 2032
- Figure 82: Asia Pacific US Residential Smart Meters Market Volume Share (%), by Application 2024 & 2032
- Figure 83: Asia Pacific US Residential Smart Meters Market Revenue (Million), by Country 2024 & 2032
- Figure 84: Asia Pacific US Residential Smart Meters Market Volume (Million), by Country 2024 & 2032
- Figure 85: Asia Pacific US Residential Smart Meters Market Revenue Share (%), by Country 2024 & 2032
- Figure 86: Asia Pacific US Residential Smart Meters Market Volume Share (%), by Country 2024 & 2032
List of Tables
- Table 1: Global US Residential Smart Meters Market Revenue Million Forecast, by Region 2019 & 2032
- Table 2: Global US Residential Smart Meters Market Volume Million Forecast, by Region 2019 & 2032
- Table 3: Global US Residential Smart Meters Market Revenue Million Forecast, by Type 2019 & 2032
- Table 4: Global US Residential Smart Meters Market Volume Million Forecast, by Type 2019 & 2032
- Table 5: Global US Residential Smart Meters Market Revenue Million Forecast, by Technology 2019 & 2032
- Table 6: Global US Residential Smart Meters Market Volume Million Forecast, by Technology 2019 & 2032
- Table 7: Global US Residential Smart Meters Market Revenue Million Forecast, by Application 2019 & 2032
- Table 8: Global US Residential Smart Meters Market Volume Million Forecast, by Application 2019 & 2032
- Table 9: Global US Residential Smart Meters Market Revenue Million Forecast, by Region 2019 & 2032
- Table 10: Global US Residential Smart Meters Market Volume Million Forecast, by Region 2019 & 2032
- Table 11: Global US Residential Smart Meters Market Revenue Million Forecast, by Country 2019 & 2032
- Table 12: Global US Residential Smart Meters Market Volume Million Forecast, by Country 2019 & 2032
- Table 13: United States US Residential Smart Meters Market Revenue (Million) Forecast, by Application 2019 & 2032
- Table 14: United States US Residential Smart Meters Market Volume (Million) Forecast, by Application 2019 & 2032
- Table 15: Canada US Residential Smart Meters Market Revenue (Million) Forecast, by Application 2019 & 2032
- Table 16: Canada US Residential Smart Meters Market Volume (Million) Forecast, by Application 2019 & 2032
- Table 17: Mexico US Residential Smart Meters Market Revenue (Million) Forecast, by Application 2019 & 2032
- Table 18: Mexico US Residential Smart Meters Market Volume (Million) Forecast, by Application 2019 & 2032
- Table 19: Global US Residential Smart Meters Market Revenue Million Forecast, by Type 2019 & 2032
- Table 20: Global US Residential Smart Meters Market Volume Million Forecast, by Type 2019 & 2032
- Table 21: Global US Residential Smart Meters Market Revenue Million Forecast, by Technology 2019 & 2032
- Table 22: Global US Residential Smart Meters Market Volume Million Forecast, by Technology 2019 & 2032
- Table 23: Global US Residential Smart Meters Market Revenue Million Forecast, by Application 2019 & 2032
- Table 24: Global US Residential Smart Meters Market Volume Million Forecast, by Application 2019 & 2032
- Table 25: Global US Residential Smart Meters Market Revenue Million Forecast, by Country 2019 & 2032
- Table 26: Global US Residential Smart Meters Market Volume Million Forecast, by Country 2019 & 2032
- Table 27: United States US Residential Smart Meters Market Revenue (Million) Forecast, by Application 2019 & 2032
- Table 28: United States US Residential Smart Meters Market Volume (Million) Forecast, by Application 2019 & 2032
- Table 29: Canada US Residential Smart Meters Market Revenue (Million) Forecast, by Application 2019 & 2032
- Table 30: Canada US Residential Smart Meters Market Volume (Million) Forecast, by Application 2019 & 2032
- Table 31: Mexico US Residential Smart Meters Market Revenue (Million) Forecast, by Application 2019 & 2032
- Table 32: Mexico US Residential Smart Meters Market Volume (Million) Forecast, by Application 2019 & 2032
- Table 33: Global US Residential Smart Meters Market Revenue Million Forecast, by Type 2019 & 2032
- Table 34: Global US Residential Smart Meters Market Volume Million Forecast, by Type 2019 & 2032
- Table 35: Global US Residential Smart Meters Market Revenue Million Forecast, by Technology 2019 & 2032
- Table 36: Global US Residential Smart Meters Market Volume Million Forecast, by Technology 2019 & 2032
- Table 37: Global US Residential Smart Meters Market Revenue Million Forecast, by Application 2019 & 2032
- Table 38: Global US Residential Smart Meters Market Volume Million Forecast, by Application 2019 & 2032
- Table 39: Global US Residential Smart Meters Market Revenue Million Forecast, by Country 2019 & 2032
- Table 40: Global US Residential Smart Meters Market Volume Million Forecast, by Country 2019 & 2032
- Table 41: Brazil US Residential Smart Meters Market Revenue (Million) Forecast, by Application 2019 & 2032
- Table 42: Brazil US Residential Smart Meters Market Volume (Million) Forecast, by Application 2019 & 2032
- Table 43: Argentina US Residential Smart Meters Market Revenue (Million) Forecast, by Application 2019 & 2032
- Table 44: Argentina US Residential Smart Meters Market Volume (Million) Forecast, by Application 2019 & 2032
- Table 45: Rest of South America US Residential Smart Meters Market Revenue (Million) Forecast, by Application 2019 & 2032
- Table 46: Rest of South America US Residential Smart Meters Market Volume (Million) Forecast, by Application 2019 & 2032
- Table 47: Global US Residential Smart Meters Market Revenue Million Forecast, by Type 2019 & 2032
- Table 48: Global US Residential Smart Meters Market Volume Million Forecast, by Type 2019 & 2032
- Table 49: Global US Residential Smart Meters Market Revenue Million Forecast, by Technology 2019 & 2032
- Table 50: Global US Residential Smart Meters Market Volume Million Forecast, by Technology 2019 & 2032
- Table 51: Global US Residential Smart Meters Market Revenue Million Forecast, by Application 2019 & 2032
- Table 52: Global US Residential Smart Meters Market Volume Million Forecast, by Application 2019 & 2032
- Table 53: Global US Residential Smart Meters Market Revenue Million Forecast, by Country 2019 & 2032
- Table 54: Global US Residential Smart Meters Market Volume Million Forecast, by Country 2019 & 2032
- Table 55: United Kingdom US Residential Smart Meters Market Revenue (Million) Forecast, by Application 2019 & 2032
- Table 56: United Kingdom US Residential Smart Meters Market Volume (Million) Forecast, by Application 2019 & 2032
- Table 57: Germany US Residential Smart Meters Market Revenue (Million) Forecast, by Application 2019 & 2032
- Table 58: Germany US Residential Smart Meters Market Volume (Million) Forecast, by Application 2019 & 2032
- Table 59: France US Residential Smart Meters Market Revenue (Million) Forecast, by Application 2019 & 2032
- Table 60: France US Residential Smart Meters Market Volume (Million) Forecast, by Application 2019 & 2032
- Table 61: Italy US Residential Smart Meters Market Revenue (Million) Forecast, by Application 2019 & 2032
- Table 62: Italy US Residential Smart Meters Market Volume (Million) Forecast, by Application 2019 & 2032
- Table 63: Spain US Residential Smart Meters Market Revenue (Million) Forecast, by Application 2019 & 2032
- Table 64: Spain US Residential Smart Meters Market Volume (Million) Forecast, by Application 2019 & 2032
- Table 65: Russia US Residential Smart Meters Market Revenue (Million) Forecast, by Application 2019 & 2032
- Table 66: Russia US Residential Smart Meters Market Volume (Million) Forecast, by Application 2019 & 2032
- Table 67: Benelux US Residential Smart Meters Market Revenue (Million) Forecast, by Application 2019 & 2032
- Table 68: Benelux US Residential Smart Meters Market Volume (Million) Forecast, by Application 2019 & 2032
- Table 69: Nordics US Residential Smart Meters Market Revenue (Million) Forecast, by Application 2019 & 2032
- Table 70: Nordics US Residential Smart Meters Market Volume (Million) Forecast, by Application 2019 & 2032
- Table 71: Rest of Europe US Residential Smart Meters Market Revenue (Million) Forecast, by Application 2019 & 2032
- Table 72: Rest of Europe US Residential Smart Meters Market Volume (Million) Forecast, by Application 2019 & 2032
- Table 73: Global US Residential Smart Meters Market Revenue Million Forecast, by Type 2019 & 2032
- Table 74: Global US Residential Smart Meters Market Volume Million Forecast, by Type 2019 & 2032
- Table 75: Global US Residential Smart Meters Market Revenue Million Forecast, by Technology 2019 & 2032
- Table 76: Global US Residential Smart Meters Market Volume Million Forecast, by Technology 2019 & 2032
- Table 77: Global US Residential Smart Meters Market Revenue Million Forecast, by Application 2019 & 2032
- Table 78: Global US Residential Smart Meters Market Volume Million Forecast, by Application 2019 & 2032
- Table 79: Global US Residential Smart Meters Market Revenue Million Forecast, by Country 2019 & 2032
- Table 80: Global US Residential Smart Meters Market Volume Million Forecast, by Country 2019 & 2032
- Table 81: Turkey US Residential Smart Meters Market Revenue (Million) Forecast, by Application 2019 & 2032
- Table 82: Turkey US Residential Smart Meters Market Volume (Million) Forecast, by Application 2019 & 2032
- Table 83: Israel US Residential Smart Meters Market Revenue (Million) Forecast, by Application 2019 & 2032
- Table 84: Israel US Residential Smart Meters Market Volume (Million) Forecast, by Application 2019 & 2032
- Table 85: GCC US Residential Smart Meters Market Revenue (Million) Forecast, by Application 2019 & 2032
- Table 86: GCC US Residential Smart Meters Market Volume (Million) Forecast, by Application 2019 & 2032
- Table 87: North Africa US Residential Smart Meters Market Revenue (Million) Forecast, by Application 2019 & 2032
- Table 88: North Africa US Residential Smart Meters Market Volume (Million) Forecast, by Application 2019 & 2032
- Table 89: South Africa US Residential Smart Meters Market Revenue (Million) Forecast, by Application 2019 & 2032
- Table 90: South Africa US Residential Smart Meters Market Volume (Million) Forecast, by Application 2019 & 2032
- Table 91: Rest of Middle East & Africa US Residential Smart Meters Market Revenue (Million) Forecast, by Application 2019 & 2032
- Table 92: Rest of Middle East & Africa US Residential Smart Meters Market Volume (Million) Forecast, by Application 2019 & 2032
- Table 93: Global US Residential Smart Meters Market Revenue Million Forecast, by Type 2019 & 2032
- Table 94: Global US Residential Smart Meters Market Volume Million Forecast, by Type 2019 & 2032
- Table 95: Global US Residential Smart Meters Market Revenue Million Forecast, by Technology 2019 & 2032
- Table 96: Global US Residential Smart Meters Market Volume Million Forecast, by Technology 2019 & 2032
- Table 97: Global US Residential Smart Meters Market Revenue Million Forecast, by Application 2019 & 2032
- Table 98: Global US Residential Smart Meters Market Volume Million Forecast, by Application 2019 & 2032
- Table 99: Global US Residential Smart Meters Market Revenue Million Forecast, by Country 2019 & 2032
- Table 100: Global US Residential Smart Meters Market Volume Million Forecast, by Country 2019 & 2032
- Table 101: China US Residential Smart Meters Market Revenue (Million) Forecast, by Application 2019 & 2032
- Table 102: China US Residential Smart Meters Market Volume (Million) Forecast, by Application 2019 & 2032
- Table 103: India US Residential Smart Meters Market Revenue (Million) Forecast, by Application 2019 & 2032
- Table 104: India US Residential Smart Meters Market Volume (Million) Forecast, by Application 2019 & 2032
- Table 105: Japan US Residential Smart Meters Market Revenue (Million) Forecast, by Application 2019 & 2032
- Table 106: Japan US Residential Smart Meters Market Volume (Million) Forecast, by Application 2019 & 2032
- Table 107: South Korea US Residential Smart Meters Market Revenue (Million) Forecast, by Application 2019 & 2032
- Table 108: South Korea US Residential Smart Meters Market Volume (Million) Forecast, by Application 2019 & 2032
- Table 109: ASEAN US Residential Smart Meters Market Revenue (Million) Forecast, by Application 2019 & 2032
- Table 110: ASEAN US Residential Smart Meters Market Volume (Million) Forecast, by Application 2019 & 2032
- Table 111: Oceania US Residential Smart Meters Market Revenue (Million) Forecast, by Application 2019 & 2032
- Table 112: Oceania US Residential Smart Meters Market Volume (Million) Forecast, by Application 2019 & 2032
- Table 113: Rest of Asia Pacific US Residential Smart Meters Market Revenue (Million) Forecast, by Application 2019 & 2032
- Table 114: Rest of Asia Pacific US Residential Smart Meters Market Volume (Million) Forecast, by Application 2019 & 2032
Frequently Asked Questions
1. What is the projected Compound Annual Growth Rate (CAGR) of the US Residential Smart Meters Market?
The projected CAGR is approximately 6.32%.
2. Which companies are prominent players in the US Residential Smart Meters Market?
Key companies in the market include Itron Inc, Badger Meter Inc, Elster Group GmbH (Honeywell International Inc), Wasion Holdings Limited, Kamstrup A/S, Neptune Technology Group Inc, Sensus USA Inc (Xylem Inc ), Aclara Technologies Inc (Hubbel Inc ), Landis+GYR Group AG, General Electric Company, Diehl Metering U S, Mueller Systems LLC.
3. What are the main segments of the US Residential Smart Meters Market?
The market segments include Type, Technology, Application.
4. Can you provide details about the market size?
The market size is estimated to be USD XX Million as of 2022.
5. What are some drivers contributing to market growth?
Increased Investments in Smart Grid Projects; Growth in Smart City Deployment.
6. What are the notable trends driving market growth?
Increased Investments in Smart Grid Projects to Drive the Market.
7. Are there any restraints impacting market growth?
High Installation Cost and Longer ROI Period; Longer Replacement Cycle of Water Meters.
8. Can you provide examples of recent developments in the market?
September 2023 - Southwestern Electric Power Co., an American Electric Power company, announced that it would begin installing advanced digital meters, more commonly known as smart meters, in Louisiana. Smart meters use secure wireless technology to provide timely and accurate meter reading data, which customers can use to better understand and manage energy usage at a home or business. In addition, smart meters also allow for real-time outage notifications to SWEPCO for more seamless power restoration. Installations to approximately 234,000 Louisiana customers will begin in the Shreveport-Bossier City area in October before moving south to Hornbeck and other parts of SWEPCO’s Louisiana service territory. Deployment of smart meters will continue across the state through 2025.
9. What pricing options are available for accessing the report?
Pricing options include single-user, multi-user, and enterprise licenses priced at USD 3800, USD 4500, and USD 5800 respectively.
10. Is the market size provided in terms of value or volume?
The market size is provided in terms of value, measured in Million and volume, measured in Million.
11. Are there any specific market keywords associated with the report?
Yes, the market keyword associated with the report is "US Residential Smart Meters Market," which aids in identifying and referencing the specific market segment covered.
12. How do I determine which pricing option suits my needs best?
The pricing options vary based on user requirements and access needs. Individual users may opt for single-user licenses, while businesses requiring broader access may choose multi-user or enterprise licenses for cost-effective access to the report.
13. Are there any additional resources or data provided in the US Residential Smart Meters Market report?
While the report offers comprehensive insights, it's advisable to review the specific contents or supplementary materials provided to ascertain if additional resources or data are available.
14. How can I stay updated on further developments or reports in the US Residential Smart Meters Market?
To stay informed about further developments, trends, and reports in the US Residential Smart Meters Market, consider subscribing to industry newsletters, following relevant companies and organizations, or regularly checking reputable industry news sources and publications.
Methodology
Step 1 - Identification of Relevant Samples Size from Population Database


Step 2 - Approaches for Defining Global Market Size (Value, Volume* & Price*)

Note*: In applicable scenarios
Step 3 - Data Sources
Primary Research
- Web Analytics
- Survey Reports
- Research Institute
- Latest Research Reports
- Opinion Leaders
Secondary Research
- Annual Reports
- White Paper
- Latest Press Release
- Industry Association
- Paid Database
- Investor Presentations

Step 4 - Data Triangulation
Involves using different sources of information in order to increase the validity of a study
These sources are likely to be stakeholders in a program - participants, other researchers, program staff, other community members, and so on.
Then we put all data in single framework & apply various statistical tools to find out the dynamic on the market.
During the analysis stage, feedback from the stakeholder groups would be compared to determine areas of agreement as well as areas of divergence
