

Key Insights
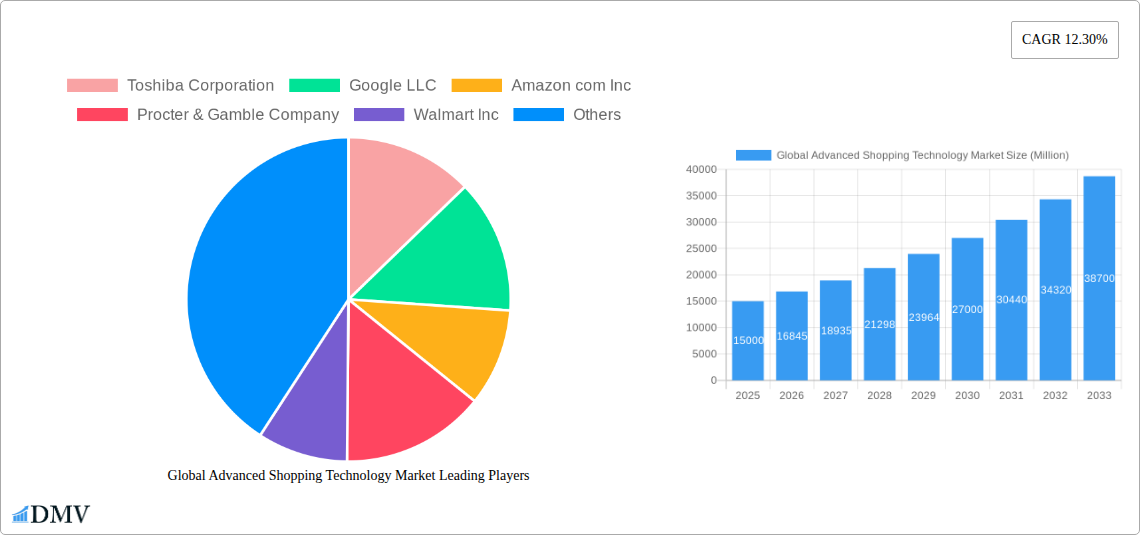
The Global Advanced Shopping Technology market is experiencing robust growth, projected to reach a significant value by 2033. The 12.30% CAGR indicates a consistently expanding market driven by several key factors. The increasing adoption of e-commerce and omnichannel strategies by retailers is a primary driver, fueled by consumer demand for seamless and personalized shopping experiences. Technological advancements such as the proliferation of beacons for precise location-based marketing, immersive virtual reality experiences enhancing product visualization, smart shelves enabling inventory management and automated restocking, and user-friendly retail apps facilitating mobile commerce are all contributing significantly. Furthermore, the integration of social media platforms in the shopping journey and the growing popularity of showrooming (examining products in-store before purchasing online) are reshaping the retail landscape. The market is segmented by product type (beacons, virtual reality, smart shelves, retail apps, social media and showrooming, others) and application (retail, commercial advertising, others). Key players such as Toshiba Corporation, Google LLC, Amazon.com Inc., Procter & Gamble Company, and Walmart Inc. are actively shaping the market through innovation and strategic partnerships. While data privacy concerns and the need for robust cybersecurity measures represent potential restraints, the overall market trajectory remains positive, indicating substantial growth opportunities across various regions, particularly in North America and Asia-Pacific, fueled by high consumer spending and technological adoption rates.
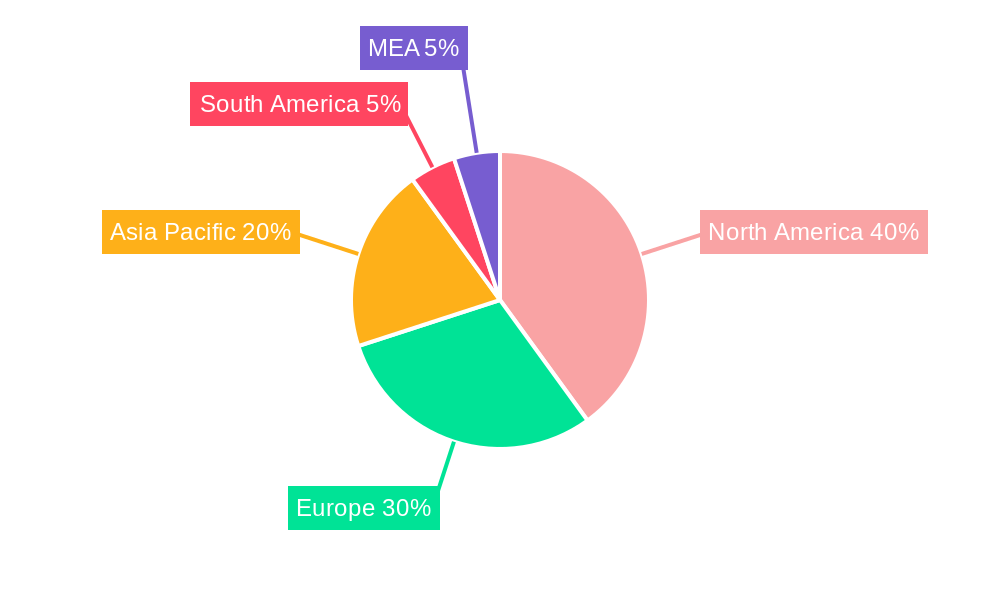
The market’s geographical distribution reveals significant regional variations. North America, with its established e-commerce infrastructure and high consumer spending power, is expected to maintain a dominant market share. However, rapid technological advancement and expanding internet penetration in regions like Asia-Pacific, particularly in countries like China and India, are poised to drive substantial growth in this region over the forecast period. Europe also presents a significant market, with strong adoption of innovative retail technologies across various countries. While South America and the Middle East & Africa demonstrate promising growth potential, their development may be somewhat slower due to varying levels of technological infrastructure and consumer spending habits. The competitive landscape is characterized by both established tech giants and specialized retailers, leading to continuous innovation and potential market consolidation in the coming years. Future growth will be contingent upon the sustained development and integration of new technologies, the addressal of consumer privacy concerns, and the successful adaptation of retailers to evolving consumer preferences.
Global Advanced Shopping Technology Market: A Comprehensive Report (2019-2033)
This insightful report provides a detailed analysis of the Global Advanced Shopping Technology Market, offering a comprehensive overview of market trends, growth drivers, challenges, and future opportunities. With a study period spanning 2019-2033, a base year of 2025, and a forecast period of 2025-2033, this report is an invaluable resource for stakeholders seeking to understand and capitalize on the dynamic landscape of this rapidly evolving sector. The market is valued at xx Million in 2025 and is projected to reach xx Million by 2033.
Global Advanced Shopping Technology Market Composition & Trends
This section delves into the intricacies of the advanced shopping technology market, examining its competitive landscape, innovation drivers, and regulatory factors. We analyze market concentration, revealing the share held by key players like Toshiba Corporation, Google LLC, Amazon.com Inc., Procter & Gamble Company, and Walmart Inc. The report further explores the impact of mergers and acquisitions (M&A) activities, providing insights into deal values and their influence on market dynamics. We assess the influence of regulatory landscapes and the emergence of substitute products, examining their potential to disrupt the market. Finally, we provide detailed profiles of end-users across retail, commercial advertising, and other sectors.
- Market Share Distribution: A detailed breakdown of market share amongst key players in 2025. Amazon holds approximately xx%, followed by Google at xx%, Toshiba at xx%, and others.
- M&A Activity: Analysis of significant M&A deals (2019-2024), including deal values and their impact on market consolidation (xx Million in total deal value predicted).
- Innovation Catalysts: A deep dive into technological advancements driving market growth, such as AI, VR/AR, and IoT integration.
- Regulatory Landscape: A comprehensive overview of relevant regulations and their influence on market expansion across different regions.
- Substitute Products: Assessment of alternative solutions and their potential to impact market share.
Global Advanced Shopping Technology Market Industry Evolution
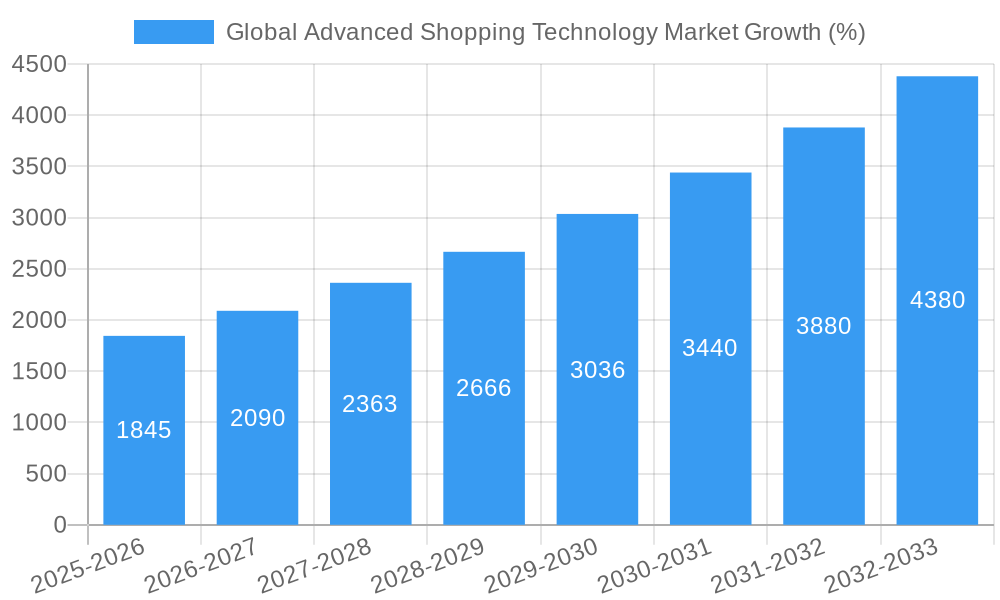
This section provides a comprehensive analysis of the market's historical and projected growth trajectories. We examine technological advancements, such as the rise of beacons, virtual reality (VR) shopping experiences, smart shelves, retail apps, and the impact of social media and showrooming, all influencing consumer behavior and market dynamics. The report meticulously tracks adoption rates of various technologies across different segments, detailing the growth rate from 2019 to 2024 (xx% CAGR) and projecting the growth rate from 2025 to 2033 (xx% CAGR). We analyze shifting consumer preferences and their impact on market demand, including evolving expectations for personalized experiences, seamless omnichannel integration, and increased demand for convenience.
Leading Regions, Countries, or Segments in Global Advanced Shopping Technology Market
This section identifies the leading regions, countries, and segments within the global advanced shopping technology market. We analyze the factors driving dominance within each segment (By Product Type: Beacons, Virtual Reality, Smart Shelves, Retail Apps, Social Media and Showrooming, Others; By Application: Retail, Commercial Advertising, Others), highlighting key differentiators and future growth potential.
- Key Drivers (Retail Segment): Increased investment in omnichannel strategies, government initiatives promoting digital transformation in retail, and strong consumer adoption of mobile shopping apps.
- Dominance Factors (North America): Early adoption of advanced technologies, high disposable income, and a strong presence of major technology players.
- Growth Potential (Asia-Pacific): Rapid expansion of e-commerce, increasing smartphone penetration, and a burgeoning middle class driving demand for advanced shopping experiences.
Global Advanced Shopping Technology Market Product Innovations
This section highlights recent product innovations and technological advancements impacting the advanced shopping technology market. We showcase products with unique selling propositions (USPs) and quantify their performance metrics to illustrate their impact on efficiency and consumer experience. The integration of AI for personalized recommendations, advancements in VR/AR technologies offering immersive shopping experiences, and the development of more user-friendly retail apps are emphasized.
Propelling Factors for Global Advanced Shopping Technology Market Growth
Several factors fuel the growth of the advanced shopping technology market. Technological advancements such as AI-powered personalization and augmented reality (AR) shopping experiences create highly engaging customer journeys. Furthermore, favorable economic conditions and supportive government regulations in key markets stimulate investment and adoption.
Obstacles in the Global Advanced Shopping Technology Market
Despite the positive outlook, the market faces significant hurdles. High initial investment costs for technology implementation pose a barrier for smaller retailers. Supply chain disruptions, especially regarding specialized hardware, impact market availability. Intense competition amongst technology providers and established retailers also present a challenge. Finally, complex and evolving data privacy regulations require careful navigation.
Future Opportunities in Global Advanced Shopping Technology Market
The future of the advanced shopping technology market is promising, with substantial opportunities in emerging markets. The expansion into untapped markets, particularly in developing economies, presents a significant potential for growth. The adoption of innovative technologies such as 5G and edge computing will further enhance the capabilities of advanced shopping solutions.
Major Players in the Global Advanced Shopping Technology Market Ecosystem
- Toshiba Corporation
- Google LLC
- Amazon.com Inc.
- Procter & Gamble Company
- Walmart Inc
Key Developments in Global Advanced Shopping Technology Market Industry
- June 2021: Toshiba's Self Checkout System 7, developed with Calimax, enhances checkout experiences, boosting customer satisfaction and sales.
- July 2021: Toshiba Global Commerce Solutions partners with Stor.ai, integrating digital commerce solutions for grocers, expanding online capabilities and market reach.
Strategic Global Advanced Shopping Technology Market Forecast
The global advanced shopping technology market is poised for significant growth, driven by increasing consumer demand for seamless and personalized shopping experiences. Technological innovations, coupled with strategic investments and favorable regulatory environments, will propel market expansion. The market is expected to witness a compound annual growth rate (CAGR) of xx% during the forecast period, presenting substantial opportunities for both established players and new entrants.
Global Advanced Shopping Technology Market Segmentation
-
1. Product Type
- 1.1. Beacons
- 1.2. Virtual Reality
- 1.3. Smart Shelves
- 1.4. Retail Apps
- 1.5. Social Media and Showrooming
- 1.6. Others
-
2. Application
- 2.1. Retail
- 2.2. Commercial Advertising
- 2.3. Others
Global Advanced Shopping Technology Market Segmentation By Geography
- 1. North America
- 2. Europe
- 3. Asia Pacific
- 4. Latin America
- 5. Middle East and Africa
Global Advanced Shopping Technology Market REPORT HIGHLIGHTS
| Aspects | Details |
|---|---|
| Study Period | 2019-2033 |
| Base Year | 2024 |
| Estimated Year | 2025 |
| Forecast Period | 2025-2033 |
| Historical Period | 2019-2024 |
| Growth Rate | CAGR of 12.30% from 2019-2033 |
| Segmentation |
|
Table of Contents
- 1. Introduction
- 1.1. Research Scope
- 1.2. Market Segmentation
- 1.3. Research Methodology
- 1.4. Definitions and Assumptions
- 2. Executive Summary
- 2.1. Introduction
- 3. Market Dynamics
- 3.1. Introduction
- 3.2. Market Drivers
- 3.2.1. Increasing adoption of advance technology in retail sector; Artificial intelligence and robots in retail stores
- 3.3. Market Restrains
- 3.3.1. High cost of implementation of the technology
- 3.4. Market Trends
- 3.4.1. Increasing Adoption of Virtual Reality in the Retail Sector is Expected to Drive the Market
- 4. Market Factor Analysis
- 4.1. Porters Five Forces
- 4.2. Supply/Value Chain
- 4.3. PESTEL analysis
- 4.4. Market Entropy
- 4.5. Patent/Trademark Analysis
- 5. Global Advanced Shopping Technology Market Analysis, Insights and Forecast, 2019-2031
- 5.1. Market Analysis, Insights and Forecast - by Product Type
- 5.1.1. Beacons
- 5.1.2. Virtual Reality
- 5.1.3. Smart Shelves
- 5.1.4. Retail Apps
- 5.1.5. Social Media and Showrooming
- 5.1.6. Others
- 5.2. Market Analysis, Insights and Forecast - by Application
- 5.2.1. Retail
- 5.2.2. Commercial Advertising
- 5.2.3. Others
- 5.3. Market Analysis, Insights and Forecast - by Region
- 5.3.1. North America
- 5.3.2. Europe
- 5.3.3. Asia Pacific
- 5.3.4. Latin America
- 5.3.5. Middle East and Africa
- 5.1. Market Analysis, Insights and Forecast - by Product Type
- 6. North America Global Advanced Shopping Technology Market Analysis, Insights and Forecast, 2019-2031
- 6.1. Market Analysis, Insights and Forecast - by Product Type
- 6.1.1. Beacons
- 6.1.2. Virtual Reality
- 6.1.3. Smart Shelves
- 6.1.4. Retail Apps
- 6.1.5. Social Media and Showrooming
- 6.1.6. Others
- 6.2. Market Analysis, Insights and Forecast - by Application
- 6.2.1. Retail
- 6.2.2. Commercial Advertising
- 6.2.3. Others
- 6.1. Market Analysis, Insights and Forecast - by Product Type
- 7. Europe Global Advanced Shopping Technology Market Analysis, Insights and Forecast, 2019-2031
- 7.1. Market Analysis, Insights and Forecast - by Product Type
- 7.1.1. Beacons
- 7.1.2. Virtual Reality
- 7.1.3. Smart Shelves
- 7.1.4. Retail Apps
- 7.1.5. Social Media and Showrooming
- 7.1.6. Others
- 7.2. Market Analysis, Insights and Forecast - by Application
- 7.2.1. Retail
- 7.2.2. Commercial Advertising
- 7.2.3. Others
- 7.1. Market Analysis, Insights and Forecast - by Product Type
- 8. Asia Pacific Global Advanced Shopping Technology Market Analysis, Insights and Forecast, 2019-2031
- 8.1. Market Analysis, Insights and Forecast - by Product Type
- 8.1.1. Beacons
- 8.1.2. Virtual Reality
- 8.1.3. Smart Shelves
- 8.1.4. Retail Apps
- 8.1.5. Social Media and Showrooming
- 8.1.6. Others
- 8.2. Market Analysis, Insights and Forecast - by Application
- 8.2.1. Retail
- 8.2.2. Commercial Advertising
- 8.2.3. Others
- 8.1. Market Analysis, Insights and Forecast - by Product Type
- 9. Latin America Global Advanced Shopping Technology Market Analysis, Insights and Forecast, 2019-2031
- 9.1. Market Analysis, Insights and Forecast - by Product Type
- 9.1.1. Beacons
- 9.1.2. Virtual Reality
- 9.1.3. Smart Shelves
- 9.1.4. Retail Apps
- 9.1.5. Social Media and Showrooming
- 9.1.6. Others
- 9.2. Market Analysis, Insights and Forecast - by Application
- 9.2.1. Retail
- 9.2.2. Commercial Advertising
- 9.2.3. Others
- 9.1. Market Analysis, Insights and Forecast - by Product Type
- 10. Middle East and Africa Global Advanced Shopping Technology Market Analysis, Insights and Forecast, 2019-2031
- 10.1. Market Analysis, Insights and Forecast - by Product Type
- 10.1.1. Beacons
- 10.1.2. Virtual Reality
- 10.1.3. Smart Shelves
- 10.1.4. Retail Apps
- 10.1.5. Social Media and Showrooming
- 10.1.6. Others
- 10.2. Market Analysis, Insights and Forecast - by Application
- 10.2.1. Retail
- 10.2.2. Commercial Advertising
- 10.2.3. Others
- 10.1. Market Analysis, Insights and Forecast - by Product Type
- 11. North America Global Advanced Shopping Technology Market Analysis, Insights and Forecast, 2019-2031
- 11.1. Market Analysis, Insights and Forecast - By Country/Sub-region
- 11.1.1 United States
- 11.1.2 Canada
- 11.1.3 Mexico
- 12. Europe Global Advanced Shopping Technology Market Analysis, Insights and Forecast, 2019-2031
- 12.1. Market Analysis, Insights and Forecast - By Country/Sub-region
- 12.1.1 Germany
- 12.1.2 United Kingdom
- 12.1.3 France
- 12.1.4 Spain
- 12.1.5 Italy
- 12.1.6 Spain
- 12.1.7 Belgium
- 12.1.8 Netherland
- 12.1.9 Nordics
- 12.1.10 Rest of Europe
- 13. Asia Pacific Global Advanced Shopping Technology Market Analysis, Insights and Forecast, 2019-2031
- 13.1. Market Analysis, Insights and Forecast - By Country/Sub-region
- 13.1.1 China
- 13.1.2 Japan
- 13.1.3 India
- 13.1.4 South Korea
- 13.1.5 Southeast Asia
- 13.1.6 Australia
- 13.1.7 Indonesia
- 13.1.8 Phillipes
- 13.1.9 Singapore
- 13.1.10 Thailandc
- 13.1.11 Rest of Asia Pacific
- 14. South America Global Advanced Shopping Technology Market Analysis, Insights and Forecast, 2019-2031
- 14.1. Market Analysis, Insights and Forecast - By Country/Sub-region
- 14.1.1 Brazil
- 14.1.2 Argentina
- 14.1.3 Peru
- 14.1.4 Chile
- 14.1.5 Colombia
- 14.1.6 Ecuador
- 14.1.7 Venezuela
- 14.1.8 Rest of South America
- 15. North America Global Advanced Shopping Technology Market Analysis, Insights and Forecast, 2019-2031
- 15.1. Market Analysis, Insights and Forecast - By Country/Sub-region
- 15.1.1 United States
- 15.1.2 Canada
- 15.1.3 Mexico
- 16. MEA Global Advanced Shopping Technology Market Analysis, Insights and Forecast, 2019-2031
- 16.1. Market Analysis, Insights and Forecast - By Country/Sub-region
- 16.1.1 United Arab Emirates
- 16.1.2 Saudi Arabia
- 16.1.3 South Africa
- 16.1.4 Rest of Middle East and Africa
- 17. Competitive Analysis
- 17.1. Market Share Analysis 2024
- 17.2. Company Profiles
- 17.2.1 Toshiba Corporation
- 17.2.1.1. Overview
- 17.2.1.2. Products
- 17.2.1.3. SWOT Analysis
- 17.2.1.4. Recent Developments
- 17.2.1.5. Financials (Based on Availability)
- 17.2.2 Google LLC
- 17.2.2.1. Overview
- 17.2.2.2. Products
- 17.2.2.3. SWOT Analysis
- 17.2.2.4. Recent Developments
- 17.2.2.5. Financials (Based on Availability)
- 17.2.3 Amazon com Inc
- 17.2.3.1. Overview
- 17.2.3.2. Products
- 17.2.3.3. SWOT Analysis
- 17.2.3.4. Recent Developments
- 17.2.3.5. Financials (Based on Availability)
- 17.2.4 Procter & Gamble Company
- 17.2.4.1. Overview
- 17.2.4.2. Products
- 17.2.4.3. SWOT Analysis
- 17.2.4.4. Recent Developments
- 17.2.4.5. Financials (Based on Availability)
- 17.2.5 Walmart Inc
- 17.2.5.1. Overview
- 17.2.5.2. Products
- 17.2.5.3. SWOT Analysis
- 17.2.5.4. Recent Developments
- 17.2.5.5. Financials (Based on Availability)
- 17.2.1 Toshiba Corporation
List of Figures
- Figure 1: Global Global Advanced Shopping Technology Market Revenue Breakdown (Million, %) by Region 2024 & 2032
- Figure 2: Global Global Advanced Shopping Technology Market Volume Breakdown (K Unit, %) by Region 2024 & 2032
- Figure 3: North America Global Advanced Shopping Technology Market Revenue (Million), by Country 2024 & 2032
- Figure 4: North America Global Advanced Shopping Technology Market Volume (K Unit), by Country 2024 & 2032
- Figure 5: North America Global Advanced Shopping Technology Market Revenue Share (%), by Country 2024 & 2032
- Figure 6: North America Global Advanced Shopping Technology Market Volume Share (%), by Country 2024 & 2032
- Figure 7: Europe Global Advanced Shopping Technology Market Revenue (Million), by Country 2024 & 2032
- Figure 8: Europe Global Advanced Shopping Technology Market Volume (K Unit), by Country 2024 & 2032
- Figure 9: Europe Global Advanced Shopping Technology Market Revenue Share (%), by Country 2024 & 2032
- Figure 10: Europe Global Advanced Shopping Technology Market Volume Share (%), by Country 2024 & 2032
- Figure 11: Asia Pacific Global Advanced Shopping Technology Market Revenue (Million), by Country 2024 & 2032
- Figure 12: Asia Pacific Global Advanced Shopping Technology Market Volume (K Unit), by Country 2024 & 2032
- Figure 13: Asia Pacific Global Advanced Shopping Technology Market Revenue Share (%), by Country 2024 & 2032
- Figure 14: Asia Pacific Global Advanced Shopping Technology Market Volume Share (%), by Country 2024 & 2032
- Figure 15: South America Global Advanced Shopping Technology Market Revenue (Million), by Country 2024 & 2032
- Figure 16: South America Global Advanced Shopping Technology Market Volume (K Unit), by Country 2024 & 2032
- Figure 17: South America Global Advanced Shopping Technology Market Revenue Share (%), by Country 2024 & 2032
- Figure 18: South America Global Advanced Shopping Technology Market Volume Share (%), by Country 2024 & 2032
- Figure 19: North America Global Advanced Shopping Technology Market Revenue (Million), by Country 2024 & 2032
- Figure 20: North America Global Advanced Shopping Technology Market Volume (K Unit), by Country 2024 & 2032
- Figure 21: North America Global Advanced Shopping Technology Market Revenue Share (%), by Country 2024 & 2032
- Figure 22: North America Global Advanced Shopping Technology Market Volume Share (%), by Country 2024 & 2032
- Figure 23: MEA Global Advanced Shopping Technology Market Revenue (Million), by Country 2024 & 2032
- Figure 24: MEA Global Advanced Shopping Technology Market Volume (K Unit), by Country 2024 & 2032
- Figure 25: MEA Global Advanced Shopping Technology Market Revenue Share (%), by Country 2024 & 2032
- Figure 26: MEA Global Advanced Shopping Technology Market Volume Share (%), by Country 2024 & 2032
- Figure 27: North America Global Advanced Shopping Technology Market Revenue (Million), by Product Type 2024 & 2032
- Figure 28: North America Global Advanced Shopping Technology Market Volume (K Unit), by Product Type 2024 & 2032
- Figure 29: North America Global Advanced Shopping Technology Market Revenue Share (%), by Product Type 2024 & 2032
- Figure 30: North America Global Advanced Shopping Technology Market Volume Share (%), by Product Type 2024 & 2032
- Figure 31: North America Global Advanced Shopping Technology Market Revenue (Million), by Application 2024 & 2032
- Figure 32: North America Global Advanced Shopping Technology Market Volume (K Unit), by Application 2024 & 2032
- Figure 33: North America Global Advanced Shopping Technology Market Revenue Share (%), by Application 2024 & 2032
- Figure 34: North America Global Advanced Shopping Technology Market Volume Share (%), by Application 2024 & 2032
- Figure 35: North America Global Advanced Shopping Technology Market Revenue (Million), by Country 2024 & 2032
- Figure 36: North America Global Advanced Shopping Technology Market Volume (K Unit), by Country 2024 & 2032
- Figure 37: North America Global Advanced Shopping Technology Market Revenue Share (%), by Country 2024 & 2032
- Figure 38: North America Global Advanced Shopping Technology Market Volume Share (%), by Country 2024 & 2032
- Figure 39: Europe Global Advanced Shopping Technology Market Revenue (Million), by Product Type 2024 & 2032
- Figure 40: Europe Global Advanced Shopping Technology Market Volume (K Unit), by Product Type 2024 & 2032
- Figure 41: Europe Global Advanced Shopping Technology Market Revenue Share (%), by Product Type 2024 & 2032
- Figure 42: Europe Global Advanced Shopping Technology Market Volume Share (%), by Product Type 2024 & 2032
- Figure 43: Europe Global Advanced Shopping Technology Market Revenue (Million), by Application 2024 & 2032
- Figure 44: Europe Global Advanced Shopping Technology Market Volume (K Unit), by Application 2024 & 2032
- Figure 45: Europe Global Advanced Shopping Technology Market Revenue Share (%), by Application 2024 & 2032
- Figure 46: Europe Global Advanced Shopping Technology Market Volume Share (%), by Application 2024 & 2032
- Figure 47: Europe Global Advanced Shopping Technology Market Revenue (Million), by Country 2024 & 2032
- Figure 48: Europe Global Advanced Shopping Technology Market Volume (K Unit), by Country 2024 & 2032
- Figure 49: Europe Global Advanced Shopping Technology Market Revenue Share (%), by Country 2024 & 2032
- Figure 50: Europe Global Advanced Shopping Technology Market Volume Share (%), by Country 2024 & 2032
- Figure 51: Asia Pacific Global Advanced Shopping Technology Market Revenue (Million), by Product Type 2024 & 2032
- Figure 52: Asia Pacific Global Advanced Shopping Technology Market Volume (K Unit), by Product Type 2024 & 2032
- Figure 53: Asia Pacific Global Advanced Shopping Technology Market Revenue Share (%), by Product Type 2024 & 2032
- Figure 54: Asia Pacific Global Advanced Shopping Technology Market Volume Share (%), by Product Type 2024 & 2032
- Figure 55: Asia Pacific Global Advanced Shopping Technology Market Revenue (Million), by Application 2024 & 2032
- Figure 56: Asia Pacific Global Advanced Shopping Technology Market Volume (K Unit), by Application 2024 & 2032
- Figure 57: Asia Pacific Global Advanced Shopping Technology Market Revenue Share (%), by Application 2024 & 2032
- Figure 58: Asia Pacific Global Advanced Shopping Technology Market Volume Share (%), by Application 2024 & 2032
- Figure 59: Asia Pacific Global Advanced Shopping Technology Market Revenue (Million), by Country 2024 & 2032
- Figure 60: Asia Pacific Global Advanced Shopping Technology Market Volume (K Unit), by Country 2024 & 2032
- Figure 61: Asia Pacific Global Advanced Shopping Technology Market Revenue Share (%), by Country 2024 & 2032
- Figure 62: Asia Pacific Global Advanced Shopping Technology Market Volume Share (%), by Country 2024 & 2032
- Figure 63: Latin America Global Advanced Shopping Technology Market Revenue (Million), by Product Type 2024 & 2032
- Figure 64: Latin America Global Advanced Shopping Technology Market Volume (K Unit), by Product Type 2024 & 2032
- Figure 65: Latin America Global Advanced Shopping Technology Market Revenue Share (%), by Product Type 2024 & 2032
- Figure 66: Latin America Global Advanced Shopping Technology Market Volume Share (%), by Product Type 2024 & 2032
- Figure 67: Latin America Global Advanced Shopping Technology Market Revenue (Million), by Application 2024 & 2032
- Figure 68: Latin America Global Advanced Shopping Technology Market Volume (K Unit), by Application 2024 & 2032
- Figure 69: Latin America Global Advanced Shopping Technology Market Revenue Share (%), by Application 2024 & 2032
- Figure 70: Latin America Global Advanced Shopping Technology Market Volume Share (%), by Application 2024 & 2032
- Figure 71: Latin America Global Advanced Shopping Technology Market Revenue (Million), by Country 2024 & 2032
- Figure 72: Latin America Global Advanced Shopping Technology Market Volume (K Unit), by Country 2024 & 2032
- Figure 73: Latin America Global Advanced Shopping Technology Market Revenue Share (%), by Country 2024 & 2032
- Figure 74: Latin America Global Advanced Shopping Technology Market Volume Share (%), by Country 2024 & 2032
- Figure 75: Middle East and Africa Global Advanced Shopping Technology Market Revenue (Million), by Product Type 2024 & 2032
- Figure 76: Middle East and Africa Global Advanced Shopping Technology Market Volume (K Unit), by Product Type 2024 & 2032
- Figure 77: Middle East and Africa Global Advanced Shopping Technology Market Revenue Share (%), by Product Type 2024 & 2032
- Figure 78: Middle East and Africa Global Advanced Shopping Technology Market Volume Share (%), by Product Type 2024 & 2032
- Figure 79: Middle East and Africa Global Advanced Shopping Technology Market Revenue (Million), by Application 2024 & 2032
- Figure 80: Middle East and Africa Global Advanced Shopping Technology Market Volume (K Unit), by Application 2024 & 2032
- Figure 81: Middle East and Africa Global Advanced Shopping Technology Market Revenue Share (%), by Application 2024 & 2032
- Figure 82: Middle East and Africa Global Advanced Shopping Technology Market Volume Share (%), by Application 2024 & 2032
- Figure 83: Middle East and Africa Global Advanced Shopping Technology Market Revenue (Million), by Country 2024 & 2032
- Figure 84: Middle East and Africa Global Advanced Shopping Technology Market Volume (K Unit), by Country 2024 & 2032
- Figure 85: Middle East and Africa Global Advanced Shopping Technology Market Revenue Share (%), by Country 2024 & 2032
- Figure 86: Middle East and Africa Global Advanced Shopping Technology Market Volume Share (%), by Country 2024 & 2032
List of Tables
- Table 1: Global Advanced Shopping Technology Market Revenue Million Forecast, by Region 2019 & 2032
- Table 2: Global Advanced Shopping Technology Market Volume K Unit Forecast, by Region 2019 & 2032
- Table 3: Global Advanced Shopping Technology Market Revenue Million Forecast, by Product Type 2019 & 2032
- Table 4: Global Advanced Shopping Technology Market Volume K Unit Forecast, by Product Type 2019 & 2032
- Table 5: Global Advanced Shopping Technology Market Revenue Million Forecast, by Application 2019 & 2032
- Table 6: Global Advanced Shopping Technology Market Volume K Unit Forecast, by Application 2019 & 2032
- Table 7: Global Advanced Shopping Technology Market Revenue Million Forecast, by Region 2019 & 2032
- Table 8: Global Advanced Shopping Technology Market Volume K Unit Forecast, by Region 2019 & 2032
- Table 9: Global Advanced Shopping Technology Market Revenue Million Forecast, by Country 2019 & 2032
- Table 10: Global Advanced Shopping Technology Market Volume K Unit Forecast, by Country 2019 & 2032
- Table 11: United States Global Advanced Shopping Technology Market Revenue (Million) Forecast, by Application 2019 & 2032
- Table 12: United States Global Advanced Shopping Technology Market Volume (K Unit) Forecast, by Application 2019 & 2032
- Table 13: Canada Global Advanced Shopping Technology Market Revenue (Million) Forecast, by Application 2019 & 2032
- Table 14: Canada Global Advanced Shopping Technology Market Volume (K Unit) Forecast, by Application 2019 & 2032
- Table 15: Mexico Global Advanced Shopping Technology Market Revenue (Million) Forecast, by Application 2019 & 2032
- Table 16: Mexico Global Advanced Shopping Technology Market Volume (K Unit) Forecast, by Application 2019 & 2032
- Table 17: Global Advanced Shopping Technology Market Revenue Million Forecast, by Country 2019 & 2032
- Table 18: Global Advanced Shopping Technology Market Volume K Unit Forecast, by Country 2019 & 2032
- Table 19: Germany Global Advanced Shopping Technology Market Revenue (Million) Forecast, by Application 2019 & 2032
- Table 20: Germany Global Advanced Shopping Technology Market Volume (K Unit) Forecast, by Application 2019 & 2032
- Table 21: United Kingdom Global Advanced Shopping Technology Market Revenue (Million) Forecast, by Application 2019 & 2032
- Table 22: United Kingdom Global Advanced Shopping Technology Market Volume (K Unit) Forecast, by Application 2019 & 2032
- Table 23: France Global Advanced Shopping Technology Market Revenue (Million) Forecast, by Application 2019 & 2032
- Table 24: France Global Advanced Shopping Technology Market Volume (K Unit) Forecast, by Application 2019 & 2032
- Table 25: Spain Global Advanced Shopping Technology Market Revenue (Million) Forecast, by Application 2019 & 2032
- Table 26: Spain Global Advanced Shopping Technology Market Volume (K Unit) Forecast, by Application 2019 & 2032
- Table 27: Italy Global Advanced Shopping Technology Market Revenue (Million) Forecast, by Application 2019 & 2032
- Table 28: Italy Global Advanced Shopping Technology Market Volume (K Unit) Forecast, by Application 2019 & 2032
- Table 29: Spain Global Advanced Shopping Technology Market Revenue (Million) Forecast, by Application 2019 & 2032
- Table 30: Spain Global Advanced Shopping Technology Market Volume (K Unit) Forecast, by Application 2019 & 2032
- Table 31: Belgium Global Advanced Shopping Technology Market Revenue (Million) Forecast, by Application 2019 & 2032
- Table 32: Belgium Global Advanced Shopping Technology Market Volume (K Unit) Forecast, by Application 2019 & 2032
- Table 33: Netherland Global Advanced Shopping Technology Market Revenue (Million) Forecast, by Application 2019 & 2032
- Table 34: Netherland Global Advanced Shopping Technology Market Volume (K Unit) Forecast, by Application 2019 & 2032
- Table 35: Nordics Global Advanced Shopping Technology Market Revenue (Million) Forecast, by Application 2019 & 2032
- Table 36: Nordics Global Advanced Shopping Technology Market Volume (K Unit) Forecast, by Application 2019 & 2032
- Table 37: Rest of Europe Global Advanced Shopping Technology Market Revenue (Million) Forecast, by Application 2019 & 2032
- Table 38: Rest of Europe Global Advanced Shopping Technology Market Volume (K Unit) Forecast, by Application 2019 & 2032
- Table 39: Global Advanced Shopping Technology Market Revenue Million Forecast, by Country 2019 & 2032
- Table 40: Global Advanced Shopping Technology Market Volume K Unit Forecast, by Country 2019 & 2032
- Table 41: China Global Advanced Shopping Technology Market Revenue (Million) Forecast, by Application 2019 & 2032
- Table 42: China Global Advanced Shopping Technology Market Volume (K Unit) Forecast, by Application 2019 & 2032
- Table 43: Japan Global Advanced Shopping Technology Market Revenue (Million) Forecast, by Application 2019 & 2032
- Table 44: Japan Global Advanced Shopping Technology Market Volume (K Unit) Forecast, by Application 2019 & 2032
- Table 45: India Global Advanced Shopping Technology Market Revenue (Million) Forecast, by Application 2019 & 2032
- Table 46: India Global Advanced Shopping Technology Market Volume (K Unit) Forecast, by Application 2019 & 2032
- Table 47: South Korea Global Advanced Shopping Technology Market Revenue (Million) Forecast, by Application 2019 & 2032
- Table 48: South Korea Global Advanced Shopping Technology Market Volume (K Unit) Forecast, by Application 2019 & 2032
- Table 49: Southeast Asia Global Advanced Shopping Technology Market Revenue (Million) Forecast, by Application 2019 & 2032
- Table 50: Southeast Asia Global Advanced Shopping Technology Market Volume (K Unit) Forecast, by Application 2019 & 2032
- Table 51: Australia Global Advanced Shopping Technology Market Revenue (Million) Forecast, by Application 2019 & 2032
- Table 52: Australia Global Advanced Shopping Technology Market Volume (K Unit) Forecast, by Application 2019 & 2032
- Table 53: Indonesia Global Advanced Shopping Technology Market Revenue (Million) Forecast, by Application 2019 & 2032
- Table 54: Indonesia Global Advanced Shopping Technology Market Volume (K Unit) Forecast, by Application 2019 & 2032
- Table 55: Phillipes Global Advanced Shopping Technology Market Revenue (Million) Forecast, by Application 2019 & 2032
- Table 56: Phillipes Global Advanced Shopping Technology Market Volume (K Unit) Forecast, by Application 2019 & 2032
- Table 57: Singapore Global Advanced Shopping Technology Market Revenue (Million) Forecast, by Application 2019 & 2032
- Table 58: Singapore Global Advanced Shopping Technology Market Volume (K Unit) Forecast, by Application 2019 & 2032
- Table 59: Thailandc Global Advanced Shopping Technology Market Revenue (Million) Forecast, by Application 2019 & 2032
- Table 60: Thailandc Global Advanced Shopping Technology Market Volume (K Unit) Forecast, by Application 2019 & 2032
- Table 61: Rest of Asia Pacific Global Advanced Shopping Technology Market Revenue (Million) Forecast, by Application 2019 & 2032
- Table 62: Rest of Asia Pacific Global Advanced Shopping Technology Market Volume (K Unit) Forecast, by Application 2019 & 2032
- Table 63: Global Advanced Shopping Technology Market Revenue Million Forecast, by Country 2019 & 2032
- Table 64: Global Advanced Shopping Technology Market Volume K Unit Forecast, by Country 2019 & 2032
- Table 65: Brazil Global Advanced Shopping Technology Market Revenue (Million) Forecast, by Application 2019 & 2032
- Table 66: Brazil Global Advanced Shopping Technology Market Volume (K Unit) Forecast, by Application 2019 & 2032
- Table 67: Argentina Global Advanced Shopping Technology Market Revenue (Million) Forecast, by Application 2019 & 2032
- Table 68: Argentina Global Advanced Shopping Technology Market Volume (K Unit) Forecast, by Application 2019 & 2032
- Table 69: Peru Global Advanced Shopping Technology Market Revenue (Million) Forecast, by Application 2019 & 2032
- Table 70: Peru Global Advanced Shopping Technology Market Volume (K Unit) Forecast, by Application 2019 & 2032
- Table 71: Chile Global Advanced Shopping Technology Market Revenue (Million) Forecast, by Application 2019 & 2032
- Table 72: Chile Global Advanced Shopping Technology Market Volume (K Unit) Forecast, by Application 2019 & 2032
- Table 73: Colombia Global Advanced Shopping Technology Market Revenue (Million) Forecast, by Application 2019 & 2032
- Table 74: Colombia Global Advanced Shopping Technology Market Volume (K Unit) Forecast, by Application 2019 & 2032
- Table 75: Ecuador Global Advanced Shopping Technology Market Revenue (Million) Forecast, by Application 2019 & 2032
- Table 76: Ecuador Global Advanced Shopping Technology Market Volume (K Unit) Forecast, by Application 2019 & 2032
- Table 77: Venezuela Global Advanced Shopping Technology Market Revenue (Million) Forecast, by Application 2019 & 2032
- Table 78: Venezuela Global Advanced Shopping Technology Market Volume (K Unit) Forecast, by Application 2019 & 2032
- Table 79: Rest of South America Global Advanced Shopping Technology Market Revenue (Million) Forecast, by Application 2019 & 2032
- Table 80: Rest of South America Global Advanced Shopping Technology Market Volume (K Unit) Forecast, by Application 2019 & 2032
- Table 81: Global Advanced Shopping Technology Market Revenue Million Forecast, by Country 2019 & 2032
- Table 82: Global Advanced Shopping Technology Market Volume K Unit Forecast, by Country 2019 & 2032
- Table 83: United States Global Advanced Shopping Technology Market Revenue (Million) Forecast, by Application 2019 & 2032
- Table 84: United States Global Advanced Shopping Technology Market Volume (K Unit) Forecast, by Application 2019 & 2032
- Table 85: Canada Global Advanced Shopping Technology Market Revenue (Million) Forecast, by Application 2019 & 2032
- Table 86: Canada Global Advanced Shopping Technology Market Volume (K Unit) Forecast, by Application 2019 & 2032
- Table 87: Mexico Global Advanced Shopping Technology Market Revenue (Million) Forecast, by Application 2019 & 2032
- Table 88: Mexico Global Advanced Shopping Technology Market Volume (K Unit) Forecast, by Application 2019 & 2032
- Table 89: Global Advanced Shopping Technology Market Revenue Million Forecast, by Country 2019 & 2032
- Table 90: Global Advanced Shopping Technology Market Volume K Unit Forecast, by Country 2019 & 2032
- Table 91: United Arab Emirates Global Advanced Shopping Technology Market Revenue (Million) Forecast, by Application 2019 & 2032
- Table 92: United Arab Emirates Global Advanced Shopping Technology Market Volume (K Unit) Forecast, by Application 2019 & 2032
- Table 93: Saudi Arabia Global Advanced Shopping Technology Market Revenue (Million) Forecast, by Application 2019 & 2032
- Table 94: Saudi Arabia Global Advanced Shopping Technology Market Volume (K Unit) Forecast, by Application 2019 & 2032
- Table 95: South Africa Global Advanced Shopping Technology Market Revenue (Million) Forecast, by Application 2019 & 2032
- Table 96: South Africa Global Advanced Shopping Technology Market Volume (K Unit) Forecast, by Application 2019 & 2032
- Table 97: Rest of Middle East and Africa Global Advanced Shopping Technology Market Revenue (Million) Forecast, by Application 2019 & 2032
- Table 98: Rest of Middle East and Africa Global Advanced Shopping Technology Market Volume (K Unit) Forecast, by Application 2019 & 2032
- Table 99: Global Advanced Shopping Technology Market Revenue Million Forecast, by Product Type 2019 & 2032
- Table 100: Global Advanced Shopping Technology Market Volume K Unit Forecast, by Product Type 2019 & 2032
- Table 101: Global Advanced Shopping Technology Market Revenue Million Forecast, by Application 2019 & 2032
- Table 102: Global Advanced Shopping Technology Market Volume K Unit Forecast, by Application 2019 & 2032
- Table 103: Global Advanced Shopping Technology Market Revenue Million Forecast, by Country 2019 & 2032
- Table 104: Global Advanced Shopping Technology Market Volume K Unit Forecast, by Country 2019 & 2032
- Table 105: Global Advanced Shopping Technology Market Revenue Million Forecast, by Product Type 2019 & 2032
- Table 106: Global Advanced Shopping Technology Market Volume K Unit Forecast, by Product Type 2019 & 2032
- Table 107: Global Advanced Shopping Technology Market Revenue Million Forecast, by Application 2019 & 2032
- Table 108: Global Advanced Shopping Technology Market Volume K Unit Forecast, by Application 2019 & 2032
- Table 109: Global Advanced Shopping Technology Market Revenue Million Forecast, by Country 2019 & 2032
- Table 110: Global Advanced Shopping Technology Market Volume K Unit Forecast, by Country 2019 & 2032
- Table 111: Global Advanced Shopping Technology Market Revenue Million Forecast, by Product Type 2019 & 2032
- Table 112: Global Advanced Shopping Technology Market Volume K Unit Forecast, by Product Type 2019 & 2032
- Table 113: Global Advanced Shopping Technology Market Revenue Million Forecast, by Application 2019 & 2032
- Table 114: Global Advanced Shopping Technology Market Volume K Unit Forecast, by Application 2019 & 2032
- Table 115: Global Advanced Shopping Technology Market Revenue Million Forecast, by Country 2019 & 2032
- Table 116: Global Advanced Shopping Technology Market Volume K Unit Forecast, by Country 2019 & 2032
- Table 117: Global Advanced Shopping Technology Market Revenue Million Forecast, by Product Type 2019 & 2032
- Table 118: Global Advanced Shopping Technology Market Volume K Unit Forecast, by Product Type 2019 & 2032
- Table 119: Global Advanced Shopping Technology Market Revenue Million Forecast, by Application 2019 & 2032
- Table 120: Global Advanced Shopping Technology Market Volume K Unit Forecast, by Application 2019 & 2032
- Table 121: Global Advanced Shopping Technology Market Revenue Million Forecast, by Country 2019 & 2032
- Table 122: Global Advanced Shopping Technology Market Volume K Unit Forecast, by Country 2019 & 2032
- Table 123: Global Advanced Shopping Technology Market Revenue Million Forecast, by Product Type 2019 & 2032
- Table 124: Global Advanced Shopping Technology Market Volume K Unit Forecast, by Product Type 2019 & 2032
- Table 125: Global Advanced Shopping Technology Market Revenue Million Forecast, by Application 2019 & 2032
- Table 126: Global Advanced Shopping Technology Market Volume K Unit Forecast, by Application 2019 & 2032
- Table 127: Global Advanced Shopping Technology Market Revenue Million Forecast, by Country 2019 & 2032
- Table 128: Global Advanced Shopping Technology Market Volume K Unit Forecast, by Country 2019 & 2032
Frequently Asked Questions
1. What is the projected Compound Annual Growth Rate (CAGR) of the Global Advanced Shopping Technology Market?
The projected CAGR is approximately 12.30%.
2. Which companies are prominent players in the Global Advanced Shopping Technology Market?
Key companies in the market include Toshiba Corporation, Google LLC, Amazon com Inc, Procter & Gamble Company, Walmart Inc.
3. What are the main segments of the Global Advanced Shopping Technology Market?
The market segments include Product Type, Application.
4. Can you provide details about the market size?
The market size is estimated to be USD XX Million as of 2022.
5. What are some drivers contributing to market growth?
Increasing adoption of advance technology in retail sector; Artificial intelligence and robots in retail stores.
6. What are the notable trends driving market growth?
Increasing Adoption of Virtual Reality in the Retail Sector is Expected to Drive the Market.
7. Are there any restraints impacting market growth?
High cost of implementation of the technology.
8. Can you provide examples of recent developments in the market?
June 2021: Toshiba's Self Checkout System 7 solution, developed by Toshiba Global Commerce Solutions and Calimax, provides fast, convenient, and frictionless checkout experiences. Calimax and Toshiba are designing the checkout experiences that shoppers want, thanks to user input and a collaborative approach, resulting in more checkout alternatives for customers and more sales.
9. What pricing options are available for accessing the report?
Pricing options include single-user, multi-user, and enterprise licenses priced at USD 4750, USD 5250, and USD 8750 respectively.
10. Is the market size provided in terms of value or volume?
The market size is provided in terms of value, measured in Million and volume, measured in K Unit.
11. Are there any specific market keywords associated with the report?
Yes, the market keyword associated with the report is "Global Advanced Shopping Technology Market," which aids in identifying and referencing the specific market segment covered.
12. How do I determine which pricing option suits my needs best?
The pricing options vary based on user requirements and access needs. Individual users may opt for single-user licenses, while businesses requiring broader access may choose multi-user or enterprise licenses for cost-effective access to the report.
13. Are there any additional resources or data provided in the Global Advanced Shopping Technology Market report?
While the report offers comprehensive insights, it's advisable to review the specific contents or supplementary materials provided to ascertain if additional resources or data are available.
14. How can I stay updated on further developments or reports in the Global Advanced Shopping Technology Market?
To stay informed about further developments, trends, and reports in the Global Advanced Shopping Technology Market, consider subscribing to industry newsletters, following relevant companies and organizations, or regularly checking reputable industry news sources and publications.
Methodology
Step 1 - Identification of Relevant Samples Size from Population Database


Step 2 - Approaches for Defining Global Market Size (Value, Volume* & Price*)

Note*: In applicable scenarios
Step 3 - Data Sources
Primary Research
- Web Analytics
- Survey Reports
- Research Institute
- Latest Research Reports
- Opinion Leaders
Secondary Research
- Annual Reports
- White Paper
- Latest Press Release
- Industry Association
- Paid Database
- Investor Presentations

Step 4 - Data Triangulation
Involves using different sources of information in order to increase the validity of a study
These sources are likely to be stakeholders in a program - participants, other researchers, program staff, other community members, and so on.
Then we put all data in single framework & apply various statistical tools to find out the dynamic on the market.
During the analysis stage, feedback from the stakeholder groups would be compared to determine areas of agreement as well as areas of divergence
