

Key Insights
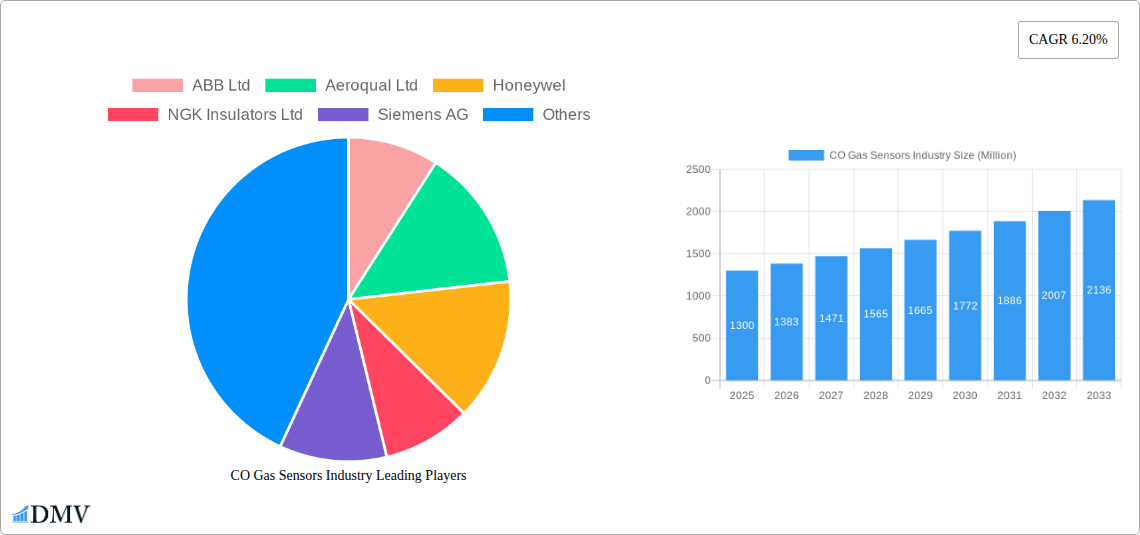
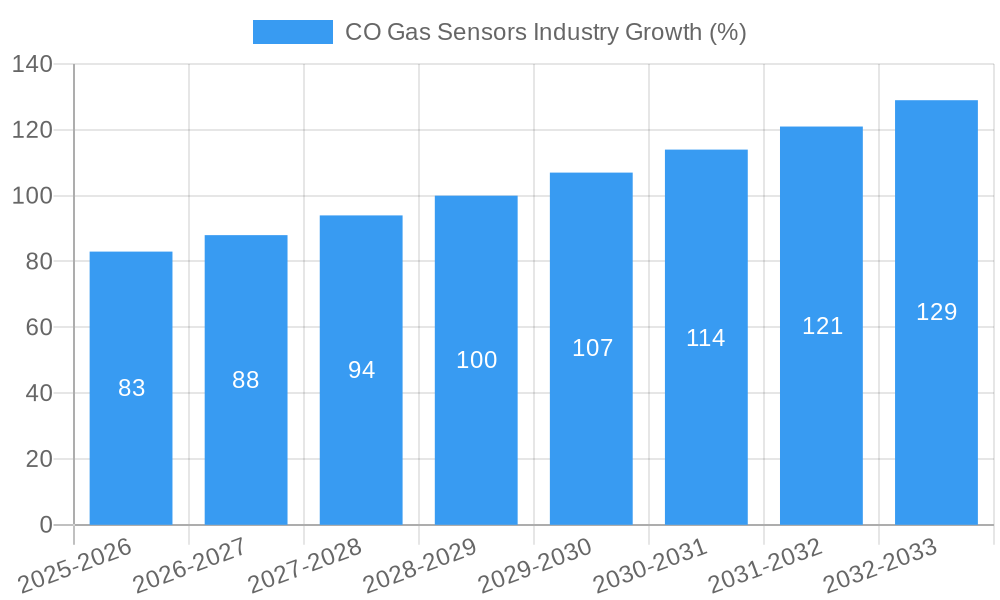
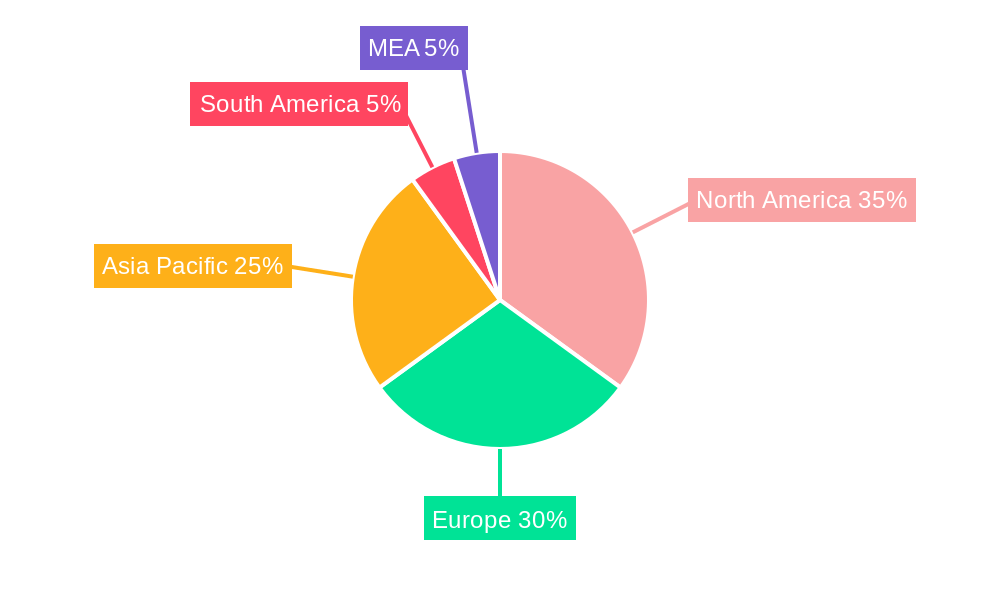
The global CO gas sensor market, valued at $1.30 billion in 2025, is projected to experience robust growth, driven by increasing environmental regulations, the expanding industrial automation sector, and rising safety concerns across various applications. A compound annual growth rate (CAGR) of 6.20% from 2025 to 2033 indicates a significant market expansion. Key growth drivers include the burgeoning automotive industry's demand for advanced emission control systems, the need for improved safety measures in buildings and industrial facilities, and the escalating adoption of smart home technologies incorporating CO detection. The semiconductor sensor technology segment is expected to maintain its dominance due to its high accuracy, sensitivity, and cost-effectiveness. However, advancements in electrochemical and solid-state sensor technologies are expected to challenge this dominance in the coming years, driven by their improved longevity and reduced maintenance requirements. The medical and industrial sectors are currently the largest application segments, though growth is anticipated in the building automation and environmental monitoring sectors, fuelled by increasing awareness of CO poisoning risks and stringent air quality standards. Geographic distribution shows strong market presence in North America and Europe, although rapid industrialization in Asia-Pacific is poised to drive significant future growth within that region. Competitive landscape analysis reveals a mix of established players and emerging technology companies, fostering innovation and ensuring competitive pricing.
Market restraints include the relatively high initial investment costs for advanced sensor technologies in certain applications, alongside the need for regular calibration and maintenance. However, the long-term benefits of improved safety and compliance outweigh these challenges. The market's future trajectory hinges on ongoing technological advancements that improve sensor accuracy, reliability, and longevity while simultaneously reducing production costs. The integration of CO sensors into Internet of Things (IoT) platforms presents further opportunities for enhanced monitoring, data analytics, and proactive safety measures. Furthermore, the development of miniaturized and low-power CO sensors will be critical in expanding their application in portable devices and wearable technology, further propelling market growth in the forecast period.
CO Gas Sensors Industry Market Report: 2019-2033
This comprehensive report provides a detailed analysis of the global CO Gas Sensors industry, offering invaluable insights for stakeholders seeking to understand market dynamics, technological advancements, and future growth opportunities. The report covers the period 2019-2033, with a focus on the 2025-2033 forecast period, and utilizes data from the base year 2025. The market is valued at xx Million in 2025 and is projected to reach xx Million by 2033, exhibiting a CAGR of xx%.
CO Gas Sensors Industry Market Composition & Trends
The CO Gas Sensors market is a dynamic landscape shaped by technological innovation, stringent regulations, and evolving end-user demands. Market concentration is moderately high, with key players like ABB Ltd, Honeywell, and Siemens AG holding significant market share. However, the emergence of smaller, specialized companies is increasing competition. The market share distribution in 2025 is estimated as follows: ABB Ltd (xx%), Honeywell (xx%), Siemens AG (xx%), and Others (xx%). Innovation is driven by the need for higher sensitivity, improved accuracy, and miniaturization. Regulatory landscapes, particularly concerning environmental monitoring and safety standards, are significant drivers of market growth. Substitute products, such as optical sensors, are emerging but have yet to significantly impact the market dominance of CO gas sensors. The most prominent end-users include the industrial, automotive, and environmental monitoring sectors. M&A activities have been relatively moderate in recent years, with deal values totaling approximately xx Million in the last five years. Specific examples include [insert details of any major M&A deals].
- Market Concentration: Moderately high, with a few major players dominating.
- Innovation Catalysts: Demand for higher sensitivity, accuracy, miniaturization.
- Regulatory Landscape: Stringent environmental and safety standards driving adoption.
- Substitute Products: Optical sensors emerging as potential competitors.
- End-User Profiles: Industrial, automotive, environmental monitoring sectors dominate.
- M&A Activity: Moderate, with total deal values around xx Million in the past five years.
CO Gas Sensors Industry Industry Evolution
The CO Gas Sensors industry has witnessed significant evolution during the historical period (2019-2024). Market growth has been driven by increasing environmental concerns, stricter emission regulations, and the expanding adoption of CO gas sensors in various applications. Technological advancements, particularly in semiconductor and electrochemical sensor technologies, have enabled the development of more accurate, reliable, and cost-effective devices. Consumer demand has shifted towards smaller, more energy-efficient sensors with improved lifespan and lower maintenance requirements. The market experienced a growth rate of xx% from 2019 to 2024. Adoption rates in key sectors, like automotive and industrial applications, have increased significantly, exceeding xx% during this period. The forecast period (2025-2033) anticipates continued growth, driven by technological innovation, expanding applications, and favorable regulatory support, including initiatives to improve air quality and safety. This is expected to translate to a compound annual growth rate (CAGR) of xx% during the forecast period.
Leading Regions, Countries, or Segments in CO Gas Sensors Industry
The dominant region for CO Gas Sensors is currently North America, driven by stringent environmental regulations and a robust industrial sector. Within this region, the United States holds the largest market share. Other key regions include Europe and Asia-Pacific. Within the technology segments, Electrochemical Sensors and Semiconductor Sensors currently hold the largest market share, due to their cost-effectiveness and wide applicability. Among applications, the Industrial and Automotive sectors are major drivers of growth.
- Key Drivers (North America): Stringent environmental regulations, large industrial sector, high disposable income.
- Key Drivers (Europe): Stringent emissions standards, growth in the automotive and building automation sectors.
- Key Drivers (Asia-Pacific): Rapid industrialization, increasing environmental awareness, government support for clean energy initiatives.
- Dominant Technology Segments: Electrochemical Sensors and Semiconductor Sensors.
- Dominant Application Segments: Industrial and Automotive.
CO Gas Sensors Industry Product Innovations
Recent innovations in CO gas sensors focus on enhancing sensitivity, selectivity, and reducing power consumption. Miniaturization and integration with other sensors and communication technologies are also key trends. The development of MEMS-based sensors, as seen in Teledyne's OLCT 100-XP-MS, exemplifies this trend. These advancements offer enhanced performance, improved reliability, and the ability to operate in diverse and challenging environments, broadening the scope of applications and expanding market opportunities.
Propelling Factors for CO Gas Sensors Industry Growth
Several factors are propelling the growth of the CO Gas Sensors industry. Stringent environmental regulations globally are forcing increased adoption of these sensors in various applications, particularly in automotive emissions control and industrial safety. The increasing demand for improved air quality monitoring in both indoor and outdoor environments also fuels market growth. Technological advancements leading to smaller, more efficient, and cost-effective sensors contribute significantly to expansion. Furthermore, rising investments in research and development are driving innovation, pushing the boundaries of performance and application.
Obstacles in the CO Gas Sensors Industry Market
Despite the positive growth trajectory, the CO Gas Sensors industry faces some challenges. Fluctuations in raw material prices can impact production costs and profitability. Supply chain disruptions can affect the availability of essential components, hindering production. Intense competition from established players and emerging companies puts pressure on pricing and margins. Regulatory complexities and varying standards across different regions can add operational challenges. These challenges could, cumulatively, impact market expansion by an estimated xx%.
Future Opportunities in CO Gas Sensors Industry
The future of the CO Gas Sensors industry looks bright. Emerging applications in portable and wearable health monitoring devices offer significant opportunities. The development of more sophisticated sensor systems for environmental monitoring, including greenhouse gas detection (as highlighted by NASA’s recent developments), promises further growth. Advances in sensor technology will improve accuracy, selectivity, and longevity, driving demand. The integration of AI and IoT technologies will lead to more intelligent sensor networks, capable of real-time monitoring and data analysis.
Major Players in the CO Gas Sensors Industry Ecosystem
- ABB Ltd
- Aeroqual Ltd
- Honeywell
- NGK Insulators Ltd
- Siemens AG
- Trolex Ltd
- Alphasense
- GfG Europe Ltd
- Robert Bosch GmbH
- Yokogawa Electric Corporation
- Dynament Ltd
Key Developments in CO Gas Sensors Industry Industry
- March 2024: Teledyne Gas and Flame Detection launched the OLCT 100-XP-MS range of flammable gas detectors, featuring cutting-edge MEMS sensor technology, offering a holistic solution for flammable gas detection. This launch signifies a significant advancement in sensor technology and could redefine the market landscape.
- September 2023: NASA's greenhouse gas detector moved closer to launch, supported by CarbonMapper. This development indicates growing interest in advanced gas detection for environmental monitoring and will stimulate demand for high-precision sensors in this field.
Strategic CO Gas Sensors Industry Market Forecast
The CO Gas Sensors market is poised for robust growth throughout the forecast period (2025-2033). Technological innovation, increasing environmental awareness, and supportive regulatory landscapes will drive market expansion. Emerging applications in various sectors, coupled with the integration of AI and IoT technologies, will further boost demand. The market's potential is significant, offering substantial opportunities for industry players to capitalize on this expanding market.
CO Gas Sensors Industry Segmentation
-
1. Technology
- 1.1. Semiconductor Sensor
- 1.2. Electrochemical Sensor
- 1.3. Solid State/MOS Sensor
- 1.4. PID
- 1.5. Catalytic
- 1.6. Infrared
-
2. Application
- 2.1. Medical
- 2.2. Petrochemical
- 2.3. Building Automation
- 2.4. Industrial
- 2.5. Environmental
- 2.6. Automotive
- 2.7. Other Applications
CO Gas Sensors Industry Segmentation By Geography
- 1. North America
- 2. Europe
- 3. Asia
- 4. Australia and New Zealand
- 5. Latin America
- 6. Middle East and Africa
CO Gas Sensors Industry REPORT HIGHLIGHTS
| Aspects | Details |
|---|---|
| Study Period | 2019-2033 |
| Base Year | 2024 |
| Estimated Year | 2025 |
| Forecast Period | 2025-2033 |
| Historical Period | 2019-2024 |
| Growth Rate | CAGR of 6.20% from 2019-2033 |
| Segmentation |
|
Table of Contents
- 1. Introduction
- 1.1. Research Scope
- 1.2. Market Segmentation
- 1.3. Research Methodology
- 1.4. Definitions and Assumptions
- 2. Executive Summary
- 2.1. Introduction
- 3. Market Dynamics
- 3.1. Introduction
- 3.2. Market Drivers
- 3.2.1. Government Regulations to Ensure Safety in Work Places; Increasing Need for Emission Control Standards
- 3.3. Market Restrains
- 3.3.1. Lack of Awareness of Safety Gains in SME; Cost of Maintenance and Low Product Differentiation
- 3.4. Market Trends
- 3.4.1. The Petrochemical Segment to Witness Growth
- 4. Market Factor Analysis
- 4.1. Porters Five Forces
- 4.2. Supply/Value Chain
- 4.3. PESTEL analysis
- 4.4. Market Entropy
- 4.5. Patent/Trademark Analysis
- 5. Global CO Gas Sensors Industry Analysis, Insights and Forecast, 2019-2031
- 5.1. Market Analysis, Insights and Forecast - by Technology
- 5.1.1. Semiconductor Sensor
- 5.1.2. Electrochemical Sensor
- 5.1.3. Solid State/MOS Sensor
- 5.1.4. PID
- 5.1.5. Catalytic
- 5.1.6. Infrared
- 5.2. Market Analysis, Insights and Forecast - by Application
- 5.2.1. Medical
- 5.2.2. Petrochemical
- 5.2.3. Building Automation
- 5.2.4. Industrial
- 5.2.5. Environmental
- 5.2.6. Automotive
- 5.2.7. Other Applications
- 5.3. Market Analysis, Insights and Forecast - by Region
- 5.3.1. North America
- 5.3.2. Europe
- 5.3.3. Asia
- 5.3.4. Australia and New Zealand
- 5.3.5. Latin America
- 5.3.6. Middle East and Africa
- 5.1. Market Analysis, Insights and Forecast - by Technology
- 6. North America CO Gas Sensors Industry Analysis, Insights and Forecast, 2019-2031
- 6.1. Market Analysis, Insights and Forecast - by Technology
- 6.1.1. Semiconductor Sensor
- 6.1.2. Electrochemical Sensor
- 6.1.3. Solid State/MOS Sensor
- 6.1.4. PID
- 6.1.5. Catalytic
- 6.1.6. Infrared
- 6.2. Market Analysis, Insights and Forecast - by Application
- 6.2.1. Medical
- 6.2.2. Petrochemical
- 6.2.3. Building Automation
- 6.2.4. Industrial
- 6.2.5. Environmental
- 6.2.6. Automotive
- 6.2.7. Other Applications
- 6.1. Market Analysis, Insights and Forecast - by Technology
- 7. Europe CO Gas Sensors Industry Analysis, Insights and Forecast, 2019-2031
- 7.1. Market Analysis, Insights and Forecast - by Technology
- 7.1.1. Semiconductor Sensor
- 7.1.2. Electrochemical Sensor
- 7.1.3. Solid State/MOS Sensor
- 7.1.4. PID
- 7.1.5. Catalytic
- 7.1.6. Infrared
- 7.2. Market Analysis, Insights and Forecast - by Application
- 7.2.1. Medical
- 7.2.2. Petrochemical
- 7.2.3. Building Automation
- 7.2.4. Industrial
- 7.2.5. Environmental
- 7.2.6. Automotive
- 7.2.7. Other Applications
- 7.1. Market Analysis, Insights and Forecast - by Technology
- 8. Asia CO Gas Sensors Industry Analysis, Insights and Forecast, 2019-2031
- 8.1. Market Analysis, Insights and Forecast - by Technology
- 8.1.1. Semiconductor Sensor
- 8.1.2. Electrochemical Sensor
- 8.1.3. Solid State/MOS Sensor
- 8.1.4. PID
- 8.1.5. Catalytic
- 8.1.6. Infrared
- 8.2. Market Analysis, Insights and Forecast - by Application
- 8.2.1. Medical
- 8.2.2. Petrochemical
- 8.2.3. Building Automation
- 8.2.4. Industrial
- 8.2.5. Environmental
- 8.2.6. Automotive
- 8.2.7. Other Applications
- 8.1. Market Analysis, Insights and Forecast - by Technology
- 9. Australia and New Zealand CO Gas Sensors Industry Analysis, Insights and Forecast, 2019-2031
- 9.1. Market Analysis, Insights and Forecast - by Technology
- 9.1.1. Semiconductor Sensor
- 9.1.2. Electrochemical Sensor
- 9.1.3. Solid State/MOS Sensor
- 9.1.4. PID
- 9.1.5. Catalytic
- 9.1.6. Infrared
- 9.2. Market Analysis, Insights and Forecast - by Application
- 9.2.1. Medical
- 9.2.2. Petrochemical
- 9.2.3. Building Automation
- 9.2.4. Industrial
- 9.2.5. Environmental
- 9.2.6. Automotive
- 9.2.7. Other Applications
- 9.1. Market Analysis, Insights and Forecast - by Technology
- 10. Latin America CO Gas Sensors Industry Analysis, Insights and Forecast, 2019-2031
- 10.1. Market Analysis, Insights and Forecast - by Technology
- 10.1.1. Semiconductor Sensor
- 10.1.2. Electrochemical Sensor
- 10.1.3. Solid State/MOS Sensor
- 10.1.4. PID
- 10.1.5. Catalytic
- 10.1.6. Infrared
- 10.2. Market Analysis, Insights and Forecast - by Application
- 10.2.1. Medical
- 10.2.2. Petrochemical
- 10.2.3. Building Automation
- 10.2.4. Industrial
- 10.2.5. Environmental
- 10.2.6. Automotive
- 10.2.7. Other Applications
- 10.1. Market Analysis, Insights and Forecast - by Technology
- 11. Middle East and Africa CO Gas Sensors Industry Analysis, Insights and Forecast, 2019-2031
- 11.1. Market Analysis, Insights and Forecast - by Technology
- 11.1.1. Semiconductor Sensor
- 11.1.2. Electrochemical Sensor
- 11.1.3. Solid State/MOS Sensor
- 11.1.4. PID
- 11.1.5. Catalytic
- 11.1.6. Infrared
- 11.2. Market Analysis, Insights and Forecast - by Application
- 11.2.1. Medical
- 11.2.2. Petrochemical
- 11.2.3. Building Automation
- 11.2.4. Industrial
- 11.2.5. Environmental
- 11.2.6. Automotive
- 11.2.7. Other Applications
- 11.1. Market Analysis, Insights and Forecast - by Technology
- 12. North America CO Gas Sensors Industry Analysis, Insights and Forecast, 2019-2031
- 12.1. Market Analysis, Insights and Forecast - By Country/Sub-region
- 12.1.1 United States
- 12.1.2 Canada
- 12.1.3 Mexico
- 13. Europe CO Gas Sensors Industry Analysis, Insights and Forecast, 2019-2031
- 13.1. Market Analysis, Insights and Forecast - By Country/Sub-region
- 13.1.1 Germany
- 13.1.2 United Kingdom
- 13.1.3 France
- 13.1.4 Spain
- 13.1.5 Italy
- 13.1.6 Spain
- 13.1.7 Belgium
- 13.1.8 Netherland
- 13.1.9 Nordics
- 13.1.10 Rest of Europe
- 14. Asia Pacific CO Gas Sensors Industry Analysis, Insights and Forecast, 2019-2031
- 14.1. Market Analysis, Insights and Forecast - By Country/Sub-region
- 14.1.1 China
- 14.1.2 Japan
- 14.1.3 India
- 14.1.4 South Korea
- 14.1.5 Southeast Asia
- 14.1.6 Australia
- 14.1.7 Indonesia
- 14.1.8 Phillipes
- 14.1.9 Singapore
- 14.1.10 Thailandc
- 14.1.11 Rest of Asia Pacific
- 15. South America CO Gas Sensors Industry Analysis, Insights and Forecast, 2019-2031
- 15.1. Market Analysis, Insights and Forecast - By Country/Sub-region
- 15.1.1 Brazil
- 15.1.2 Argentina
- 15.1.3 Peru
- 15.1.4 Chile
- 15.1.5 Colombia
- 15.1.6 Ecuador
- 15.1.7 Venezuela
- 15.1.8 Rest of South America
- 16. North America CO Gas Sensors Industry Analysis, Insights and Forecast, 2019-2031
- 16.1. Market Analysis, Insights and Forecast - By Country/Sub-region
- 16.1.1 United States
- 16.1.2 Canada
- 16.1.3 Mexico
- 17. MEA CO Gas Sensors Industry Analysis, Insights and Forecast, 2019-2031
- 17.1. Market Analysis, Insights and Forecast - By Country/Sub-region
- 17.1.1 United Arab Emirates
- 17.1.2 Saudi Arabia
- 17.1.3 South Africa
- 17.1.4 Rest of Middle East and Africa
- 18. Competitive Analysis
- 18.1. Global Market Share Analysis 2024
- 18.2. Company Profiles
- 18.2.1 ABB Ltd
- 18.2.1.1. Overview
- 18.2.1.2. Products
- 18.2.1.3. SWOT Analysis
- 18.2.1.4. Recent Developments
- 18.2.1.5. Financials (Based on Availability)
- 18.2.2 Aeroqual Ltd
- 18.2.2.1. Overview
- 18.2.2.2. Products
- 18.2.2.3. SWOT Analysis
- 18.2.2.4. Recent Developments
- 18.2.2.5. Financials (Based on Availability)
- 18.2.3 Honeywel
- 18.2.3.1. Overview
- 18.2.3.2. Products
- 18.2.3.3. SWOT Analysis
- 18.2.3.4. Recent Developments
- 18.2.3.5. Financials (Based on Availability)
- 18.2.4 NGK Insulators Ltd
- 18.2.4.1. Overview
- 18.2.4.2. Products
- 18.2.4.3. SWOT Analysis
- 18.2.4.4. Recent Developments
- 18.2.4.5. Financials (Based on Availability)
- 18.2.5 Siemens AG
- 18.2.5.1. Overview
- 18.2.5.2. Products
- 18.2.5.3. SWOT Analysis
- 18.2.5.4. Recent Developments
- 18.2.5.5. Financials (Based on Availability)
- 18.2.6 Trolex Ltd
- 18.2.6.1. Overview
- 18.2.6.2. Products
- 18.2.6.3. SWOT Analysis
- 18.2.6.4. Recent Developments
- 18.2.6.5. Financials (Based on Availability)
- 18.2.7 Alphasense
- 18.2.7.1. Overview
- 18.2.7.2. Products
- 18.2.7.3. SWOT Analysis
- 18.2.7.4. Recent Developments
- 18.2.7.5. Financials (Based on Availability)
- 18.2.8 GfG Europe Ltd
- 18.2.8.1. Overview
- 18.2.8.2. Products
- 18.2.8.3. SWOT Analysis
- 18.2.8.4. Recent Developments
- 18.2.8.5. Financials (Based on Availability)
- 18.2.9 Robert Bosch GmbH
- 18.2.9.1. Overview
- 18.2.9.2. Products
- 18.2.9.3. SWOT Analysis
- 18.2.9.4. Recent Developments
- 18.2.9.5. Financials (Based on Availability)
- 18.2.10 Yokogawa Electric Corporation
- 18.2.10.1. Overview
- 18.2.10.2. Products
- 18.2.10.3. SWOT Analysis
- 18.2.10.4. Recent Developments
- 18.2.10.5. Financials (Based on Availability)
- 18.2.11 Dynament Ltd
- 18.2.11.1. Overview
- 18.2.11.2. Products
- 18.2.11.3. SWOT Analysis
- 18.2.11.4. Recent Developments
- 18.2.11.5. Financials (Based on Availability)
- 18.2.1 ABB Ltd
List of Figures
- Figure 1: Global CO Gas Sensors Industry Revenue Breakdown (Million, %) by Region 2024 & 2032
- Figure 2: Global CO Gas Sensors Industry Volume Breakdown (K Unit, %) by Region 2024 & 2032
- Figure 3: North America CO Gas Sensors Industry Revenue (Million), by Country 2024 & 2032
- Figure 4: North America CO Gas Sensors Industry Volume (K Unit), by Country 2024 & 2032
- Figure 5: North America CO Gas Sensors Industry Revenue Share (%), by Country 2024 & 2032
- Figure 6: North America CO Gas Sensors Industry Volume Share (%), by Country 2024 & 2032
- Figure 7: Europe CO Gas Sensors Industry Revenue (Million), by Country 2024 & 2032
- Figure 8: Europe CO Gas Sensors Industry Volume (K Unit), by Country 2024 & 2032
- Figure 9: Europe CO Gas Sensors Industry Revenue Share (%), by Country 2024 & 2032
- Figure 10: Europe CO Gas Sensors Industry Volume Share (%), by Country 2024 & 2032
- Figure 11: Asia Pacific CO Gas Sensors Industry Revenue (Million), by Country 2024 & 2032
- Figure 12: Asia Pacific CO Gas Sensors Industry Volume (K Unit), by Country 2024 & 2032
- Figure 13: Asia Pacific CO Gas Sensors Industry Revenue Share (%), by Country 2024 & 2032
- Figure 14: Asia Pacific CO Gas Sensors Industry Volume Share (%), by Country 2024 & 2032
- Figure 15: South America CO Gas Sensors Industry Revenue (Million), by Country 2024 & 2032
- Figure 16: South America CO Gas Sensors Industry Volume (K Unit), by Country 2024 & 2032
- Figure 17: South America CO Gas Sensors Industry Revenue Share (%), by Country 2024 & 2032
- Figure 18: South America CO Gas Sensors Industry Volume Share (%), by Country 2024 & 2032
- Figure 19: North America CO Gas Sensors Industry Revenue (Million), by Country 2024 & 2032
- Figure 20: North America CO Gas Sensors Industry Volume (K Unit), by Country 2024 & 2032
- Figure 21: North America CO Gas Sensors Industry Revenue Share (%), by Country 2024 & 2032
- Figure 22: North America CO Gas Sensors Industry Volume Share (%), by Country 2024 & 2032
- Figure 23: MEA CO Gas Sensors Industry Revenue (Million), by Country 2024 & 2032
- Figure 24: MEA CO Gas Sensors Industry Volume (K Unit), by Country 2024 & 2032
- Figure 25: MEA CO Gas Sensors Industry Revenue Share (%), by Country 2024 & 2032
- Figure 26: MEA CO Gas Sensors Industry Volume Share (%), by Country 2024 & 2032
- Figure 27: North America CO Gas Sensors Industry Revenue (Million), by Technology 2024 & 2032
- Figure 28: North America CO Gas Sensors Industry Volume (K Unit), by Technology 2024 & 2032
- Figure 29: North America CO Gas Sensors Industry Revenue Share (%), by Technology 2024 & 2032
- Figure 30: North America CO Gas Sensors Industry Volume Share (%), by Technology 2024 & 2032
- Figure 31: North America CO Gas Sensors Industry Revenue (Million), by Application 2024 & 2032
- Figure 32: North America CO Gas Sensors Industry Volume (K Unit), by Application 2024 & 2032
- Figure 33: North America CO Gas Sensors Industry Revenue Share (%), by Application 2024 & 2032
- Figure 34: North America CO Gas Sensors Industry Volume Share (%), by Application 2024 & 2032
- Figure 35: North America CO Gas Sensors Industry Revenue (Million), by Country 2024 & 2032
- Figure 36: North America CO Gas Sensors Industry Volume (K Unit), by Country 2024 & 2032
- Figure 37: North America CO Gas Sensors Industry Revenue Share (%), by Country 2024 & 2032
- Figure 38: North America CO Gas Sensors Industry Volume Share (%), by Country 2024 & 2032
- Figure 39: Europe CO Gas Sensors Industry Revenue (Million), by Technology 2024 & 2032
- Figure 40: Europe CO Gas Sensors Industry Volume (K Unit), by Technology 2024 & 2032
- Figure 41: Europe CO Gas Sensors Industry Revenue Share (%), by Technology 2024 & 2032
- Figure 42: Europe CO Gas Sensors Industry Volume Share (%), by Technology 2024 & 2032
- Figure 43: Europe CO Gas Sensors Industry Revenue (Million), by Application 2024 & 2032
- Figure 44: Europe CO Gas Sensors Industry Volume (K Unit), by Application 2024 & 2032
- Figure 45: Europe CO Gas Sensors Industry Revenue Share (%), by Application 2024 & 2032
- Figure 46: Europe CO Gas Sensors Industry Volume Share (%), by Application 2024 & 2032
- Figure 47: Europe CO Gas Sensors Industry Revenue (Million), by Country 2024 & 2032
- Figure 48: Europe CO Gas Sensors Industry Volume (K Unit), by Country 2024 & 2032
- Figure 49: Europe CO Gas Sensors Industry Revenue Share (%), by Country 2024 & 2032
- Figure 50: Europe CO Gas Sensors Industry Volume Share (%), by Country 2024 & 2032
- Figure 51: Asia CO Gas Sensors Industry Revenue (Million), by Technology 2024 & 2032
- Figure 52: Asia CO Gas Sensors Industry Volume (K Unit), by Technology 2024 & 2032
- Figure 53: Asia CO Gas Sensors Industry Revenue Share (%), by Technology 2024 & 2032
- Figure 54: Asia CO Gas Sensors Industry Volume Share (%), by Technology 2024 & 2032
- Figure 55: Asia CO Gas Sensors Industry Revenue (Million), by Application 2024 & 2032
- Figure 56: Asia CO Gas Sensors Industry Volume (K Unit), by Application 2024 & 2032
- Figure 57: Asia CO Gas Sensors Industry Revenue Share (%), by Application 2024 & 2032
- Figure 58: Asia CO Gas Sensors Industry Volume Share (%), by Application 2024 & 2032
- Figure 59: Asia CO Gas Sensors Industry Revenue (Million), by Country 2024 & 2032
- Figure 60: Asia CO Gas Sensors Industry Volume (K Unit), by Country 2024 & 2032
- Figure 61: Asia CO Gas Sensors Industry Revenue Share (%), by Country 2024 & 2032
- Figure 62: Asia CO Gas Sensors Industry Volume Share (%), by Country 2024 & 2032
- Figure 63: Australia and New Zealand CO Gas Sensors Industry Revenue (Million), by Technology 2024 & 2032
- Figure 64: Australia and New Zealand CO Gas Sensors Industry Volume (K Unit), by Technology 2024 & 2032
- Figure 65: Australia and New Zealand CO Gas Sensors Industry Revenue Share (%), by Technology 2024 & 2032
- Figure 66: Australia and New Zealand CO Gas Sensors Industry Volume Share (%), by Technology 2024 & 2032
- Figure 67: Australia and New Zealand CO Gas Sensors Industry Revenue (Million), by Application 2024 & 2032
- Figure 68: Australia and New Zealand CO Gas Sensors Industry Volume (K Unit), by Application 2024 & 2032
- Figure 69: Australia and New Zealand CO Gas Sensors Industry Revenue Share (%), by Application 2024 & 2032
- Figure 70: Australia and New Zealand CO Gas Sensors Industry Volume Share (%), by Application 2024 & 2032
- Figure 71: Australia and New Zealand CO Gas Sensors Industry Revenue (Million), by Country 2024 & 2032
- Figure 72: Australia and New Zealand CO Gas Sensors Industry Volume (K Unit), by Country 2024 & 2032
- Figure 73: Australia and New Zealand CO Gas Sensors Industry Revenue Share (%), by Country 2024 & 2032
- Figure 74: Australia and New Zealand CO Gas Sensors Industry Volume Share (%), by Country 2024 & 2032
- Figure 75: Latin America CO Gas Sensors Industry Revenue (Million), by Technology 2024 & 2032
- Figure 76: Latin America CO Gas Sensors Industry Volume (K Unit), by Technology 2024 & 2032
- Figure 77: Latin America CO Gas Sensors Industry Revenue Share (%), by Technology 2024 & 2032
- Figure 78: Latin America CO Gas Sensors Industry Volume Share (%), by Technology 2024 & 2032
- Figure 79: Latin America CO Gas Sensors Industry Revenue (Million), by Application 2024 & 2032
- Figure 80: Latin America CO Gas Sensors Industry Volume (K Unit), by Application 2024 & 2032
- Figure 81: Latin America CO Gas Sensors Industry Revenue Share (%), by Application 2024 & 2032
- Figure 82: Latin America CO Gas Sensors Industry Volume Share (%), by Application 2024 & 2032
- Figure 83: Latin America CO Gas Sensors Industry Revenue (Million), by Country 2024 & 2032
- Figure 84: Latin America CO Gas Sensors Industry Volume (K Unit), by Country 2024 & 2032
- Figure 85: Latin America CO Gas Sensors Industry Revenue Share (%), by Country 2024 & 2032
- Figure 86: Latin America CO Gas Sensors Industry Volume Share (%), by Country 2024 & 2032
- Figure 87: Middle East and Africa CO Gas Sensors Industry Revenue (Million), by Technology 2024 & 2032
- Figure 88: Middle East and Africa CO Gas Sensors Industry Volume (K Unit), by Technology 2024 & 2032
- Figure 89: Middle East and Africa CO Gas Sensors Industry Revenue Share (%), by Technology 2024 & 2032
- Figure 90: Middle East and Africa CO Gas Sensors Industry Volume Share (%), by Technology 2024 & 2032
- Figure 91: Middle East and Africa CO Gas Sensors Industry Revenue (Million), by Application 2024 & 2032
- Figure 92: Middle East and Africa CO Gas Sensors Industry Volume (K Unit), by Application 2024 & 2032
- Figure 93: Middle East and Africa CO Gas Sensors Industry Revenue Share (%), by Application 2024 & 2032
- Figure 94: Middle East and Africa CO Gas Sensors Industry Volume Share (%), by Application 2024 & 2032
- Figure 95: Middle East and Africa CO Gas Sensors Industry Revenue (Million), by Country 2024 & 2032
- Figure 96: Middle East and Africa CO Gas Sensors Industry Volume (K Unit), by Country 2024 & 2032
- Figure 97: Middle East and Africa CO Gas Sensors Industry Revenue Share (%), by Country 2024 & 2032
- Figure 98: Middle East and Africa CO Gas Sensors Industry Volume Share (%), by Country 2024 & 2032
List of Tables
- Table 1: Global CO Gas Sensors Industry Revenue Million Forecast, by Region 2019 & 2032
- Table 2: Global CO Gas Sensors Industry Volume K Unit Forecast, by Region 2019 & 2032
- Table 3: Global CO Gas Sensors Industry Revenue Million Forecast, by Technology 2019 & 2032
- Table 4: Global CO Gas Sensors Industry Volume K Unit Forecast, by Technology 2019 & 2032
- Table 5: Global CO Gas Sensors Industry Revenue Million Forecast, by Application 2019 & 2032
- Table 6: Global CO Gas Sensors Industry Volume K Unit Forecast, by Application 2019 & 2032
- Table 7: Global CO Gas Sensors Industry Revenue Million Forecast, by Region 2019 & 2032
- Table 8: Global CO Gas Sensors Industry Volume K Unit Forecast, by Region 2019 & 2032
- Table 9: Global CO Gas Sensors Industry Revenue Million Forecast, by Country 2019 & 2032
- Table 10: Global CO Gas Sensors Industry Volume K Unit Forecast, by Country 2019 & 2032
- Table 11: United States CO Gas Sensors Industry Revenue (Million) Forecast, by Application 2019 & 2032
- Table 12: United States CO Gas Sensors Industry Volume (K Unit) Forecast, by Application 2019 & 2032
- Table 13: Canada CO Gas Sensors Industry Revenue (Million) Forecast, by Application 2019 & 2032
- Table 14: Canada CO Gas Sensors Industry Volume (K Unit) Forecast, by Application 2019 & 2032
- Table 15: Mexico CO Gas Sensors Industry Revenue (Million) Forecast, by Application 2019 & 2032
- Table 16: Mexico CO Gas Sensors Industry Volume (K Unit) Forecast, by Application 2019 & 2032
- Table 17: Global CO Gas Sensors Industry Revenue Million Forecast, by Country 2019 & 2032
- Table 18: Global CO Gas Sensors Industry Volume K Unit Forecast, by Country 2019 & 2032
- Table 19: Germany CO Gas Sensors Industry Revenue (Million) Forecast, by Application 2019 & 2032
- Table 20: Germany CO Gas Sensors Industry Volume (K Unit) Forecast, by Application 2019 & 2032
- Table 21: United Kingdom CO Gas Sensors Industry Revenue (Million) Forecast, by Application 2019 & 2032
- Table 22: United Kingdom CO Gas Sensors Industry Volume (K Unit) Forecast, by Application 2019 & 2032
- Table 23: France CO Gas Sensors Industry Revenue (Million) Forecast, by Application 2019 & 2032
- Table 24: France CO Gas Sensors Industry Volume (K Unit) Forecast, by Application 2019 & 2032
- Table 25: Spain CO Gas Sensors Industry Revenue (Million) Forecast, by Application 2019 & 2032
- Table 26: Spain CO Gas Sensors Industry Volume (K Unit) Forecast, by Application 2019 & 2032
- Table 27: Italy CO Gas Sensors Industry Revenue (Million) Forecast, by Application 2019 & 2032
- Table 28: Italy CO Gas Sensors Industry Volume (K Unit) Forecast, by Application 2019 & 2032
- Table 29: Spain CO Gas Sensors Industry Revenue (Million) Forecast, by Application 2019 & 2032
- Table 30: Spain CO Gas Sensors Industry Volume (K Unit) Forecast, by Application 2019 & 2032
- Table 31: Belgium CO Gas Sensors Industry Revenue (Million) Forecast, by Application 2019 & 2032
- Table 32: Belgium CO Gas Sensors Industry Volume (K Unit) Forecast, by Application 2019 & 2032
- Table 33: Netherland CO Gas Sensors Industry Revenue (Million) Forecast, by Application 2019 & 2032
- Table 34: Netherland CO Gas Sensors Industry Volume (K Unit) Forecast, by Application 2019 & 2032
- Table 35: Nordics CO Gas Sensors Industry Revenue (Million) Forecast, by Application 2019 & 2032
- Table 36: Nordics CO Gas Sensors Industry Volume (K Unit) Forecast, by Application 2019 & 2032
- Table 37: Rest of Europe CO Gas Sensors Industry Revenue (Million) Forecast, by Application 2019 & 2032
- Table 38: Rest of Europe CO Gas Sensors Industry Volume (K Unit) Forecast, by Application 2019 & 2032
- Table 39: Global CO Gas Sensors Industry Revenue Million Forecast, by Country 2019 & 2032
- Table 40: Global CO Gas Sensors Industry Volume K Unit Forecast, by Country 2019 & 2032
- Table 41: China CO Gas Sensors Industry Revenue (Million) Forecast, by Application 2019 & 2032
- Table 42: China CO Gas Sensors Industry Volume (K Unit) Forecast, by Application 2019 & 2032
- Table 43: Japan CO Gas Sensors Industry Revenue (Million) Forecast, by Application 2019 & 2032
- Table 44: Japan CO Gas Sensors Industry Volume (K Unit) Forecast, by Application 2019 & 2032
- Table 45: India CO Gas Sensors Industry Revenue (Million) Forecast, by Application 2019 & 2032
- Table 46: India CO Gas Sensors Industry Volume (K Unit) Forecast, by Application 2019 & 2032
- Table 47: South Korea CO Gas Sensors Industry Revenue (Million) Forecast, by Application 2019 & 2032
- Table 48: South Korea CO Gas Sensors Industry Volume (K Unit) Forecast, by Application 2019 & 2032
- Table 49: Southeast Asia CO Gas Sensors Industry Revenue (Million) Forecast, by Application 2019 & 2032
- Table 50: Southeast Asia CO Gas Sensors Industry Volume (K Unit) Forecast, by Application 2019 & 2032
- Table 51: Australia CO Gas Sensors Industry Revenue (Million) Forecast, by Application 2019 & 2032
- Table 52: Australia CO Gas Sensors Industry Volume (K Unit) Forecast, by Application 2019 & 2032
- Table 53: Indonesia CO Gas Sensors Industry Revenue (Million) Forecast, by Application 2019 & 2032
- Table 54: Indonesia CO Gas Sensors Industry Volume (K Unit) Forecast, by Application 2019 & 2032
- Table 55: Phillipes CO Gas Sensors Industry Revenue (Million) Forecast, by Application 2019 & 2032
- Table 56: Phillipes CO Gas Sensors Industry Volume (K Unit) Forecast, by Application 2019 & 2032
- Table 57: Singapore CO Gas Sensors Industry Revenue (Million) Forecast, by Application 2019 & 2032
- Table 58: Singapore CO Gas Sensors Industry Volume (K Unit) Forecast, by Application 2019 & 2032
- Table 59: Thailandc CO Gas Sensors Industry Revenue (Million) Forecast, by Application 2019 & 2032
- Table 60: Thailandc CO Gas Sensors Industry Volume (K Unit) Forecast, by Application 2019 & 2032
- Table 61: Rest of Asia Pacific CO Gas Sensors Industry Revenue (Million) Forecast, by Application 2019 & 2032
- Table 62: Rest of Asia Pacific CO Gas Sensors Industry Volume (K Unit) Forecast, by Application 2019 & 2032
- Table 63: Global CO Gas Sensors Industry Revenue Million Forecast, by Country 2019 & 2032
- Table 64: Global CO Gas Sensors Industry Volume K Unit Forecast, by Country 2019 & 2032
- Table 65: Brazil CO Gas Sensors Industry Revenue (Million) Forecast, by Application 2019 & 2032
- Table 66: Brazil CO Gas Sensors Industry Volume (K Unit) Forecast, by Application 2019 & 2032
- Table 67: Argentina CO Gas Sensors Industry Revenue (Million) Forecast, by Application 2019 & 2032
- Table 68: Argentina CO Gas Sensors Industry Volume (K Unit) Forecast, by Application 2019 & 2032
- Table 69: Peru CO Gas Sensors Industry Revenue (Million) Forecast, by Application 2019 & 2032
- Table 70: Peru CO Gas Sensors Industry Volume (K Unit) Forecast, by Application 2019 & 2032
- Table 71: Chile CO Gas Sensors Industry Revenue (Million) Forecast, by Application 2019 & 2032
- Table 72: Chile CO Gas Sensors Industry Volume (K Unit) Forecast, by Application 2019 & 2032
- Table 73: Colombia CO Gas Sensors Industry Revenue (Million) Forecast, by Application 2019 & 2032
- Table 74: Colombia CO Gas Sensors Industry Volume (K Unit) Forecast, by Application 2019 & 2032
- Table 75: Ecuador CO Gas Sensors Industry Revenue (Million) Forecast, by Application 2019 & 2032
- Table 76: Ecuador CO Gas Sensors Industry Volume (K Unit) Forecast, by Application 2019 & 2032
- Table 77: Venezuela CO Gas Sensors Industry Revenue (Million) Forecast, by Application 2019 & 2032
- Table 78: Venezuela CO Gas Sensors Industry Volume (K Unit) Forecast, by Application 2019 & 2032
- Table 79: Rest of South America CO Gas Sensors Industry Revenue (Million) Forecast, by Application 2019 & 2032
- Table 80: Rest of South America CO Gas Sensors Industry Volume (K Unit) Forecast, by Application 2019 & 2032
- Table 81: Global CO Gas Sensors Industry Revenue Million Forecast, by Country 2019 & 2032
- Table 82: Global CO Gas Sensors Industry Volume K Unit Forecast, by Country 2019 & 2032
- Table 83: United States CO Gas Sensors Industry Revenue (Million) Forecast, by Application 2019 & 2032
- Table 84: United States CO Gas Sensors Industry Volume (K Unit) Forecast, by Application 2019 & 2032
- Table 85: Canada CO Gas Sensors Industry Revenue (Million) Forecast, by Application 2019 & 2032
- Table 86: Canada CO Gas Sensors Industry Volume (K Unit) Forecast, by Application 2019 & 2032
- Table 87: Mexico CO Gas Sensors Industry Revenue (Million) Forecast, by Application 2019 & 2032
- Table 88: Mexico CO Gas Sensors Industry Volume (K Unit) Forecast, by Application 2019 & 2032
- Table 89: Global CO Gas Sensors Industry Revenue Million Forecast, by Country 2019 & 2032
- Table 90: Global CO Gas Sensors Industry Volume K Unit Forecast, by Country 2019 & 2032
- Table 91: United Arab Emirates CO Gas Sensors Industry Revenue (Million) Forecast, by Application 2019 & 2032
- Table 92: United Arab Emirates CO Gas Sensors Industry Volume (K Unit) Forecast, by Application 2019 & 2032
- Table 93: Saudi Arabia CO Gas Sensors Industry Revenue (Million) Forecast, by Application 2019 & 2032
- Table 94: Saudi Arabia CO Gas Sensors Industry Volume (K Unit) Forecast, by Application 2019 & 2032
- Table 95: South Africa CO Gas Sensors Industry Revenue (Million) Forecast, by Application 2019 & 2032
- Table 96: South Africa CO Gas Sensors Industry Volume (K Unit) Forecast, by Application 2019 & 2032
- Table 97: Rest of Middle East and Africa CO Gas Sensors Industry Revenue (Million) Forecast, by Application 2019 & 2032
- Table 98: Rest of Middle East and Africa CO Gas Sensors Industry Volume (K Unit) Forecast, by Application 2019 & 2032
- Table 99: Global CO Gas Sensors Industry Revenue Million Forecast, by Technology 2019 & 2032
- Table 100: Global CO Gas Sensors Industry Volume K Unit Forecast, by Technology 2019 & 2032
- Table 101: Global CO Gas Sensors Industry Revenue Million Forecast, by Application 2019 & 2032
- Table 102: Global CO Gas Sensors Industry Volume K Unit Forecast, by Application 2019 & 2032
- Table 103: Global CO Gas Sensors Industry Revenue Million Forecast, by Country 2019 & 2032
- Table 104: Global CO Gas Sensors Industry Volume K Unit Forecast, by Country 2019 & 2032
- Table 105: Global CO Gas Sensors Industry Revenue Million Forecast, by Technology 2019 & 2032
- Table 106: Global CO Gas Sensors Industry Volume K Unit Forecast, by Technology 2019 & 2032
- Table 107: Global CO Gas Sensors Industry Revenue Million Forecast, by Application 2019 & 2032
- Table 108: Global CO Gas Sensors Industry Volume K Unit Forecast, by Application 2019 & 2032
- Table 109: Global CO Gas Sensors Industry Revenue Million Forecast, by Country 2019 & 2032
- Table 110: Global CO Gas Sensors Industry Volume K Unit Forecast, by Country 2019 & 2032
- Table 111: Global CO Gas Sensors Industry Revenue Million Forecast, by Technology 2019 & 2032
- Table 112: Global CO Gas Sensors Industry Volume K Unit Forecast, by Technology 2019 & 2032
- Table 113: Global CO Gas Sensors Industry Revenue Million Forecast, by Application 2019 & 2032
- Table 114: Global CO Gas Sensors Industry Volume K Unit Forecast, by Application 2019 & 2032
- Table 115: Global CO Gas Sensors Industry Revenue Million Forecast, by Country 2019 & 2032
- Table 116: Global CO Gas Sensors Industry Volume K Unit Forecast, by Country 2019 & 2032
- Table 117: Global CO Gas Sensors Industry Revenue Million Forecast, by Technology 2019 & 2032
- Table 118: Global CO Gas Sensors Industry Volume K Unit Forecast, by Technology 2019 & 2032
- Table 119: Global CO Gas Sensors Industry Revenue Million Forecast, by Application 2019 & 2032
- Table 120: Global CO Gas Sensors Industry Volume K Unit Forecast, by Application 2019 & 2032
- Table 121: Global CO Gas Sensors Industry Revenue Million Forecast, by Country 2019 & 2032
- Table 122: Global CO Gas Sensors Industry Volume K Unit Forecast, by Country 2019 & 2032
- Table 123: Global CO Gas Sensors Industry Revenue Million Forecast, by Technology 2019 & 2032
- Table 124: Global CO Gas Sensors Industry Volume K Unit Forecast, by Technology 2019 & 2032
- Table 125: Global CO Gas Sensors Industry Revenue Million Forecast, by Application 2019 & 2032
- Table 126: Global CO Gas Sensors Industry Volume K Unit Forecast, by Application 2019 & 2032
- Table 127: Global CO Gas Sensors Industry Revenue Million Forecast, by Country 2019 & 2032
- Table 128: Global CO Gas Sensors Industry Volume K Unit Forecast, by Country 2019 & 2032
- Table 129: Global CO Gas Sensors Industry Revenue Million Forecast, by Technology 2019 & 2032
- Table 130: Global CO Gas Sensors Industry Volume K Unit Forecast, by Technology 2019 & 2032
- Table 131: Global CO Gas Sensors Industry Revenue Million Forecast, by Application 2019 & 2032
- Table 132: Global CO Gas Sensors Industry Volume K Unit Forecast, by Application 2019 & 2032
- Table 133: Global CO Gas Sensors Industry Revenue Million Forecast, by Country 2019 & 2032
- Table 134: Global CO Gas Sensors Industry Volume K Unit Forecast, by Country 2019 & 2032
Frequently Asked Questions
1. What is the projected Compound Annual Growth Rate (CAGR) of the CO Gas Sensors Industry?
The projected CAGR is approximately 6.20%.
2. Which companies are prominent players in the CO Gas Sensors Industry?
Key companies in the market include ABB Ltd, Aeroqual Ltd, Honeywel, NGK Insulators Ltd, Siemens AG, Trolex Ltd, Alphasense, GfG Europe Ltd, Robert Bosch GmbH, Yokogawa Electric Corporation, Dynament Ltd.
3. What are the main segments of the CO Gas Sensors Industry?
The market segments include Technology, Application.
4. Can you provide details about the market size?
The market size is estimated to be USD 1.30 Million as of 2022.
5. What are some drivers contributing to market growth?
Government Regulations to Ensure Safety in Work Places; Increasing Need for Emission Control Standards.
6. What are the notable trends driving market growth?
The Petrochemical Segment to Witness Growth.
7. Are there any restraints impacting market growth?
Lack of Awareness of Safety Gains in SME; Cost of Maintenance and Low Product Differentiation.
8. Can you provide examples of recent developments in the market?
March 2024: Teledyne Gas and Flame Detection launched the high-performance OLCT 100-XP-MS range of flammable gas detectors, incorporating cutting-edge MEMS (micro-electromechanical systems) sensor technology. By offering catalytic oxidation, IR, and MEMS sensor technologies in a single device, the OLCT100-XP-MS represents a holistic solution that revolutionizes flammable gas detection, regardless of environmental or operational constraints.
9. What pricing options are available for accessing the report?
Pricing options include single-user, multi-user, and enterprise licenses priced at USD 4750, USD 5250, and USD 8750 respectively.
10. Is the market size provided in terms of value or volume?
The market size is provided in terms of value, measured in Million and volume, measured in K Unit.
11. Are there any specific market keywords associated with the report?
Yes, the market keyword associated with the report is "CO Gas Sensors Industry," which aids in identifying and referencing the specific market segment covered.
12. How do I determine which pricing option suits my needs best?
The pricing options vary based on user requirements and access needs. Individual users may opt for single-user licenses, while businesses requiring broader access may choose multi-user or enterprise licenses for cost-effective access to the report.
13. Are there any additional resources or data provided in the CO Gas Sensors Industry report?
While the report offers comprehensive insights, it's advisable to review the specific contents or supplementary materials provided to ascertain if additional resources or data are available.
14. How can I stay updated on further developments or reports in the CO Gas Sensors Industry?
To stay informed about further developments, trends, and reports in the CO Gas Sensors Industry, consider subscribing to industry newsletters, following relevant companies and organizations, or regularly checking reputable industry news sources and publications.
Methodology
Step 1 - Identification of Relevant Samples Size from Population Database


Step 2 - Approaches for Defining Global Market Size (Value, Volume* & Price*)

Note*: In applicable scenarios
Step 3 - Data Sources
Primary Research
- Web Analytics
- Survey Reports
- Research Institute
- Latest Research Reports
- Opinion Leaders
Secondary Research
- Annual Reports
- White Paper
- Latest Press Release
- Industry Association
- Paid Database
- Investor Presentations

Step 4 - Data Triangulation
Involves using different sources of information in order to increase the validity of a study
These sources are likely to be stakeholders in a program - participants, other researchers, program staff, other community members, and so on.
Then we put all data in single framework & apply various statistical tools to find out the dynamic on the market.
During the analysis stage, feedback from the stakeholder groups would be compared to determine areas of agreement as well as areas of divergence
