

Key Insights
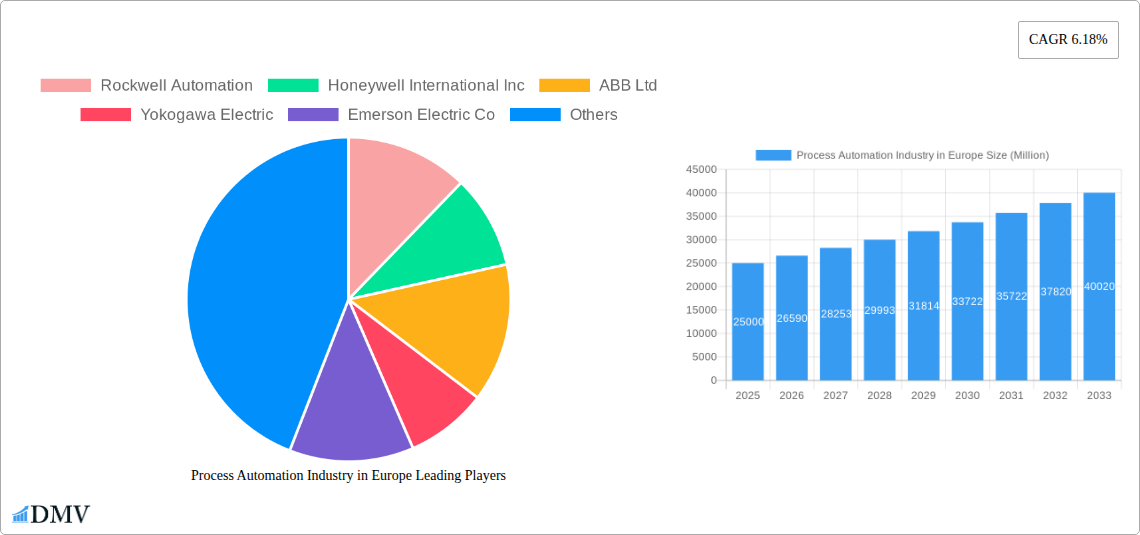
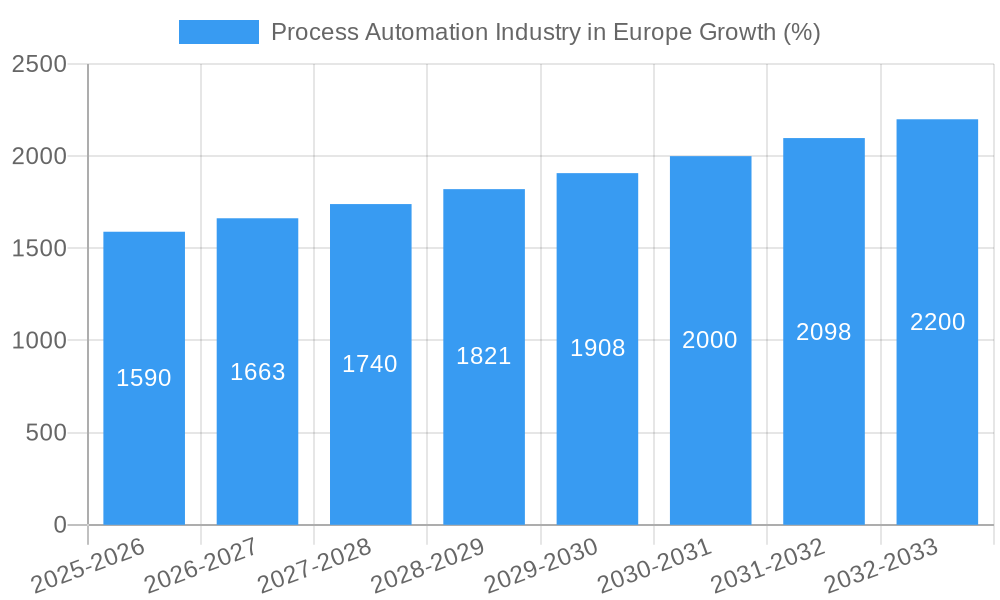
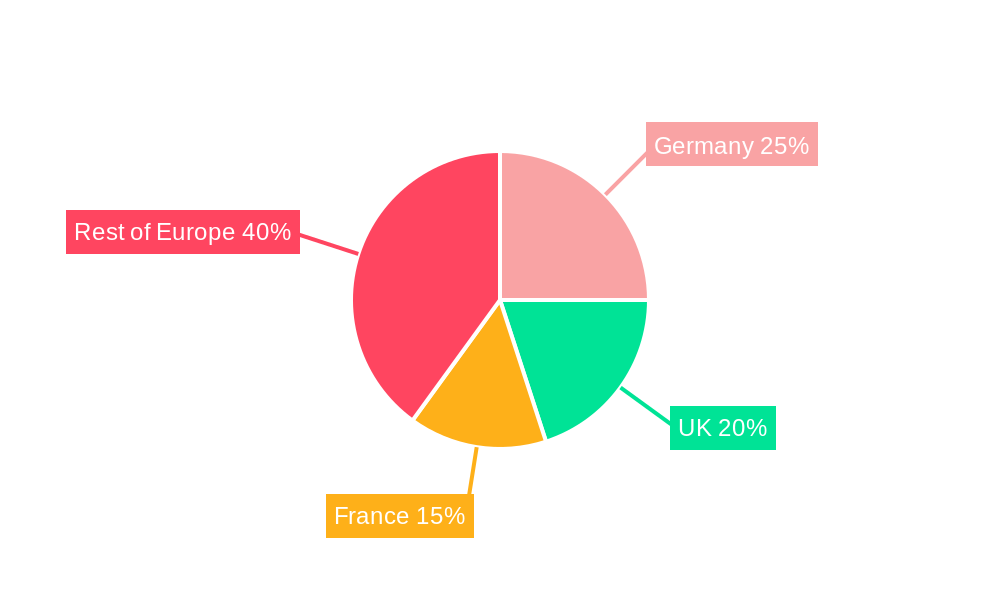
The European process automation market, valued at approximately €XX million in 2025, is experiencing robust growth, projected to expand at a Compound Annual Growth Rate (CAGR) of 6.18% from 2025 to 2033. This growth is fueled by several key drivers. Increasing adoption of Industry 4.0 technologies, such as advanced sensors, predictive maintenance software, and cloud-based solutions, is significantly enhancing operational efficiency and productivity across various end-user industries. The rising demand for automation in sectors like oil and gas, chemicals, and pharmaceuticals, driven by the need for improved safety, reduced operational costs, and enhanced product quality, is further propelling market expansion. Furthermore, stringent environmental regulations and the increasing focus on sustainability are pushing industries to adopt more efficient and environmentally friendly automation technologies. The market is segmented by communication protocol (wired and wireless), system type (hardware and software), and end-user industry (with oil & gas, chemicals, power & utilities, and water & wastewater being major contributors). Germany, the United Kingdom, and France represent the largest national markets within Europe, reflecting their established industrial bases and robust technological infrastructure.
However, certain restraints may impede market growth. High initial investment costs associated with implementing process automation systems can be a barrier for smaller companies. Furthermore, the complexity of integrating various automation technologies and the need for skilled professionals to manage and maintain these systems present challenges. Nevertheless, the long-term benefits of improved efficiency, enhanced safety, and reduced operational costs are expected to outweigh these challenges, ensuring continued market growth over the forecast period. The increasing availability of financing options and government initiatives promoting digitalization within industries are also mitigating these constraints. The competitive landscape is characterized by established players like Rockwell Automation, Honeywell, ABB, and Siemens, who are constantly innovating to maintain their market share and meet evolving customer needs. The market’s future trajectory is positive, indicating substantial opportunities for both established players and emerging technology providers within the European process automation landscape.
Process Automation Industry in Europe: A Comprehensive Market Report (2019-2033)
This insightful report provides a detailed analysis of the European process automation market, offering a comprehensive overview of its current state, future trajectory, and key players. With a study period spanning 2019-2033, a base year of 2025, and a forecast period of 2025-2033, this report is an indispensable resource for stakeholders seeking to understand and capitalize on this dynamic market. The report analyzes the market size, exceeding €XX Billion in 2025, and projects substantial growth, reaching €XX Billion by 2033.
Process Automation Industry in Europe Market Composition & Trends
This section delves into the intricate composition of the European process automation market, examining market concentration, innovation drivers, regulatory influences, substitute products, end-user profiles, and mergers & acquisitions (M&A) activities. The market is characterized by a moderately concentrated landscape, with key players such as Rockwell Automation, Siemens AG, and ABB Ltd holding significant market share. However, the presence of numerous smaller, specialized companies contributes to a competitive environment.
- Market Share Distribution (2025): Siemens AG (18%), ABB Ltd (15%), Rockwell Automation (12%), Honeywell International Inc (10%), Others (45%). These figures are estimates based on available market data.
- Innovation Catalysts: Increasing demand for improved efficiency, enhanced safety, and reduced operational costs are driving innovation in areas such as AI-powered predictive maintenance and cloud-based solutions.
- Regulatory Landscape: Stringent environmental regulations and safety standards, particularly within sectors like chemical and petrochemical, are shaping technological advancements and influencing market dynamics.
- Substitute Products: The emergence of alternative technologies, while limited, presents a competitive challenge.
- End-User Profiles: The report segments end-users across various industries, including Oil & Gas, Chemical & Petrochemical, Power & Utilities, and others, analyzing their specific automation needs and adoption rates.
- M&A Activities (2019-2024): A total of XX M&A deals were recorded during the period, with a cumulative value of €XX Billion. These deals reflect the strategic efforts of companies to expand their market reach and enhance their product portfolios.
Process Automation Industry in Europe Industry Evolution
This section meticulously examines the evolutionary path of the European process automation industry. Analyzing market growth trajectories, technological breakthroughs, and shifting consumer needs, it provides detailed insights into the driving forces behind market transformation. The industry exhibits a robust growth trajectory, driven primarily by increasing industrial automation needs, digital transformation initiatives, and the burgeoning adoption of Industry 4.0 technologies.
- Historical Growth (2019-2024): The market experienced a Compound Annual Growth Rate (CAGR) of XX%.
- Technological Advancements: The integration of AI, IoT, and cloud computing is revolutionizing process automation, enabling real-time monitoring, predictive maintenance, and enhanced decision-making.
- Shifting Consumer Demands: End-users increasingly demand customized automation solutions, flexible deployment models, and improved cybersecurity features.
- Forecast Growth (2025-2033): The market is projected to grow at a CAGR of XX%, propelled by continued digitalization and the adoption of advanced technologies.
Leading Regions, Countries, or Segments in Process Automation Industry in Europe
This section identifies the leading regions, countries, and segments within the European process automation market. A detailed analysis highlights the key drivers behind their dominance.
Dominant Region: Western Europe (Germany, UK, France) accounts for the largest market share due to high industrial density and early adoption of advanced technologies.
Leading Countries:
- Germany: Strong industrial base, high technological expertise, and government support for industrial automation initiatives contribute to its leading position.
- United Kingdom: Significant investments in digital infrastructure and a focus on innovation drive market growth.
- France: A robust industrial sector and government policies promoting digital transformation contribute to market expansion.
Dominant Segments:
- Communication Protocol: Wired communication protocols currently dominate, but wireless technologies are gaining traction due to flexibility and cost-effectiveness.
- System Type: System Hardware constitutes a larger market share compared to software, reflecting the initial investment requirements in automation infrastructure.
- Software Type: Sensors & Transmitters represent a significant segment, driven by the increasing demand for real-time data acquisition and process monitoring.
- End-user Industry: The Oil and Gas, Chemical and Petrochemical sectors are major drivers, followed by Power and Utilities, reflecting high automation needs within these industries.
Process Automation Industry in Europe Product Innovations
Recent years have witnessed significant product innovations in the European process automation market. These innovations encompass enhanced sensor technologies, advanced control systems, and cloud-based platforms, all aimed at improving efficiency, reliability, and safety. The introduction of AI-powered predictive maintenance solutions and the development of more robust and secure industrial communication protocols are key examples. These innovations boast unique selling propositions such as reduced downtime, improved resource optimization, and enhanced decision-making capabilities.
Propelling Factors for Process Automation Industry in Europe Growth
Several factors are driving the growth of the European process automation market. These include:
- Technological Advancements: The integration of AI, IoT, and cloud computing is revolutionizing automation, offering improved efficiency and enabling data-driven decision-making.
- Economic Factors: The need for increased productivity and reduced operational costs is encouraging widespread adoption of automation solutions.
- Regulatory Influences: Stricter environmental regulations and safety standards are pushing industries to adopt more efficient and environmentally friendly automation technologies.
Obstacles in the Process Automation Industry in Europe Market
Despite the positive growth outlook, certain barriers hinder market expansion. These include:
- Regulatory Challenges: Navigating complex regulations and compliance requirements can be time-consuming and costly for companies.
- Supply Chain Disruptions: Global supply chain uncertainties can impact the availability of critical components and materials, potentially delaying project timelines.
- Competitive Pressures: The presence of numerous established players and emerging competitors creates intense competition, impacting pricing and profit margins.
Future Opportunities in Process Automation Industry in Europe
The European process automation market presents several promising opportunities for growth. These include:
- Expansion into New Markets: The adoption of automation technologies in previously underserved sectors, like agriculture and logistics, offers significant growth potential.
- Technological Advancements: The ongoing development of AI, machine learning, and other advanced technologies presents opportunities for innovation and market expansion.
- Emerging Consumer Trends: The increasing emphasis on sustainability and environmental responsibility drives the development of environmentally friendly automation solutions.
Major Players in the Process Automation Industry in Europe Ecosystem
- Rockwell Automation
- Honeywell International Inc
- ABB Ltd
- Yokogawa Electric
- Emerson Electric Co
- Siemens AG
- General Electric Co
- Fuji Electric
- Schneider Electric
- Delta Electronics Limited
- Mitsubishi Electric
- Eaton Corporation
Key Developments in Process Automation Industry in Europe Industry
- July 2020: ABB introduced Ability Genix, a scalable advanced analytics platform enhancing operational efficiency and data-driven decision-making.
- April 2021: Siemens launched the Simotics S-1FS2 servo motor, catering to the pharmaceutical and food industries with its enhanced features.
Strategic Process Automation Industry in Europe Market Forecast
The European process automation market is poised for sustained growth, driven by technological advancements, increasing demand for enhanced efficiency, and stringent regulatory compliance. The adoption of AI, IoT, and cloud-based solutions will continue to reshape the industry landscape, creating new opportunities for innovation and market expansion. The market's future hinges on addressing challenges like supply chain disruptions and ensuring robust cybersecurity measures. The forecast period suggests significant growth potential, indicating a strong investment opportunity for stakeholders.
Process Automation Industry in Europe Segmentation
-
1. Communication Protocol
- 1.1. Wired
- 1.2. Wireless
-
2. System Type
-
2.1. By System Hardware
- 2.1.1. Supervis
- 2.1.2. Distributed Control System (DCS)
- 2.1.3. Programmable Logic Controller (PLC)
- 2.1.4. Manufacturing Execution System (MES)
- 2.1.5. Valves & Actuators
- 2.1.6. Electric Motors
- 2.1.7. Human Machine Interface (HMI)
- 2.1.8. Process Safety Systems
- 2.1.9. Sensors & Transmitters
-
2.2. By Software Type
-
2.2.1. APC (Standalone & Customized Solutions)
- 2.2.1.1. Advanced Regulatory Control
- 2.2.1.2. Multivariable Model
- 2.2.1.3. Inferential & Sequential
- 2.2.2. Data Analytics & Reporting-based Software
- 2.2.3. Other Software & Services
-
2.2.1. APC (Standalone & Customized Solutions)
-
2.1. By System Hardware
-
3. End-user Industry
- 3.1. Oil and Gas
- 3.2. Chemical and Petrochemical
- 3.3. Power and Utilities
- 3.4. Water & Wastewater
- 3.5. Food and Beverage
- 3.6. Paper & Pulp
- 3.7. Pharmaceutical
- 3.8. Other End-user Industries
Process Automation Industry in Europe Segmentation By Geography
-
1. North America
- 1.1. United States
- 1.2. Canada
- 1.3. Mexico
-
2. South America
- 2.1. Brazil
- 2.2. Argentina
- 2.3. Rest of South America
-
3. Europe
- 3.1. United Kingdom
- 3.2. Germany
- 3.3. France
- 3.4. Italy
- 3.5. Spain
- 3.6. Russia
- 3.7. Benelux
- 3.8. Nordics
- 3.9. Rest of Europe
-
4. Middle East & Africa
- 4.1. Turkey
- 4.2. Israel
- 4.3. GCC
- 4.4. North Africa
- 4.5. South Africa
- 4.6. Rest of Middle East & Africa
-
5. Asia Pacific
- 5.1. China
- 5.2. India
- 5.3. Japan
- 5.4. South Korea
- 5.5. ASEAN
- 5.6. Oceania
- 5.7. Rest of Asia Pacific
Process Automation Industry in Europe REPORT HIGHLIGHTS
| Aspects | Details |
|---|---|
| Study Period | 2019-2033 |
| Base Year | 2024 |
| Estimated Year | 2025 |
| Forecast Period | 2025-2033 |
| Historical Period | 2019-2024 |
| Growth Rate | CAGR of 6.18% from 2019-2033 |
| Segmentation |
|
Table of Contents
- 1. Introduction
- 1.1. Research Scope
- 1.2. Market Segmentation
- 1.3. Research Methodology
- 1.4. Definitions and Assumptions
- 2. Executive Summary
- 2.1. Introduction
- 3. Market Dynamics
- 3.1. Introduction
- 3.2. Market Drivers
- 3.2.1. Need to Upgrade the Existing Networks
- 3.3. Market Restrains
- 3.3.1. High cost of installation
- 3.4. Market Trends
- 3.4.1. Pharmaceutical Industry is Expected to Hold Significant Market Share
- 4. Market Factor Analysis
- 4.1. Porters Five Forces
- 4.2. Supply/Value Chain
- 4.3. PESTEL analysis
- 4.4. Market Entropy
- 4.5. Patent/Trademark Analysis
- 5. Global Process Automation Industry in Europe Analysis, Insights and Forecast, 2019-2031
- 5.1. Market Analysis, Insights and Forecast - by Communication Protocol
- 5.1.1. Wired
- 5.1.2. Wireless
- 5.2. Market Analysis, Insights and Forecast - by System Type
- 5.2.1. By System Hardware
- 5.2.1.1. Supervis
- 5.2.1.2. Distributed Control System (DCS)
- 5.2.1.3. Programmable Logic Controller (PLC)
- 5.2.1.4. Manufacturing Execution System (MES)
- 5.2.1.5. Valves & Actuators
- 5.2.1.6. Electric Motors
- 5.2.1.7. Human Machine Interface (HMI)
- 5.2.1.8. Process Safety Systems
- 5.2.1.9. Sensors & Transmitters
- 5.2.2. By Software Type
- 5.2.2.1. APC (Standalone & Customized Solutions)
- 5.2.2.1.1. Advanced Regulatory Control
- 5.2.2.1.2. Multivariable Model
- 5.2.2.1.3. Inferential & Sequential
- 5.2.2.2. Data Analytics & Reporting-based Software
- 5.2.2.3. Other Software & Services
- 5.2.2.1. APC (Standalone & Customized Solutions)
- 5.2.1. By System Hardware
- 5.3. Market Analysis, Insights and Forecast - by End-user Industry
- 5.3.1. Oil and Gas
- 5.3.2. Chemical and Petrochemical
- 5.3.3. Power and Utilities
- 5.3.4. Water & Wastewater
- 5.3.5. Food and Beverage
- 5.3.6. Paper & Pulp
- 5.3.7. Pharmaceutical
- 5.3.8. Other End-user Industries
- 5.4. Market Analysis, Insights and Forecast - by Region
- 5.4.1. North America
- 5.4.2. South America
- 5.4.3. Europe
- 5.4.4. Middle East & Africa
- 5.4.5. Asia Pacific
- 5.1. Market Analysis, Insights and Forecast - by Communication Protocol
- 6. North America Process Automation Industry in Europe Analysis, Insights and Forecast, 2019-2031
- 6.1. Market Analysis, Insights and Forecast - by Communication Protocol
- 6.1.1. Wired
- 6.1.2. Wireless
- 6.2. Market Analysis, Insights and Forecast - by System Type
- 6.2.1. By System Hardware
- 6.2.1.1. Supervis
- 6.2.1.2. Distributed Control System (DCS)
- 6.2.1.3. Programmable Logic Controller (PLC)
- 6.2.1.4. Manufacturing Execution System (MES)
- 6.2.1.5. Valves & Actuators
- 6.2.1.6. Electric Motors
- 6.2.1.7. Human Machine Interface (HMI)
- 6.2.1.8. Process Safety Systems
- 6.2.1.9. Sensors & Transmitters
- 6.2.2. By Software Type
- 6.2.2.1. APC (Standalone & Customized Solutions)
- 6.2.2.1.1. Advanced Regulatory Control
- 6.2.2.1.2. Multivariable Model
- 6.2.2.1.3. Inferential & Sequential
- 6.2.2.2. Data Analytics & Reporting-based Software
- 6.2.2.3. Other Software & Services
- 6.2.2.1. APC (Standalone & Customized Solutions)
- 6.2.1. By System Hardware
- 6.3. Market Analysis, Insights and Forecast - by End-user Industry
- 6.3.1. Oil and Gas
- 6.3.2. Chemical and Petrochemical
- 6.3.3. Power and Utilities
- 6.3.4. Water & Wastewater
- 6.3.5. Food and Beverage
- 6.3.6. Paper & Pulp
- 6.3.7. Pharmaceutical
- 6.3.8. Other End-user Industries
- 6.1. Market Analysis, Insights and Forecast - by Communication Protocol
- 7. South America Process Automation Industry in Europe Analysis, Insights and Forecast, 2019-2031
- 7.1. Market Analysis, Insights and Forecast - by Communication Protocol
- 7.1.1. Wired
- 7.1.2. Wireless
- 7.2. Market Analysis, Insights and Forecast - by System Type
- 7.2.1. By System Hardware
- 7.2.1.1. Supervis
- 7.2.1.2. Distributed Control System (DCS)
- 7.2.1.3. Programmable Logic Controller (PLC)
- 7.2.1.4. Manufacturing Execution System (MES)
- 7.2.1.5. Valves & Actuators
- 7.2.1.6. Electric Motors
- 7.2.1.7. Human Machine Interface (HMI)
- 7.2.1.8. Process Safety Systems
- 7.2.1.9. Sensors & Transmitters
- 7.2.2. By Software Type
- 7.2.2.1. APC (Standalone & Customized Solutions)
- 7.2.2.1.1. Advanced Regulatory Control
- 7.2.2.1.2. Multivariable Model
- 7.2.2.1.3. Inferential & Sequential
- 7.2.2.2. Data Analytics & Reporting-based Software
- 7.2.2.3. Other Software & Services
- 7.2.2.1. APC (Standalone & Customized Solutions)
- 7.2.1. By System Hardware
- 7.3. Market Analysis, Insights and Forecast - by End-user Industry
- 7.3.1. Oil and Gas
- 7.3.2. Chemical and Petrochemical
- 7.3.3. Power and Utilities
- 7.3.4. Water & Wastewater
- 7.3.5. Food and Beverage
- 7.3.6. Paper & Pulp
- 7.3.7. Pharmaceutical
- 7.3.8. Other End-user Industries
- 7.1. Market Analysis, Insights and Forecast - by Communication Protocol
- 8. Europe Process Automation Industry in Europe Analysis, Insights and Forecast, 2019-2031
- 8.1. Market Analysis, Insights and Forecast - by Communication Protocol
- 8.1.1. Wired
- 8.1.2. Wireless
- 8.2. Market Analysis, Insights and Forecast - by System Type
- 8.2.1. By System Hardware
- 8.2.1.1. Supervis
- 8.2.1.2. Distributed Control System (DCS)
- 8.2.1.3. Programmable Logic Controller (PLC)
- 8.2.1.4. Manufacturing Execution System (MES)
- 8.2.1.5. Valves & Actuators
- 8.2.1.6. Electric Motors
- 8.2.1.7. Human Machine Interface (HMI)
- 8.2.1.8. Process Safety Systems
- 8.2.1.9. Sensors & Transmitters
- 8.2.2. By Software Type
- 8.2.2.1. APC (Standalone & Customized Solutions)
- 8.2.2.1.1. Advanced Regulatory Control
- 8.2.2.1.2. Multivariable Model
- 8.2.2.1.3. Inferential & Sequential
- 8.2.2.2. Data Analytics & Reporting-based Software
- 8.2.2.3. Other Software & Services
- 8.2.2.1. APC (Standalone & Customized Solutions)
- 8.2.1. By System Hardware
- 8.3. Market Analysis, Insights and Forecast - by End-user Industry
- 8.3.1. Oil and Gas
- 8.3.2. Chemical and Petrochemical
- 8.3.3. Power and Utilities
- 8.3.4. Water & Wastewater
- 8.3.5. Food and Beverage
- 8.3.6. Paper & Pulp
- 8.3.7. Pharmaceutical
- 8.3.8. Other End-user Industries
- 8.1. Market Analysis, Insights and Forecast - by Communication Protocol
- 9. Middle East & Africa Process Automation Industry in Europe Analysis, Insights and Forecast, 2019-2031
- 9.1. Market Analysis, Insights and Forecast - by Communication Protocol
- 9.1.1. Wired
- 9.1.2. Wireless
- 9.2. Market Analysis, Insights and Forecast - by System Type
- 9.2.1. By System Hardware
- 9.2.1.1. Supervis
- 9.2.1.2. Distributed Control System (DCS)
- 9.2.1.3. Programmable Logic Controller (PLC)
- 9.2.1.4. Manufacturing Execution System (MES)
- 9.2.1.5. Valves & Actuators
- 9.2.1.6. Electric Motors
- 9.2.1.7. Human Machine Interface (HMI)
- 9.2.1.8. Process Safety Systems
- 9.2.1.9. Sensors & Transmitters
- 9.2.2. By Software Type
- 9.2.2.1. APC (Standalone & Customized Solutions)
- 9.2.2.1.1. Advanced Regulatory Control
- 9.2.2.1.2. Multivariable Model
- 9.2.2.1.3. Inferential & Sequential
- 9.2.2.2. Data Analytics & Reporting-based Software
- 9.2.2.3. Other Software & Services
- 9.2.2.1. APC (Standalone & Customized Solutions)
- 9.2.1. By System Hardware
- 9.3. Market Analysis, Insights and Forecast - by End-user Industry
- 9.3.1. Oil and Gas
- 9.3.2. Chemical and Petrochemical
- 9.3.3. Power and Utilities
- 9.3.4. Water & Wastewater
- 9.3.5. Food and Beverage
- 9.3.6. Paper & Pulp
- 9.3.7. Pharmaceutical
- 9.3.8. Other End-user Industries
- 9.1. Market Analysis, Insights and Forecast - by Communication Protocol
- 10. Asia Pacific Process Automation Industry in Europe Analysis, Insights and Forecast, 2019-2031
- 10.1. Market Analysis, Insights and Forecast - by Communication Protocol
- 10.1.1. Wired
- 10.1.2. Wireless
- 10.2. Market Analysis, Insights and Forecast - by System Type
- 10.2.1. By System Hardware
- 10.2.1.1. Supervis
- 10.2.1.2. Distributed Control System (DCS)
- 10.2.1.3. Programmable Logic Controller (PLC)
- 10.2.1.4. Manufacturing Execution System (MES)
- 10.2.1.5. Valves & Actuators
- 10.2.1.6. Electric Motors
- 10.2.1.7. Human Machine Interface (HMI)
- 10.2.1.8. Process Safety Systems
- 10.2.1.9. Sensors & Transmitters
- 10.2.2. By Software Type
- 10.2.2.1. APC (Standalone & Customized Solutions)
- 10.2.2.1.1. Advanced Regulatory Control
- 10.2.2.1.2. Multivariable Model
- 10.2.2.1.3. Inferential & Sequential
- 10.2.2.2. Data Analytics & Reporting-based Software
- 10.2.2.3. Other Software & Services
- 10.2.2.1. APC (Standalone & Customized Solutions)
- 10.2.1. By System Hardware
- 10.3. Market Analysis, Insights and Forecast - by End-user Industry
- 10.3.1. Oil and Gas
- 10.3.2. Chemical and Petrochemical
- 10.3.3. Power and Utilities
- 10.3.4. Water & Wastewater
- 10.3.5. Food and Beverage
- 10.3.6. Paper & Pulp
- 10.3.7. Pharmaceutical
- 10.3.8. Other End-user Industries
- 10.1. Market Analysis, Insights and Forecast - by Communication Protocol
- 11. Europe Process Automation Industry in Europe Analysis, Insights and Forecast, 2019-2031
- 11.1. Market Analysis, Insights and Forecast - By Country/Sub-region
- 11.1.1. undefined
- 12. Germany Process Automation Industry in Europe Analysis, Insights and Forecast, 2019-2031
- 12.1. Market Analysis, Insights and Forecast - By Country/Sub-region
- 12.1.1. undefined
- 13. France Process Automation Industry in Europe Analysis, Insights and Forecast, 2019-2031
- 13.1. Market Analysis, Insights and Forecast - By Country/Sub-region
- 13.1.1. undefined
- 14. Italy Process Automation Industry in Europe Analysis, Insights and Forecast, 2019-2031
- 14.1. Market Analysis, Insights and Forecast - By Country/Sub-region
- 14.1.1. undefined
- 15. United Kingdom Process Automation Industry in Europe Analysis, Insights and Forecast, 2019-2031
- 15.1. Market Analysis, Insights and Forecast - By Country/Sub-region
- 15.1.1. undefined
- 16. Netherlands Process Automation Industry in Europe Analysis, Insights and Forecast, 2019-2031
- 16.1. Market Analysis, Insights and Forecast - By Country/Sub-region
- 16.1.1. undefined
- 17. Sweden Process Automation Industry in Europe Analysis, Insights and Forecast, 2019-2031
- 17.1. Market Analysis, Insights and Forecast - By Country/Sub-region
- 17.1.1. undefined
- 18. Competitive Analysis
- 18.1. Global Market Share Analysis 2024
- 18.2. Company Profiles
- 18.2.1 Rockwell Automation
- 18.2.1.1. Overview
- 18.2.1.2. Products
- 18.2.1.3. SWOT Analysis
- 18.2.1.4. Recent Developments
- 18.2.1.5. Financials (Based on Availability)
- 18.2.2 Honeywell International Inc
- 18.2.2.1. Overview
- 18.2.2.2. Products
- 18.2.2.3. SWOT Analysis
- 18.2.2.4. Recent Developments
- 18.2.2.5. Financials (Based on Availability)
- 18.2.3 ABB Ltd
- 18.2.3.1. Overview
- 18.2.3.2. Products
- 18.2.3.3. SWOT Analysis
- 18.2.3.4. Recent Developments
- 18.2.3.5. Financials (Based on Availability)
- 18.2.4 Yokogawa Electric
- 18.2.4.1. Overview
- 18.2.4.2. Products
- 18.2.4.3. SWOT Analysis
- 18.2.4.4. Recent Developments
- 18.2.4.5. Financials (Based on Availability)
- 18.2.5 Emerson Electric Co
- 18.2.5.1. Overview
- 18.2.5.2. Products
- 18.2.5.3. SWOT Analysis
- 18.2.5.4. Recent Developments
- 18.2.5.5. Financials (Based on Availability)
- 18.2.6 Siemens AG
- 18.2.6.1. Overview
- 18.2.6.2. Products
- 18.2.6.3. SWOT Analysis
- 18.2.6.4. Recent Developments
- 18.2.6.5. Financials (Based on Availability)
- 18.2.7 General Electric Co
- 18.2.7.1. Overview
- 18.2.7.2. Products
- 18.2.7.3. SWOT Analysis
- 18.2.7.4. Recent Developments
- 18.2.7.5. Financials (Based on Availability)
- 18.2.8 Fuji Electric
- 18.2.8.1. Overview
- 18.2.8.2. Products
- 18.2.8.3. SWOT Analysis
- 18.2.8.4. Recent Developments
- 18.2.8.5. Financials (Based on Availability)
- 18.2.9 Schneider Electric
- 18.2.9.1. Overview
- 18.2.9.2. Products
- 18.2.9.3. SWOT Analysis
- 18.2.9.4. Recent Developments
- 18.2.9.5. Financials (Based on Availability)
- 18.2.10 Delta Electronics Limited
- 18.2.10.1. Overview
- 18.2.10.2. Products
- 18.2.10.3. SWOT Analysis
- 18.2.10.4. Recent Developments
- 18.2.10.5. Financials (Based on Availability)
- 18.2.11 Mitsubishi Electric
- 18.2.11.1. Overview
- 18.2.11.2. Products
- 18.2.11.3. SWOT Analysis
- 18.2.11.4. Recent Developments
- 18.2.11.5. Financials (Based on Availability)
- 18.2.12 Eaton Corporation
- 18.2.12.1. Overview
- 18.2.12.2. Products
- 18.2.12.3. SWOT Analysis
- 18.2.12.4. Recent Developments
- 18.2.12.5. Financials (Based on Availability)
- 18.2.1 Rockwell Automation
List of Figures
- Figure 1: Global Process Automation Industry in Europe Revenue Breakdown (Million, %) by Region 2024 & 2032
- Figure 2: Global Process Automation Industry in Europe Volume Breakdown (K Units, %) by Region 2024 & 2032
- Figure 3: Europe Process Automation Industry in Europe Revenue (Million), by Country 2024 & 2032
- Figure 4: Europe Process Automation Industry in Europe Volume (K Units), by Country 2024 & 2032
- Figure 5: Europe Process Automation Industry in Europe Revenue Share (%), by Country 2024 & 2032
- Figure 6: Europe Process Automation Industry in Europe Volume Share (%), by Country 2024 & 2032
- Figure 7: Germany Process Automation Industry in Europe Revenue (Million), by Country 2024 & 2032
- Figure 8: Germany Process Automation Industry in Europe Volume (K Units), by Country 2024 & 2032
- Figure 9: Germany Process Automation Industry in Europe Revenue Share (%), by Country 2024 & 2032
- Figure 10: Germany Process Automation Industry in Europe Volume Share (%), by Country 2024 & 2032
- Figure 11: France Process Automation Industry in Europe Revenue (Million), by Country 2024 & 2032
- Figure 12: France Process Automation Industry in Europe Volume (K Units), by Country 2024 & 2032
- Figure 13: France Process Automation Industry in Europe Revenue Share (%), by Country 2024 & 2032
- Figure 14: France Process Automation Industry in Europe Volume Share (%), by Country 2024 & 2032
- Figure 15: Italy Process Automation Industry in Europe Revenue (Million), by Country 2024 & 2032
- Figure 16: Italy Process Automation Industry in Europe Volume (K Units), by Country 2024 & 2032
- Figure 17: Italy Process Automation Industry in Europe Revenue Share (%), by Country 2024 & 2032
- Figure 18: Italy Process Automation Industry in Europe Volume Share (%), by Country 2024 & 2032
- Figure 19: United Kingdom Process Automation Industry in Europe Revenue (Million), by Country 2024 & 2032
- Figure 20: United Kingdom Process Automation Industry in Europe Volume (K Units), by Country 2024 & 2032
- Figure 21: United Kingdom Process Automation Industry in Europe Revenue Share (%), by Country 2024 & 2032
- Figure 22: United Kingdom Process Automation Industry in Europe Volume Share (%), by Country 2024 & 2032
- Figure 23: Netherlands Process Automation Industry in Europe Revenue (Million), by Country 2024 & 2032
- Figure 24: Netherlands Process Automation Industry in Europe Volume (K Units), by Country 2024 & 2032
- Figure 25: Netherlands Process Automation Industry in Europe Revenue Share (%), by Country 2024 & 2032
- Figure 26: Netherlands Process Automation Industry in Europe Volume Share (%), by Country 2024 & 2032
- Figure 27: Sweden Process Automation Industry in Europe Revenue (Million), by Country 2024 & 2032
- Figure 28: Sweden Process Automation Industry in Europe Volume (K Units), by Country 2024 & 2032
- Figure 29: Sweden Process Automation Industry in Europe Revenue Share (%), by Country 2024 & 2032
- Figure 30: Sweden Process Automation Industry in Europe Volume Share (%), by Country 2024 & 2032
- Figure 31: North America Process Automation Industry in Europe Revenue (Million), by Communication Protocol 2024 & 2032
- Figure 32: North America Process Automation Industry in Europe Volume (K Units), by Communication Protocol 2024 & 2032
- Figure 33: North America Process Automation Industry in Europe Revenue Share (%), by Communication Protocol 2024 & 2032
- Figure 34: North America Process Automation Industry in Europe Volume Share (%), by Communication Protocol 2024 & 2032
- Figure 35: North America Process Automation Industry in Europe Revenue (Million), by System Type 2024 & 2032
- Figure 36: North America Process Automation Industry in Europe Volume (K Units), by System Type 2024 & 2032
- Figure 37: North America Process Automation Industry in Europe Revenue Share (%), by System Type 2024 & 2032
- Figure 38: North America Process Automation Industry in Europe Volume Share (%), by System Type 2024 & 2032
- Figure 39: North America Process Automation Industry in Europe Revenue (Million), by End-user Industry 2024 & 2032
- Figure 40: North America Process Automation Industry in Europe Volume (K Units), by End-user Industry 2024 & 2032
- Figure 41: North America Process Automation Industry in Europe Revenue Share (%), by End-user Industry 2024 & 2032
- Figure 42: North America Process Automation Industry in Europe Volume Share (%), by End-user Industry 2024 & 2032
- Figure 43: North America Process Automation Industry in Europe Revenue (Million), by Country 2024 & 2032
- Figure 44: North America Process Automation Industry in Europe Volume (K Units), by Country 2024 & 2032
- Figure 45: North America Process Automation Industry in Europe Revenue Share (%), by Country 2024 & 2032
- Figure 46: North America Process Automation Industry in Europe Volume Share (%), by Country 2024 & 2032
- Figure 47: South America Process Automation Industry in Europe Revenue (Million), by Communication Protocol 2024 & 2032
- Figure 48: South America Process Automation Industry in Europe Volume (K Units), by Communication Protocol 2024 & 2032
- Figure 49: South America Process Automation Industry in Europe Revenue Share (%), by Communication Protocol 2024 & 2032
- Figure 50: South America Process Automation Industry in Europe Volume Share (%), by Communication Protocol 2024 & 2032
- Figure 51: South America Process Automation Industry in Europe Revenue (Million), by System Type 2024 & 2032
- Figure 52: South America Process Automation Industry in Europe Volume (K Units), by System Type 2024 & 2032
- Figure 53: South America Process Automation Industry in Europe Revenue Share (%), by System Type 2024 & 2032
- Figure 54: South America Process Automation Industry in Europe Volume Share (%), by System Type 2024 & 2032
- Figure 55: South America Process Automation Industry in Europe Revenue (Million), by End-user Industry 2024 & 2032
- Figure 56: South America Process Automation Industry in Europe Volume (K Units), by End-user Industry 2024 & 2032
- Figure 57: South America Process Automation Industry in Europe Revenue Share (%), by End-user Industry 2024 & 2032
- Figure 58: South America Process Automation Industry in Europe Volume Share (%), by End-user Industry 2024 & 2032
- Figure 59: South America Process Automation Industry in Europe Revenue (Million), by Country 2024 & 2032
- Figure 60: South America Process Automation Industry in Europe Volume (K Units), by Country 2024 & 2032
- Figure 61: South America Process Automation Industry in Europe Revenue Share (%), by Country 2024 & 2032
- Figure 62: South America Process Automation Industry in Europe Volume Share (%), by Country 2024 & 2032
- Figure 63: Europe Process Automation Industry in Europe Revenue (Million), by Communication Protocol 2024 & 2032
- Figure 64: Europe Process Automation Industry in Europe Volume (K Units), by Communication Protocol 2024 & 2032
- Figure 65: Europe Process Automation Industry in Europe Revenue Share (%), by Communication Protocol 2024 & 2032
- Figure 66: Europe Process Automation Industry in Europe Volume Share (%), by Communication Protocol 2024 & 2032
- Figure 67: Europe Process Automation Industry in Europe Revenue (Million), by System Type 2024 & 2032
- Figure 68: Europe Process Automation Industry in Europe Volume (K Units), by System Type 2024 & 2032
- Figure 69: Europe Process Automation Industry in Europe Revenue Share (%), by System Type 2024 & 2032
- Figure 70: Europe Process Automation Industry in Europe Volume Share (%), by System Type 2024 & 2032
- Figure 71: Europe Process Automation Industry in Europe Revenue (Million), by End-user Industry 2024 & 2032
- Figure 72: Europe Process Automation Industry in Europe Volume (K Units), by End-user Industry 2024 & 2032
- Figure 73: Europe Process Automation Industry in Europe Revenue Share (%), by End-user Industry 2024 & 2032
- Figure 74: Europe Process Automation Industry in Europe Volume Share (%), by End-user Industry 2024 & 2032
- Figure 75: Europe Process Automation Industry in Europe Revenue (Million), by Country 2024 & 2032
- Figure 76: Europe Process Automation Industry in Europe Volume (K Units), by Country 2024 & 2032
- Figure 77: Europe Process Automation Industry in Europe Revenue Share (%), by Country 2024 & 2032
- Figure 78: Europe Process Automation Industry in Europe Volume Share (%), by Country 2024 & 2032
- Figure 79: Middle East & Africa Process Automation Industry in Europe Revenue (Million), by Communication Protocol 2024 & 2032
- Figure 80: Middle East & Africa Process Automation Industry in Europe Volume (K Units), by Communication Protocol 2024 & 2032
- Figure 81: Middle East & Africa Process Automation Industry in Europe Revenue Share (%), by Communication Protocol 2024 & 2032
- Figure 82: Middle East & Africa Process Automation Industry in Europe Volume Share (%), by Communication Protocol 2024 & 2032
- Figure 83: Middle East & Africa Process Automation Industry in Europe Revenue (Million), by System Type 2024 & 2032
- Figure 84: Middle East & Africa Process Automation Industry in Europe Volume (K Units), by System Type 2024 & 2032
- Figure 85: Middle East & Africa Process Automation Industry in Europe Revenue Share (%), by System Type 2024 & 2032
- Figure 86: Middle East & Africa Process Automation Industry in Europe Volume Share (%), by System Type 2024 & 2032
- Figure 87: Middle East & Africa Process Automation Industry in Europe Revenue (Million), by End-user Industry 2024 & 2032
- Figure 88: Middle East & Africa Process Automation Industry in Europe Volume (K Units), by End-user Industry 2024 & 2032
- Figure 89: Middle East & Africa Process Automation Industry in Europe Revenue Share (%), by End-user Industry 2024 & 2032
- Figure 90: Middle East & Africa Process Automation Industry in Europe Volume Share (%), by End-user Industry 2024 & 2032
- Figure 91: Middle East & Africa Process Automation Industry in Europe Revenue (Million), by Country 2024 & 2032
- Figure 92: Middle East & Africa Process Automation Industry in Europe Volume (K Units), by Country 2024 & 2032
- Figure 93: Middle East & Africa Process Automation Industry in Europe Revenue Share (%), by Country 2024 & 2032
- Figure 94: Middle East & Africa Process Automation Industry in Europe Volume Share (%), by Country 2024 & 2032
- Figure 95: Asia Pacific Process Automation Industry in Europe Revenue (Million), by Communication Protocol 2024 & 2032
- Figure 96: Asia Pacific Process Automation Industry in Europe Volume (K Units), by Communication Protocol 2024 & 2032
- Figure 97: Asia Pacific Process Automation Industry in Europe Revenue Share (%), by Communication Protocol 2024 & 2032
- Figure 98: Asia Pacific Process Automation Industry in Europe Volume Share (%), by Communication Protocol 2024 & 2032
- Figure 99: Asia Pacific Process Automation Industry in Europe Revenue (Million), by System Type 2024 & 2032
- Figure 100: Asia Pacific Process Automation Industry in Europe Volume (K Units), by System Type 2024 & 2032
- Figure 101: Asia Pacific Process Automation Industry in Europe Revenue Share (%), by System Type 2024 & 2032
- Figure 102: Asia Pacific Process Automation Industry in Europe Volume Share (%), by System Type 2024 & 2032
- Figure 103: Asia Pacific Process Automation Industry in Europe Revenue (Million), by End-user Industry 2024 & 2032
- Figure 104: Asia Pacific Process Automation Industry in Europe Volume (K Units), by End-user Industry 2024 & 2032
- Figure 105: Asia Pacific Process Automation Industry in Europe Revenue Share (%), by End-user Industry 2024 & 2032
- Figure 106: Asia Pacific Process Automation Industry in Europe Volume Share (%), by End-user Industry 2024 & 2032
- Figure 107: Asia Pacific Process Automation Industry in Europe Revenue (Million), by Country 2024 & 2032
- Figure 108: Asia Pacific Process Automation Industry in Europe Volume (K Units), by Country 2024 & 2032
- Figure 109: Asia Pacific Process Automation Industry in Europe Revenue Share (%), by Country 2024 & 2032
- Figure 110: Asia Pacific Process Automation Industry in Europe Volume Share (%), by Country 2024 & 2032
List of Tables
- Table 1: Global Process Automation Industry in Europe Revenue Million Forecast, by Region 2019 & 2032
- Table 2: Global Process Automation Industry in Europe Volume K Units Forecast, by Region 2019 & 2032
- Table 3: Global Process Automation Industry in Europe Revenue Million Forecast, by Communication Protocol 2019 & 2032
- Table 4: Global Process Automation Industry in Europe Volume K Units Forecast, by Communication Protocol 2019 & 2032
- Table 5: Global Process Automation Industry in Europe Revenue Million Forecast, by System Type 2019 & 2032
- Table 6: Global Process Automation Industry in Europe Volume K Units Forecast, by System Type 2019 & 2032
- Table 7: Global Process Automation Industry in Europe Revenue Million Forecast, by End-user Industry 2019 & 2032
- Table 8: Global Process Automation Industry in Europe Volume K Units Forecast, by End-user Industry 2019 & 2032
- Table 9: Global Process Automation Industry in Europe Revenue Million Forecast, by Region 2019 & 2032
- Table 10: Global Process Automation Industry in Europe Volume K Units Forecast, by Region 2019 & 2032
- Table 11: Global Process Automation Industry in Europe Revenue Million Forecast, by Country 2019 & 2032
- Table 12: Global Process Automation Industry in Europe Volume K Units Forecast, by Country 2019 & 2032
- Table 13: Global Process Automation Industry in Europe Revenue Million Forecast, by Country 2019 & 2032
- Table 14: Global Process Automation Industry in Europe Volume K Units Forecast, by Country 2019 & 2032
- Table 15: Global Process Automation Industry in Europe Revenue Million Forecast, by Country 2019 & 2032
- Table 16: Global Process Automation Industry in Europe Volume K Units Forecast, by Country 2019 & 2032
- Table 17: Global Process Automation Industry in Europe Revenue Million Forecast, by Country 2019 & 2032
- Table 18: Global Process Automation Industry in Europe Volume K Units Forecast, by Country 2019 & 2032
- Table 19: Global Process Automation Industry in Europe Revenue Million Forecast, by Country 2019 & 2032
- Table 20: Global Process Automation Industry in Europe Volume K Units Forecast, by Country 2019 & 2032
- Table 21: Global Process Automation Industry in Europe Revenue Million Forecast, by Country 2019 & 2032
- Table 22: Global Process Automation Industry in Europe Volume K Units Forecast, by Country 2019 & 2032
- Table 23: Global Process Automation Industry in Europe Revenue Million Forecast, by Country 2019 & 2032
- Table 24: Global Process Automation Industry in Europe Volume K Units Forecast, by Country 2019 & 2032
- Table 25: Global Process Automation Industry in Europe Revenue Million Forecast, by Communication Protocol 2019 & 2032
- Table 26: Global Process Automation Industry in Europe Volume K Units Forecast, by Communication Protocol 2019 & 2032
- Table 27: Global Process Automation Industry in Europe Revenue Million Forecast, by System Type 2019 & 2032
- Table 28: Global Process Automation Industry in Europe Volume K Units Forecast, by System Type 2019 & 2032
- Table 29: Global Process Automation Industry in Europe Revenue Million Forecast, by End-user Industry 2019 & 2032
- Table 30: Global Process Automation Industry in Europe Volume K Units Forecast, by End-user Industry 2019 & 2032
- Table 31: Global Process Automation Industry in Europe Revenue Million Forecast, by Country 2019 & 2032
- Table 32: Global Process Automation Industry in Europe Volume K Units Forecast, by Country 2019 & 2032
- Table 33: United States Process Automation Industry in Europe Revenue (Million) Forecast, by Application 2019 & 2032
- Table 34: United States Process Automation Industry in Europe Volume (K Units) Forecast, by Application 2019 & 2032
- Table 35: Canada Process Automation Industry in Europe Revenue (Million) Forecast, by Application 2019 & 2032
- Table 36: Canada Process Automation Industry in Europe Volume (K Units) Forecast, by Application 2019 & 2032
- Table 37: Mexico Process Automation Industry in Europe Revenue (Million) Forecast, by Application 2019 & 2032
- Table 38: Mexico Process Automation Industry in Europe Volume (K Units) Forecast, by Application 2019 & 2032
- Table 39: Global Process Automation Industry in Europe Revenue Million Forecast, by Communication Protocol 2019 & 2032
- Table 40: Global Process Automation Industry in Europe Volume K Units Forecast, by Communication Protocol 2019 & 2032
- Table 41: Global Process Automation Industry in Europe Revenue Million Forecast, by System Type 2019 & 2032
- Table 42: Global Process Automation Industry in Europe Volume K Units Forecast, by System Type 2019 & 2032
- Table 43: Global Process Automation Industry in Europe Revenue Million Forecast, by End-user Industry 2019 & 2032
- Table 44: Global Process Automation Industry in Europe Volume K Units Forecast, by End-user Industry 2019 & 2032
- Table 45: Global Process Automation Industry in Europe Revenue Million Forecast, by Country 2019 & 2032
- Table 46: Global Process Automation Industry in Europe Volume K Units Forecast, by Country 2019 & 2032
- Table 47: Brazil Process Automation Industry in Europe Revenue (Million) Forecast, by Application 2019 & 2032
- Table 48: Brazil Process Automation Industry in Europe Volume (K Units) Forecast, by Application 2019 & 2032
- Table 49: Argentina Process Automation Industry in Europe Revenue (Million) Forecast, by Application 2019 & 2032
- Table 50: Argentina Process Automation Industry in Europe Volume (K Units) Forecast, by Application 2019 & 2032
- Table 51: Rest of South America Process Automation Industry in Europe Revenue (Million) Forecast, by Application 2019 & 2032
- Table 52: Rest of South America Process Automation Industry in Europe Volume (K Units) Forecast, by Application 2019 & 2032
- Table 53: Global Process Automation Industry in Europe Revenue Million Forecast, by Communication Protocol 2019 & 2032
- Table 54: Global Process Automation Industry in Europe Volume K Units Forecast, by Communication Protocol 2019 & 2032
- Table 55: Global Process Automation Industry in Europe Revenue Million Forecast, by System Type 2019 & 2032
- Table 56: Global Process Automation Industry in Europe Volume K Units Forecast, by System Type 2019 & 2032
- Table 57: Global Process Automation Industry in Europe Revenue Million Forecast, by End-user Industry 2019 & 2032
- Table 58: Global Process Automation Industry in Europe Volume K Units Forecast, by End-user Industry 2019 & 2032
- Table 59: Global Process Automation Industry in Europe Revenue Million Forecast, by Country 2019 & 2032
- Table 60: Global Process Automation Industry in Europe Volume K Units Forecast, by Country 2019 & 2032
- Table 61: United Kingdom Process Automation Industry in Europe Revenue (Million) Forecast, by Application 2019 & 2032
- Table 62: United Kingdom Process Automation Industry in Europe Volume (K Units) Forecast, by Application 2019 & 2032
- Table 63: Germany Process Automation Industry in Europe Revenue (Million) Forecast, by Application 2019 & 2032
- Table 64: Germany Process Automation Industry in Europe Volume (K Units) Forecast, by Application 2019 & 2032
- Table 65: France Process Automation Industry in Europe Revenue (Million) Forecast, by Application 2019 & 2032
- Table 66: France Process Automation Industry in Europe Volume (K Units) Forecast, by Application 2019 & 2032
- Table 67: Italy Process Automation Industry in Europe Revenue (Million) Forecast, by Application 2019 & 2032
- Table 68: Italy Process Automation Industry in Europe Volume (K Units) Forecast, by Application 2019 & 2032
- Table 69: Spain Process Automation Industry in Europe Revenue (Million) Forecast, by Application 2019 & 2032
- Table 70: Spain Process Automation Industry in Europe Volume (K Units) Forecast, by Application 2019 & 2032
- Table 71: Russia Process Automation Industry in Europe Revenue (Million) Forecast, by Application 2019 & 2032
- Table 72: Russia Process Automation Industry in Europe Volume (K Units) Forecast, by Application 2019 & 2032
- Table 73: Benelux Process Automation Industry in Europe Revenue (Million) Forecast, by Application 2019 & 2032
- Table 74: Benelux Process Automation Industry in Europe Volume (K Units) Forecast, by Application 2019 & 2032
- Table 75: Nordics Process Automation Industry in Europe Revenue (Million) Forecast, by Application 2019 & 2032
- Table 76: Nordics Process Automation Industry in Europe Volume (K Units) Forecast, by Application 2019 & 2032
- Table 77: Rest of Europe Process Automation Industry in Europe Revenue (Million) Forecast, by Application 2019 & 2032
- Table 78: Rest of Europe Process Automation Industry in Europe Volume (K Units) Forecast, by Application 2019 & 2032
- Table 79: Global Process Automation Industry in Europe Revenue Million Forecast, by Communication Protocol 2019 & 2032
- Table 80: Global Process Automation Industry in Europe Volume K Units Forecast, by Communication Protocol 2019 & 2032
- Table 81: Global Process Automation Industry in Europe Revenue Million Forecast, by System Type 2019 & 2032
- Table 82: Global Process Automation Industry in Europe Volume K Units Forecast, by System Type 2019 & 2032
- Table 83: Global Process Automation Industry in Europe Revenue Million Forecast, by End-user Industry 2019 & 2032
- Table 84: Global Process Automation Industry in Europe Volume K Units Forecast, by End-user Industry 2019 & 2032
- Table 85: Global Process Automation Industry in Europe Revenue Million Forecast, by Country 2019 & 2032
- Table 86: Global Process Automation Industry in Europe Volume K Units Forecast, by Country 2019 & 2032
- Table 87: Turkey Process Automation Industry in Europe Revenue (Million) Forecast, by Application 2019 & 2032
- Table 88: Turkey Process Automation Industry in Europe Volume (K Units) Forecast, by Application 2019 & 2032
- Table 89: Israel Process Automation Industry in Europe Revenue (Million) Forecast, by Application 2019 & 2032
- Table 90: Israel Process Automation Industry in Europe Volume (K Units) Forecast, by Application 2019 & 2032
- Table 91: GCC Process Automation Industry in Europe Revenue (Million) Forecast, by Application 2019 & 2032
- Table 92: GCC Process Automation Industry in Europe Volume (K Units) Forecast, by Application 2019 & 2032
- Table 93: North Africa Process Automation Industry in Europe Revenue (Million) Forecast, by Application 2019 & 2032
- Table 94: North Africa Process Automation Industry in Europe Volume (K Units) Forecast, by Application 2019 & 2032
- Table 95: South Africa Process Automation Industry in Europe Revenue (Million) Forecast, by Application 2019 & 2032
- Table 96: South Africa Process Automation Industry in Europe Volume (K Units) Forecast, by Application 2019 & 2032
- Table 97: Rest of Middle East & Africa Process Automation Industry in Europe Revenue (Million) Forecast, by Application 2019 & 2032
- Table 98: Rest of Middle East & Africa Process Automation Industry in Europe Volume (K Units) Forecast, by Application 2019 & 2032
- Table 99: Global Process Automation Industry in Europe Revenue Million Forecast, by Communication Protocol 2019 & 2032
- Table 100: Global Process Automation Industry in Europe Volume K Units Forecast, by Communication Protocol 2019 & 2032
- Table 101: Global Process Automation Industry in Europe Revenue Million Forecast, by System Type 2019 & 2032
- Table 102: Global Process Automation Industry in Europe Volume K Units Forecast, by System Type 2019 & 2032
- Table 103: Global Process Automation Industry in Europe Revenue Million Forecast, by End-user Industry 2019 & 2032
- Table 104: Global Process Automation Industry in Europe Volume K Units Forecast, by End-user Industry 2019 & 2032
- Table 105: Global Process Automation Industry in Europe Revenue Million Forecast, by Country 2019 & 2032
- Table 106: Global Process Automation Industry in Europe Volume K Units Forecast, by Country 2019 & 2032
- Table 107: China Process Automation Industry in Europe Revenue (Million) Forecast, by Application 2019 & 2032
- Table 108: China Process Automation Industry in Europe Volume (K Units) Forecast, by Application 2019 & 2032
- Table 109: India Process Automation Industry in Europe Revenue (Million) Forecast, by Application 2019 & 2032
- Table 110: India Process Automation Industry in Europe Volume (K Units) Forecast, by Application 2019 & 2032
- Table 111: Japan Process Automation Industry in Europe Revenue (Million) Forecast, by Application 2019 & 2032
- Table 112: Japan Process Automation Industry in Europe Volume (K Units) Forecast, by Application 2019 & 2032
- Table 113: South Korea Process Automation Industry in Europe Revenue (Million) Forecast, by Application 2019 & 2032
- Table 114: South Korea Process Automation Industry in Europe Volume (K Units) Forecast, by Application 2019 & 2032
- Table 115: ASEAN Process Automation Industry in Europe Revenue (Million) Forecast, by Application 2019 & 2032
- Table 116: ASEAN Process Automation Industry in Europe Volume (K Units) Forecast, by Application 2019 & 2032
- Table 117: Oceania Process Automation Industry in Europe Revenue (Million) Forecast, by Application 2019 & 2032
- Table 118: Oceania Process Automation Industry in Europe Volume (K Units) Forecast, by Application 2019 & 2032
- Table 119: Rest of Asia Pacific Process Automation Industry in Europe Revenue (Million) Forecast, by Application 2019 & 2032
- Table 120: Rest of Asia Pacific Process Automation Industry in Europe Volume (K Units) Forecast, by Application 2019 & 2032
Frequently Asked Questions
1. What is the projected Compound Annual Growth Rate (CAGR) of the Process Automation Industry in Europe?
The projected CAGR is approximately 6.18%.
2. Which companies are prominent players in the Process Automation Industry in Europe?
Key companies in the market include Rockwell Automation, Honeywell International Inc, ABB Ltd, Yokogawa Electric, Emerson Electric Co, Siemens AG, General Electric Co, Fuji Electric, Schneider Electric, Delta Electronics Limited, Mitsubishi Electric, Eaton Corporation.
3. What are the main segments of the Process Automation Industry in Europe?
The market segments include Communication Protocol, System Type, End-user Industry.
4. Can you provide details about the market size?
The market size is estimated to be USD XX Million as of 2022.
5. What are some drivers contributing to market growth?
Need to Upgrade the Existing Networks.
6. What are the notable trends driving market growth?
Pharmaceutical Industry is Expected to Hold Significant Market Share.
7. Are there any restraints impacting market growth?
High cost of installation.
8. Can you provide examples of recent developments in the market?
April 2021 - Siemens launched a new servo motor. The Simotics S-1FS2 comes with a stainless-steel casing, IP67/IP69 protection, and high-resolution 22-bit absolute multiturn encoders catering to the pharmaceutical and food industries.
9. What pricing options are available for accessing the report?
Pricing options include single-user, multi-user, and enterprise licenses priced at USD 4750, USD 4950, and USD 6800 respectively.
10. Is the market size provided in terms of value or volume?
The market size is provided in terms of value, measured in Million and volume, measured in K Units.
11. Are there any specific market keywords associated with the report?
Yes, the market keyword associated with the report is "Process Automation Industry in Europe," which aids in identifying and referencing the specific market segment covered.
12. How do I determine which pricing option suits my needs best?
The pricing options vary based on user requirements and access needs. Individual users may opt for single-user licenses, while businesses requiring broader access may choose multi-user or enterprise licenses for cost-effective access to the report.
13. Are there any additional resources or data provided in the Process Automation Industry in Europe report?
While the report offers comprehensive insights, it's advisable to review the specific contents or supplementary materials provided to ascertain if additional resources or data are available.
14. How can I stay updated on further developments or reports in the Process Automation Industry in Europe?
To stay informed about further developments, trends, and reports in the Process Automation Industry in Europe, consider subscribing to industry newsletters, following relevant companies and organizations, or regularly checking reputable industry news sources and publications.
Methodology
Step 1 - Identification of Relevant Samples Size from Population Database


Step 2 - Approaches for Defining Global Market Size (Value, Volume* & Price*)

Note*: In applicable scenarios
Step 3 - Data Sources
Primary Research
- Web Analytics
- Survey Reports
- Research Institute
- Latest Research Reports
- Opinion Leaders
Secondary Research
- Annual Reports
- White Paper
- Latest Press Release
- Industry Association
- Paid Database
- Investor Presentations

Step 4 - Data Triangulation
Involves using different sources of information in order to increase the validity of a study
These sources are likely to be stakeholders in a program - participants, other researchers, program staff, other community members, and so on.
Then we put all data in single framework & apply various statistical tools to find out the dynamic on the market.
During the analysis stage, feedback from the stakeholder groups would be compared to determine areas of agreement as well as areas of divergence
