

Key Insights
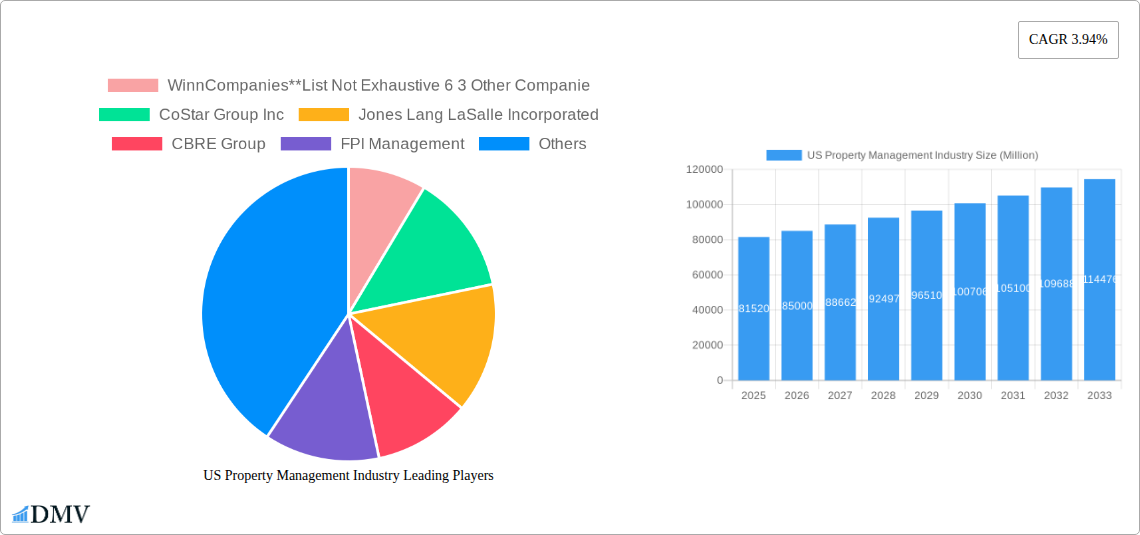
The US property management industry, valued at $81.52 billion in 2025, is projected to experience robust growth, driven by several key factors. The increasing urbanization and population density in major metropolitan areas fuel demand for rental properties, significantly impacting the commercial and residential segments. Technological advancements in property management software and platforms are streamlining operations, improving efficiency, and enhancing tenant experiences, contributing to market expansion. Furthermore, the growing preference for flexible and short-term rental options, particularly among younger demographics, is creating new opportunities within the service sector, including tenant services and marketing. The rise of proptech companies is also disrupting the traditional landscape, offering innovative solutions for property owners and managers alike. While challenges such as fluctuating interest rates and potential economic slowdowns may pose some restraints, the long-term outlook for the US property management industry remains positive.
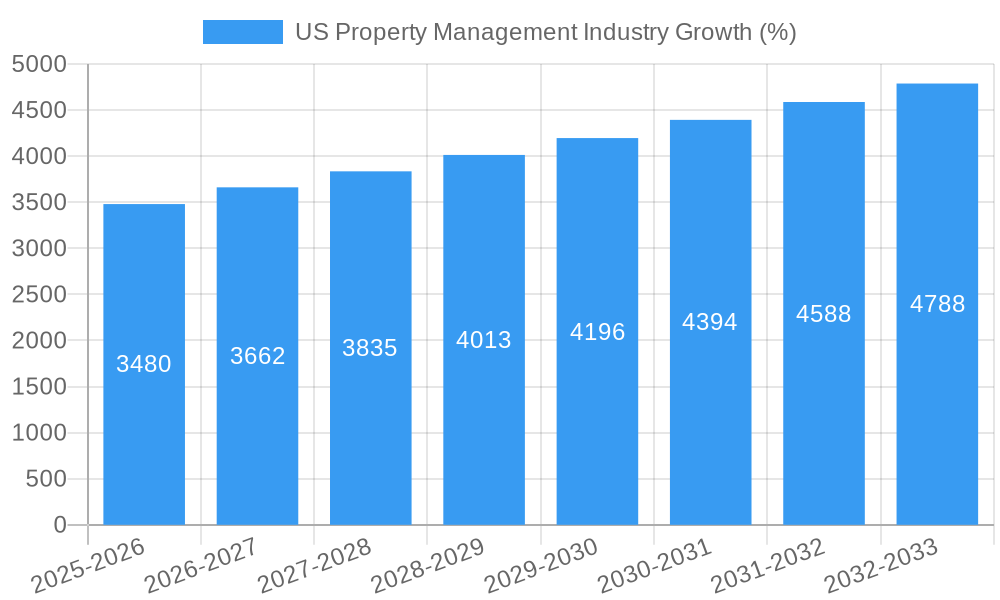
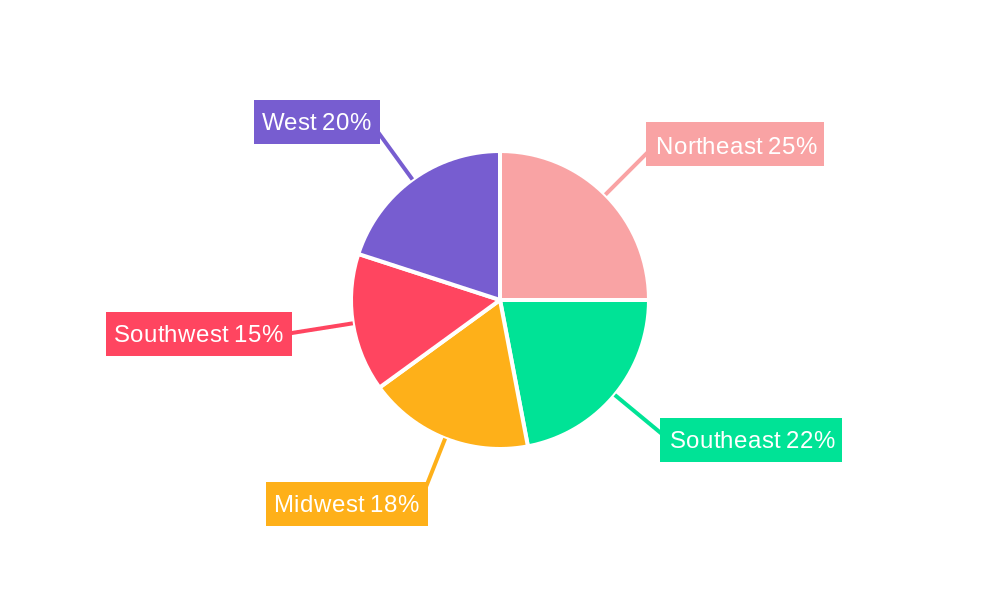
The industry's segmentation reveals substantial opportunities across various service offerings. Commercial property management remains a significant revenue generator, particularly in major cities with high demand for office spaces and retail properties. Residential property management is equally crucial, driven by a growing rental population. Within services, marketing and property evaluation are witnessing significant growth due to increased competition and the need for effective property promotion. Maintenance services and other specialized offerings are also contributing to the overall market expansion. Key players like WinnCompanies, CoStar Group Inc., Jones Lang LaSalle Incorporated, CBRE Group, and others are actively shaping the competitive landscape through strategic acquisitions, technological innovation, and expansion into new markets. Regional variations exist, with the Northeast, Southeast, and West Coast experiencing higher growth rates compared to the Midwest and Southwest, reflecting diverse demographic trends and economic conditions. The forecasted CAGR of 3.94% over the period 2025-2033 indicates a substantial increase in market value by 2033, further solidifying the industry's long-term growth trajectory.
US Property Management Industry: A Comprehensive Market Report (2019-2033)
This insightful report provides a comprehensive analysis of the US Property Management Industry, covering market size, growth trends, leading players, and future opportunities. With a study period spanning 2019-2033, a base year of 2025, and a forecast period of 2025-2033, this report is an essential resource for stakeholders seeking to understand and navigate this dynamic sector. The report delves into key market segments, including residential and commercial property management, and analyzes the services offered, from marketing and property evaluation to tenant services and maintenance. The total market value is projected to reach xx Million by 2033, exhibiting a robust Compound Annual Growth Rate (CAGR).
US Property Management Industry Market Composition & Trends
The US property management industry is a fragmented yet consolidating market, characterized by a mix of large national players and smaller regional firms. Market share is distributed across these players, with the top 10 firms holding an estimated xx% of the overall market in 2024. Significant mergers and acquisitions (M&A) activity are reshaping the competitive landscape, with deal values exceeding USD xx Million in recent years. For example, the acquisition of On-Site Managers Inc. by RealPage Inc. in November 2023 for USD 250 Million demonstrates the ongoing consolidation trend.
- Market Concentration: Moderately concentrated, with a few dominant players.
- Innovation Catalysts: Technological advancements in property management software and PropTech.
- Regulatory Landscape: Varying local, state, and federal regulations impacting operations.
- Substitute Products: Limited direct substitutes, primarily self-management by property owners.
- End-User Profiles: A mix of individual property owners, real estate investment trusts (REITs), and institutional investors.
- M&A Activity: High levels of M&A activity driven by consolidation and technological integration. Recent examples include the acquisition of Wood Partners' property management business by Greystar in February 2024.
US Property Management Industry Industry Evolution
The US property management industry has undergone significant transformation, driven by technological advancements, shifting consumer demands, and evolving regulatory requirements. The historical period (2019-2024) witnessed a steady growth trajectory, with a CAGR of approximately xx%, influenced by factors such as increasing urbanization, rising rental demand, and the expansion of the multifamily housing sector. Technological advancements, such as the adoption of property management software and online tenant portals, have streamlined operations and improved efficiency. Shifting consumer demands towards greater transparency, convenience, and personalized services have also influenced the evolution of the industry. The forecast period (2025-2033) is projected to exhibit continued growth, albeit at a potentially moderated pace, as the market matures and faces challenges such as inflation and interest rate fluctuations. Adoption of PropTech solutions is expected to increase at a CAGR of xx% during the forecast period.
Leading Regions, Countries, or Segments in US Property Management Industry
The US property management market is geographically diverse, with significant activity across major metropolitan areas. However, the residential segment consistently represents the largest share of the market due to the high demand for rental properties in densely populated urban centers.
- Key Drivers for Residential Dominance:
- High population density in urban areas.
- Growing demand for rental housing.
- Increasing urbanization and migration to major cities.
- Key Drivers for Commercial Segment Growth:
- Expansion of commercial real estate development.
- Growth of the office, retail, and industrial sectors.
- Increased demand for property management services from institutional investors.
The service segment providing tenant services remains crucial for building positive tenant relationships and maintaining occupancy rates. Property evaluation and marketing services are increasingly in demand, while maintenance services play a critical role in property preservation and tenant satisfaction.
US Property Management Industry Product Innovations
Recent innovations include the integration of AI-powered tools for predictive maintenance, automated lease processing, and tenant communication platforms. These enhancements streamline operations, reduce costs, and enhance the tenant experience. The use of smart home technology and data analytics is also gaining traction, enabling more efficient property management and personalized services. These technological advancements offer unique selling propositions such as improved efficiency, cost reduction, and enhanced tenant satisfaction.
Propelling Factors for US Property Management Industry Growth
Several factors are driving the growth of the US property management industry. The increasing urbanization and migration trends fuel demand for rental properties, bolstering the residential sector. Technological advancements, particularly the adoption of property management software and data analytics, improve efficiency and operational effectiveness. Favorable economic conditions, such as sustained job growth and rising disposable incomes, increase rental demand. Furthermore, regulatory changes aimed at fostering housing affordability and addressing rental housing shortages can positively impact market expansion.
Obstacles in the US Property Management Industry Market
Despite the growth potential, several challenges impede the industry's progress. Stringent regulatory compliance requirements impose substantial operational and administrative burdens. Supply chain disruptions, particularly in construction materials, can impact new developments and property maintenance. Intense competition among property management firms necessitates innovative strategies to attract and retain clients and tenants. Economic downturns impacting vacancy rates and rental income can negatively affect the financial performance of management companies.
Future Opportunities in US Property Management Industry
Future opportunities lie in leveraging emerging technologies, such as AI and IoT, to enhance operational efficiency and tenant experience. Expansion into new markets, including the burgeoning senior living sector and specialized commercial property types, offers significant potential. Meeting the increasing demand for sustainable and environmentally responsible property management practices presents a key opportunity for differentiation and growth. Addressing the affordable housing shortage through innovative management strategies and partnerships with government and non-profit organizations can create positive social impact and market opportunities.
Major Players in the US Property Management Industry Ecosystem
- WinnCompanies
- List Not Exhaustive 6 3 Other Companies
- CoStar Group Inc
- Jones Lang LaSalle Incorporated
- CBRE Group
- FPI Management
- Equity Residential
- Greystar Real Estate Partners
- Pinnacle Property Management
- AvalonBay Communities
- Lincoln Property Company
Key Developments in US Property Management Industry Industry
- February 2024: Wood Partners sold its property management business (38,000+ units) to Greystar, significantly increasing Greystar's market share.
- November 2023: RealPage Inc. acquired On-site Managers Inc. for USD 250 Million, enhancing its technology offerings and market position in the multifamily leasing sector.
Strategic US Property Management Industry Market Forecast
The US property management industry is poised for continued growth over the forecast period (2025-2033), driven by factors such as urbanization, technological advancements, and evolving consumer preferences. While challenges such as regulatory changes and economic fluctuations will need to be addressed, the industry's adaptability and innovative capacity should enable sustained expansion and profitability. The increasing adoption of PropTech solutions, particularly in areas such as predictive maintenance and AI-powered tenant services, will further enhance efficiency and drive growth. The market is expected to remain competitive, with further consolidation and strategic partnerships shaping the industry's landscape in the coming years.
US Property Management Industry Segmentation
-
1. End User
- 1.1. Commercial
- 1.2. Residential
-
2. Service
- 2.1. Marketing
- 2.2. Property Evaluation
- 2.3. Tenant Services
- 2.4. Maintenance
- 2.5. Other Services
US Property Management Industry Segmentation By Geography
-
1. North America
- 1.1. United States
- 1.2. Canada
- 1.3. Mexico
-
2. South America
- 2.1. Brazil
- 2.2. Argentina
- 2.3. Rest of South America
-
3. Europe
- 3.1. United Kingdom
- 3.2. Germany
- 3.3. France
- 3.4. Italy
- 3.5. Spain
- 3.6. Russia
- 3.7. Benelux
- 3.8. Nordics
- 3.9. Rest of Europe
-
4. Middle East & Africa
- 4.1. Turkey
- 4.2. Israel
- 4.3. GCC
- 4.4. North Africa
- 4.5. South Africa
- 4.6. Rest of Middle East & Africa
-
5. Asia Pacific
- 5.1. China
- 5.2. India
- 5.3. Japan
- 5.4. South Korea
- 5.5. ASEAN
- 5.6. Oceania
- 5.7. Rest of Asia Pacific
US Property Management Industry REPORT HIGHLIGHTS
| Aspects | Details |
|---|---|
| Study Period | 2019-2033 |
| Base Year | 2024 |
| Estimated Year | 2025 |
| Forecast Period | 2025-2033 |
| Historical Period | 2019-2024 |
| Growth Rate | CAGR of 3.94% from 2019-2033 |
| Segmentation |
|
Table of Contents
- 1. Introduction
- 1.1. Research Scope
- 1.2. Market Segmentation
- 1.3. Research Methodology
- 1.4. Definitions and Assumptions
- 2. Executive Summary
- 2.1. Introduction
- 3. Market Dynamics
- 3.1. Introduction
- 3.2. Market Drivers
- 3.2.1. Increasing Demand from the Commercial Segment is Driving the Market; Increasing Disposable Income of Consumers is Driving the market
- 3.3. Market Restrains
- 3.3.1. Economic Uncertainties are Restraining the Market
- 3.4. Market Trends
- 3.4.1. Demand from the Residential Sector is Supporting the Market
- 4. Market Factor Analysis
- 4.1. Porters Five Forces
- 4.2. Supply/Value Chain
- 4.3. PESTEL analysis
- 4.4. Market Entropy
- 4.5. Patent/Trademark Analysis
- 5. Global US Property Management Industry Analysis, Insights and Forecast, 2019-2031
- 5.1. Market Analysis, Insights and Forecast - by End User
- 5.1.1. Commercial
- 5.1.2. Residential
- 5.2. Market Analysis, Insights and Forecast - by Service
- 5.2.1. Marketing
- 5.2.2. Property Evaluation
- 5.2.3. Tenant Services
- 5.2.4. Maintenance
- 5.2.5. Other Services
- 5.3. Market Analysis, Insights and Forecast - by Region
- 5.3.1. North America
- 5.3.2. South America
- 5.3.3. Europe
- 5.3.4. Middle East & Africa
- 5.3.5. Asia Pacific
- 5.1. Market Analysis, Insights and Forecast - by End User
- 6. North America US Property Management Industry Analysis, Insights and Forecast, 2019-2031
- 6.1. Market Analysis, Insights and Forecast - by End User
- 6.1.1. Commercial
- 6.1.2. Residential
- 6.2. Market Analysis, Insights and Forecast - by Service
- 6.2.1. Marketing
- 6.2.2. Property Evaluation
- 6.2.3. Tenant Services
- 6.2.4. Maintenance
- 6.2.5. Other Services
- 6.1. Market Analysis, Insights and Forecast - by End User
- 7. South America US Property Management Industry Analysis, Insights and Forecast, 2019-2031
- 7.1. Market Analysis, Insights and Forecast - by End User
- 7.1.1. Commercial
- 7.1.2. Residential
- 7.2. Market Analysis, Insights and Forecast - by Service
- 7.2.1. Marketing
- 7.2.2. Property Evaluation
- 7.2.3. Tenant Services
- 7.2.4. Maintenance
- 7.2.5. Other Services
- 7.1. Market Analysis, Insights and Forecast - by End User
- 8. Europe US Property Management Industry Analysis, Insights and Forecast, 2019-2031
- 8.1. Market Analysis, Insights and Forecast - by End User
- 8.1.1. Commercial
- 8.1.2. Residential
- 8.2. Market Analysis, Insights and Forecast - by Service
- 8.2.1. Marketing
- 8.2.2. Property Evaluation
- 8.2.3. Tenant Services
- 8.2.4. Maintenance
- 8.2.5. Other Services
- 8.1. Market Analysis, Insights and Forecast - by End User
- 9. Middle East & Africa US Property Management Industry Analysis, Insights and Forecast, 2019-2031
- 9.1. Market Analysis, Insights and Forecast - by End User
- 9.1.1. Commercial
- 9.1.2. Residential
- 9.2. Market Analysis, Insights and Forecast - by Service
- 9.2.1. Marketing
- 9.2.2. Property Evaluation
- 9.2.3. Tenant Services
- 9.2.4. Maintenance
- 9.2.5. Other Services
- 9.1. Market Analysis, Insights and Forecast - by End User
- 10. Asia Pacific US Property Management Industry Analysis, Insights and Forecast, 2019-2031
- 10.1. Market Analysis, Insights and Forecast - by End User
- 10.1.1. Commercial
- 10.1.2. Residential
- 10.2. Market Analysis, Insights and Forecast - by Service
- 10.2.1. Marketing
- 10.2.2. Property Evaluation
- 10.2.3. Tenant Services
- 10.2.4. Maintenance
- 10.2.5. Other Services
- 10.1. Market Analysis, Insights and Forecast - by End User
- 11. Northeast US Property Management Industry Analysis, Insights and Forecast, 2019-2031
- 12. Southeast US Property Management Industry Analysis, Insights and Forecast, 2019-2031
- 13. Midwest US Property Management Industry Analysis, Insights and Forecast, 2019-2031
- 14. Southwest US Property Management Industry Analysis, Insights and Forecast, 2019-2031
- 15. West US Property Management Industry Analysis, Insights and Forecast, 2019-2031
- 16. Competitive Analysis
- 16.1. Global Market Share Analysis 2024
- 16.2. Company Profiles
- 16.2.1 WinnCompanies**List Not Exhaustive 6 3 Other Companie
- 16.2.1.1. Overview
- 16.2.1.2. Products
- 16.2.1.3. SWOT Analysis
- 16.2.1.4. Recent Developments
- 16.2.1.5. Financials (Based on Availability)
- 16.2.2 CoStar Group Inc
- 16.2.2.1. Overview
- 16.2.2.2. Products
- 16.2.2.3. SWOT Analysis
- 16.2.2.4. Recent Developments
- 16.2.2.5. Financials (Based on Availability)
- 16.2.3 Jones Lang LaSalle Incorporated
- 16.2.3.1. Overview
- 16.2.3.2. Products
- 16.2.3.3. SWOT Analysis
- 16.2.3.4. Recent Developments
- 16.2.3.5. Financials (Based on Availability)
- 16.2.4 CBRE Group
- 16.2.4.1. Overview
- 16.2.4.2. Products
- 16.2.4.3. SWOT Analysis
- 16.2.4.4. Recent Developments
- 16.2.4.5. Financials (Based on Availability)
- 16.2.5 FPI Management
- 16.2.5.1. Overview
- 16.2.5.2. Products
- 16.2.5.3. SWOT Analysis
- 16.2.5.4. Recent Developments
- 16.2.5.5. Financials (Based on Availability)
- 16.2.6 Equity Residential
- 16.2.6.1. Overview
- 16.2.6.2. Products
- 16.2.6.3. SWOT Analysis
- 16.2.6.4. Recent Developments
- 16.2.6.5. Financials (Based on Availability)
- 16.2.7 Greystar Real Estate Partners
- 16.2.7.1. Overview
- 16.2.7.2. Products
- 16.2.7.3. SWOT Analysis
- 16.2.7.4. Recent Developments
- 16.2.7.5. Financials (Based on Availability)
- 16.2.8 Pinnacle Property Management
- 16.2.8.1. Overview
- 16.2.8.2. Products
- 16.2.8.3. SWOT Analysis
- 16.2.8.4. Recent Developments
- 16.2.8.5. Financials (Based on Availability)
- 16.2.9 AvalonBay Communities
- 16.2.9.1. Overview
- 16.2.9.2. Products
- 16.2.9.3. SWOT Analysis
- 16.2.9.4. Recent Developments
- 16.2.9.5. Financials (Based on Availability)
- 16.2.10 Lincoln Property Company
- 16.2.10.1. Overview
- 16.2.10.2. Products
- 16.2.10.3. SWOT Analysis
- 16.2.10.4. Recent Developments
- 16.2.10.5. Financials (Based on Availability)
- 16.2.1 WinnCompanies**List Not Exhaustive 6 3 Other Companie
List of Figures
- Figure 1: Global US Property Management Industry Revenue Breakdown (Million, %) by Region 2024 & 2032
- Figure 2: United states US Property Management Industry Revenue (Million), by Country 2024 & 2032
- Figure 3: United states US Property Management Industry Revenue Share (%), by Country 2024 & 2032
- Figure 4: North America US Property Management Industry Revenue (Million), by End User 2024 & 2032
- Figure 5: North America US Property Management Industry Revenue Share (%), by End User 2024 & 2032
- Figure 6: North America US Property Management Industry Revenue (Million), by Service 2024 & 2032
- Figure 7: North America US Property Management Industry Revenue Share (%), by Service 2024 & 2032
- Figure 8: North America US Property Management Industry Revenue (Million), by Country 2024 & 2032
- Figure 9: North America US Property Management Industry Revenue Share (%), by Country 2024 & 2032
- Figure 10: South America US Property Management Industry Revenue (Million), by End User 2024 & 2032
- Figure 11: South America US Property Management Industry Revenue Share (%), by End User 2024 & 2032
- Figure 12: South America US Property Management Industry Revenue (Million), by Service 2024 & 2032
- Figure 13: South America US Property Management Industry Revenue Share (%), by Service 2024 & 2032
- Figure 14: South America US Property Management Industry Revenue (Million), by Country 2024 & 2032
- Figure 15: South America US Property Management Industry Revenue Share (%), by Country 2024 & 2032
- Figure 16: Europe US Property Management Industry Revenue (Million), by End User 2024 & 2032
- Figure 17: Europe US Property Management Industry Revenue Share (%), by End User 2024 & 2032
- Figure 18: Europe US Property Management Industry Revenue (Million), by Service 2024 & 2032
- Figure 19: Europe US Property Management Industry Revenue Share (%), by Service 2024 & 2032
- Figure 20: Europe US Property Management Industry Revenue (Million), by Country 2024 & 2032
- Figure 21: Europe US Property Management Industry Revenue Share (%), by Country 2024 & 2032
- Figure 22: Middle East & Africa US Property Management Industry Revenue (Million), by End User 2024 & 2032
- Figure 23: Middle East & Africa US Property Management Industry Revenue Share (%), by End User 2024 & 2032
- Figure 24: Middle East & Africa US Property Management Industry Revenue (Million), by Service 2024 & 2032
- Figure 25: Middle East & Africa US Property Management Industry Revenue Share (%), by Service 2024 & 2032
- Figure 26: Middle East & Africa US Property Management Industry Revenue (Million), by Country 2024 & 2032
- Figure 27: Middle East & Africa US Property Management Industry Revenue Share (%), by Country 2024 & 2032
- Figure 28: Asia Pacific US Property Management Industry Revenue (Million), by End User 2024 & 2032
- Figure 29: Asia Pacific US Property Management Industry Revenue Share (%), by End User 2024 & 2032
- Figure 30: Asia Pacific US Property Management Industry Revenue (Million), by Service 2024 & 2032
- Figure 31: Asia Pacific US Property Management Industry Revenue Share (%), by Service 2024 & 2032
- Figure 32: Asia Pacific US Property Management Industry Revenue (Million), by Country 2024 & 2032
- Figure 33: Asia Pacific US Property Management Industry Revenue Share (%), by Country 2024 & 2032
List of Tables
- Table 1: Global US Property Management Industry Revenue Million Forecast, by Region 2019 & 2032
- Table 2: Global US Property Management Industry Revenue Million Forecast, by End User 2019 & 2032
- Table 3: Global US Property Management Industry Revenue Million Forecast, by Service 2019 & 2032
- Table 4: Global US Property Management Industry Revenue Million Forecast, by Region 2019 & 2032
- Table 5: Global US Property Management Industry Revenue Million Forecast, by Country 2019 & 2032
- Table 6: Northeast US Property Management Industry Revenue (Million) Forecast, by Application 2019 & 2032
- Table 7: Southeast US Property Management Industry Revenue (Million) Forecast, by Application 2019 & 2032
- Table 8: Midwest US Property Management Industry Revenue (Million) Forecast, by Application 2019 & 2032
- Table 9: Southwest US Property Management Industry Revenue (Million) Forecast, by Application 2019 & 2032
- Table 10: West US Property Management Industry Revenue (Million) Forecast, by Application 2019 & 2032
- Table 11: Global US Property Management Industry Revenue Million Forecast, by End User 2019 & 2032
- Table 12: Global US Property Management Industry Revenue Million Forecast, by Service 2019 & 2032
- Table 13: Global US Property Management Industry Revenue Million Forecast, by Country 2019 & 2032
- Table 14: United States US Property Management Industry Revenue (Million) Forecast, by Application 2019 & 2032
- Table 15: Canada US Property Management Industry Revenue (Million) Forecast, by Application 2019 & 2032
- Table 16: Mexico US Property Management Industry Revenue (Million) Forecast, by Application 2019 & 2032
- Table 17: Global US Property Management Industry Revenue Million Forecast, by End User 2019 & 2032
- Table 18: Global US Property Management Industry Revenue Million Forecast, by Service 2019 & 2032
- Table 19: Global US Property Management Industry Revenue Million Forecast, by Country 2019 & 2032
- Table 20: Brazil US Property Management Industry Revenue (Million) Forecast, by Application 2019 & 2032
- Table 21: Argentina US Property Management Industry Revenue (Million) Forecast, by Application 2019 & 2032
- Table 22: Rest of South America US Property Management Industry Revenue (Million) Forecast, by Application 2019 & 2032
- Table 23: Global US Property Management Industry Revenue Million Forecast, by End User 2019 & 2032
- Table 24: Global US Property Management Industry Revenue Million Forecast, by Service 2019 & 2032
- Table 25: Global US Property Management Industry Revenue Million Forecast, by Country 2019 & 2032
- Table 26: United Kingdom US Property Management Industry Revenue (Million) Forecast, by Application 2019 & 2032
- Table 27: Germany US Property Management Industry Revenue (Million) Forecast, by Application 2019 & 2032
- Table 28: France US Property Management Industry Revenue (Million) Forecast, by Application 2019 & 2032
- Table 29: Italy US Property Management Industry Revenue (Million) Forecast, by Application 2019 & 2032
- Table 30: Spain US Property Management Industry Revenue (Million) Forecast, by Application 2019 & 2032
- Table 31: Russia US Property Management Industry Revenue (Million) Forecast, by Application 2019 & 2032
- Table 32: Benelux US Property Management Industry Revenue (Million) Forecast, by Application 2019 & 2032
- Table 33: Nordics US Property Management Industry Revenue (Million) Forecast, by Application 2019 & 2032
- Table 34: Rest of Europe US Property Management Industry Revenue (Million) Forecast, by Application 2019 & 2032
- Table 35: Global US Property Management Industry Revenue Million Forecast, by End User 2019 & 2032
- Table 36: Global US Property Management Industry Revenue Million Forecast, by Service 2019 & 2032
- Table 37: Global US Property Management Industry Revenue Million Forecast, by Country 2019 & 2032
- Table 38: Turkey US Property Management Industry Revenue (Million) Forecast, by Application 2019 & 2032
- Table 39: Israel US Property Management Industry Revenue (Million) Forecast, by Application 2019 & 2032
- Table 40: GCC US Property Management Industry Revenue (Million) Forecast, by Application 2019 & 2032
- Table 41: North Africa US Property Management Industry Revenue (Million) Forecast, by Application 2019 & 2032
- Table 42: South Africa US Property Management Industry Revenue (Million) Forecast, by Application 2019 & 2032
- Table 43: Rest of Middle East & Africa US Property Management Industry Revenue (Million) Forecast, by Application 2019 & 2032
- Table 44: Global US Property Management Industry Revenue Million Forecast, by End User 2019 & 2032
- Table 45: Global US Property Management Industry Revenue Million Forecast, by Service 2019 & 2032
- Table 46: Global US Property Management Industry Revenue Million Forecast, by Country 2019 & 2032
- Table 47: China US Property Management Industry Revenue (Million) Forecast, by Application 2019 & 2032
- Table 48: India US Property Management Industry Revenue (Million) Forecast, by Application 2019 & 2032
- Table 49: Japan US Property Management Industry Revenue (Million) Forecast, by Application 2019 & 2032
- Table 50: South Korea US Property Management Industry Revenue (Million) Forecast, by Application 2019 & 2032
- Table 51: ASEAN US Property Management Industry Revenue (Million) Forecast, by Application 2019 & 2032
- Table 52: Oceania US Property Management Industry Revenue (Million) Forecast, by Application 2019 & 2032
- Table 53: Rest of Asia Pacific US Property Management Industry Revenue (Million) Forecast, by Application 2019 & 2032
Frequently Asked Questions
1. What is the projected Compound Annual Growth Rate (CAGR) of the US Property Management Industry?
The projected CAGR is approximately 3.94%.
2. Which companies are prominent players in the US Property Management Industry?
Key companies in the market include WinnCompanies**List Not Exhaustive 6 3 Other Companie, CoStar Group Inc, Jones Lang LaSalle Incorporated, CBRE Group, FPI Management, Equity Residential, Greystar Real Estate Partners, Pinnacle Property Management, AvalonBay Communities, Lincoln Property Company.
3. What are the main segments of the US Property Management Industry?
The market segments include End User, Service.
4. Can you provide details about the market size?
The market size is estimated to be USD 81.52 Million as of 2022.
5. What are some drivers contributing to market growth?
Increasing Demand from the Commercial Segment is Driving the Market; Increasing Disposable Income of Consumers is Driving the market.
6. What are the notable trends driving market growth?
Demand from the Residential Sector is Supporting the Market.
7. Are there any restraints impacting market growth?
Economic Uncertainties are Restraining the Market.
8. Can you provide examples of recent developments in the market?
February 2024: Wood Partners, the 4th-largest real estate developer in the United States, sold its property management business for its 38,000+ units in 17 states to Greystar (Charleston, South Carolina), the country's largest apartment management company.
9. What pricing options are available for accessing the report?
Pricing options include single-user, multi-user, and enterprise licenses priced at USD 3800, USD 4500, and USD 5800 respectively.
10. Is the market size provided in terms of value or volume?
The market size is provided in terms of value, measured in Million.
11. Are there any specific market keywords associated with the report?
Yes, the market keyword associated with the report is "US Property Management Industry," which aids in identifying and referencing the specific market segment covered.
12. How do I determine which pricing option suits my needs best?
The pricing options vary based on user requirements and access needs. Individual users may opt for single-user licenses, while businesses requiring broader access may choose multi-user or enterprise licenses for cost-effective access to the report.
13. Are there any additional resources or data provided in the US Property Management Industry report?
While the report offers comprehensive insights, it's advisable to review the specific contents or supplementary materials provided to ascertain if additional resources or data are available.
14. How can I stay updated on further developments or reports in the US Property Management Industry?
To stay informed about further developments, trends, and reports in the US Property Management Industry, consider subscribing to industry newsletters, following relevant companies and organizations, or regularly checking reputable industry news sources and publications.
Methodology
Step 1 - Identification of Relevant Samples Size from Population Database


Step 2 - Approaches for Defining Global Market Size (Value, Volume* & Price*)

Note*: In applicable scenarios
Step 3 - Data Sources
Primary Research
- Web Analytics
- Survey Reports
- Research Institute
- Latest Research Reports
- Opinion Leaders
Secondary Research
- Annual Reports
- White Paper
- Latest Press Release
- Industry Association
- Paid Database
- Investor Presentations

Step 4 - Data Triangulation
Involves using different sources of information in order to increase the validity of a study
These sources are likely to be stakeholders in a program - participants, other researchers, program staff, other community members, and so on.
Then we put all data in single framework & apply various statistical tools to find out the dynamic on the market.
During the analysis stage, feedback from the stakeholder groups would be compared to determine areas of agreement as well as areas of divergence
