

Key Insights
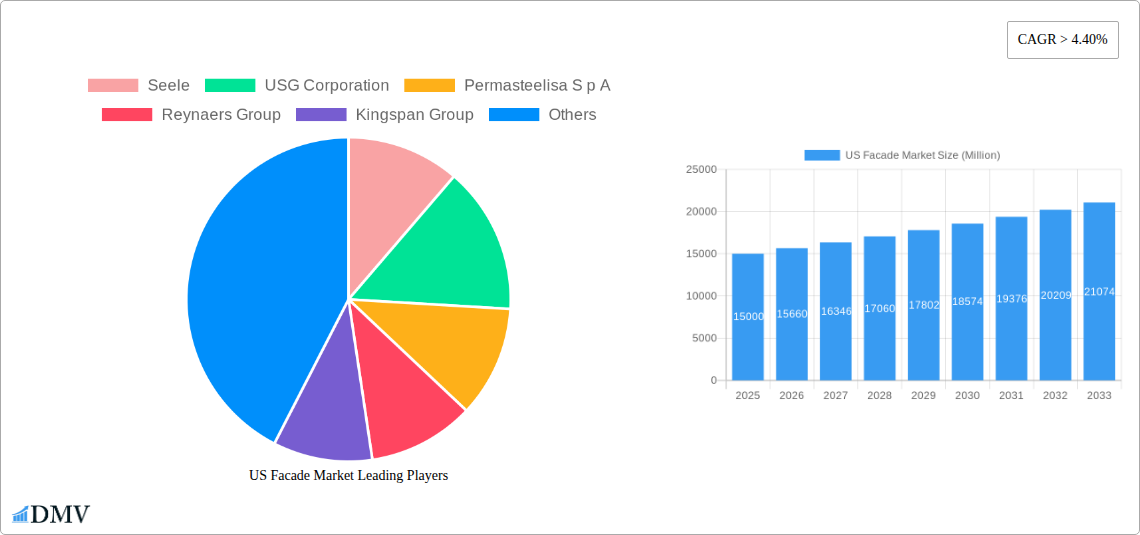
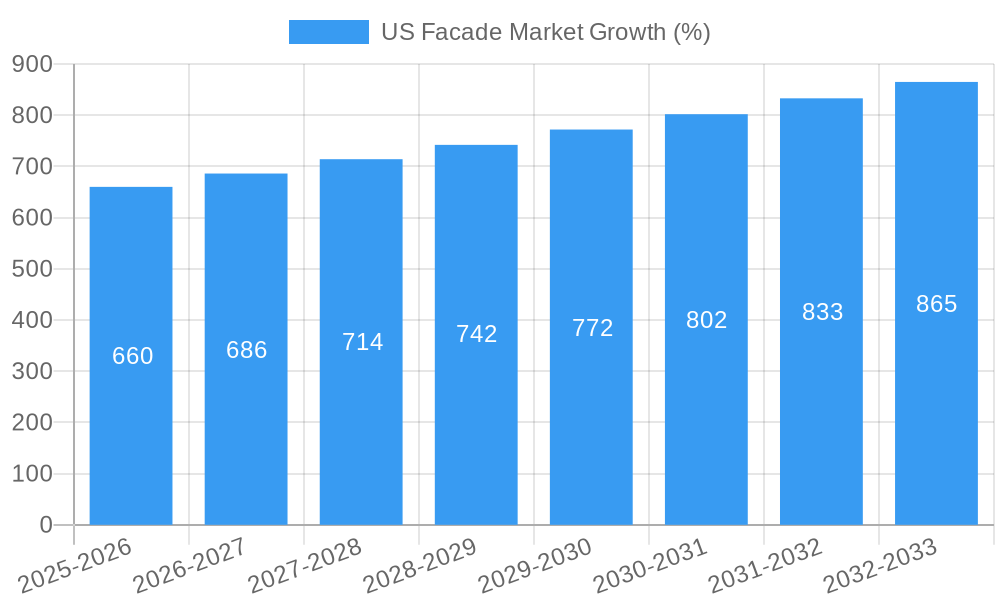
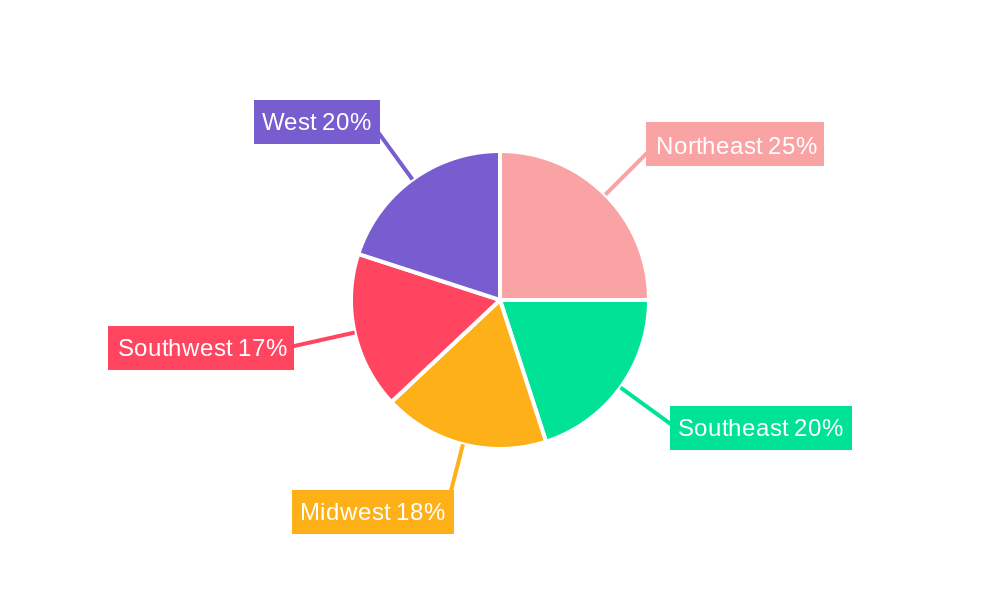
The US facade market, currently experiencing robust growth, is projected to maintain a Compound Annual Growth Rate (CAGR) exceeding 4.40% from 2025 to 2033. This expansion is fueled by several key drivers. The burgeoning construction industry, particularly in commercial and residential sectors, creates significant demand for aesthetically pleasing and energy-efficient facades. Growing urbanization and the increasing preference for modern architectural designs further stimulate market growth. Technological advancements in materials science, leading to the development of innovative and sustainable facade solutions like ventilated facades, contribute to the market's expansion. Furthermore, stringent building codes and regulations promoting energy efficiency are pushing the adoption of high-performance facade systems. The market segmentation reveals a preference for ventilated facades due to their superior energy efficiency and improved building longevity. Glass and metal remain the dominant materials, although the use of sustainable alternatives such as plastic and fiber composites is steadily gaining traction. Geographically, the Northeast and West regions of the United States represent substantial market shares, reflecting strong construction activity and a higher concentration of high-rise buildings. However, growth is anticipated across all regions, driven by increasing investments in infrastructure development and urban renewal projects.
Despite the positive outlook, certain restraints pose challenges to market growth. Fluctuations in raw material prices, particularly for metals and glass, can impact production costs and profitability. Furthermore, the complexities associated with the installation of advanced facade systems and the need for specialized labor may restrain market growth, particularly in smaller projects. The competitive landscape is fragmented, with both large multinational corporations and smaller specialized firms vying for market share. Successful companies will need to differentiate themselves through innovative product offerings, robust supply chain management, and a strong focus on customer service to thrive in this dynamic market. The market's future trajectory depends heavily on macroeconomic factors, including overall economic growth and government policies supporting sustainable construction practices. Sustained growth is expected, driven by the continuous need for advanced and sustainable building envelopes.
US Facade Market: A Comprehensive Market Report (2019-2033)
This insightful report provides a detailed analysis of the US Facade Market, offering a comprehensive overview of market trends, competitive landscape, and future growth projections from 2019 to 2033. The study encompasses historical data (2019-2024), a base year of 2025, and a forecast period extending to 2033. This report is crucial for stakeholders seeking to understand the dynamics of this multi-billion dollar industry and make informed strategic decisions. Key segments analyzed include ventilated, non-ventilated, and other facade types; materials such as glass, metal, plastic and fibers, stone, and others; and end-users encompassing commercial, residential, and other sectors. The market size is estimated at XX Million in 2025, with significant growth potential projected for the forecast period.
US Facade Market Composition & Trends
This section delves into the intricate structure of the US facade market, evaluating its concentration, innovation drivers, regulatory environment, substitute products, end-user profiles, and mergers and acquisitions (M&A) activities. The market exhibits a moderately concentrated structure, with key players like Seele, USG Corporation, and Permasteelisa S p A holding significant market share. However, the presence of numerous smaller players and regional specialists contributes to a dynamic competitive landscape.
- Market Share Distribution: The top 5 players collectively hold an estimated xx% of the market share in 2025, indicating a moderately consolidated industry. Further analysis reveals that the share of smaller players is significant and dynamic.
- Innovation Catalysts: Stringent building codes and growing demand for energy-efficient buildings are driving innovations in materials and designs, leading to the development of advanced facade systems.
- Regulatory Landscape: Building codes and energy efficiency standards significantly influence material selection and design choices, creating both challenges and opportunities for market players.
- Substitute Products: While traditional facade materials dominate, the emergence of innovative materials like high-performance glass and advanced composite panels presents increasing competition.
- End-User Profiles: The commercial sector dominates the market, driven by large-scale construction projects and renovation activities. However, the residential segment shows promising growth potential fueled by increased construction activities and renovation trends.
- M&A Activities: The sector has witnessed several notable M&A deals in the recent past, with deal values averaging xx Million. These activities reflect the industry's consolidation trend and pursuit of technological advancements.
US Facade Market Industry Evolution
The US facade market has experienced robust growth over the past few years, driven by several factors. From 2019 to 2024, the market registered a Compound Annual Growth Rate (CAGR) of xx%, exceeding the general building materials sector’s average. This growth is primarily attributed to the increasing demand for energy-efficient buildings, coupled with architectural advancements and rising disposable incomes. Technological advancements, including the use of Building Information Modeling (BIM) and the adoption of sustainable materials, have further propelled market expansion. Consumer preferences are shifting towards aesthetically pleasing and energy-efficient facade systems, stimulating innovation and market diversification. Furthermore, government initiatives promoting green building practices have played a pivotal role in driving the market's evolution.
Leading Regions, Countries, or Segments in US Facade Market
The US Facade market displays regional variations in growth and dominance. The analysis highlights the significant contribution of specific regions (e.g., Northeast, West Coast) and segments within the market.
Key Drivers: Factors such as robust construction activities, high disposable incomes, and favorable government policies contribute to regional variations. For example, stringent energy efficiency regulations in certain states drive the adoption of advanced facade systems.
Dominant Segments: The commercial segment dominates the market due to large-scale construction projects in metropolitan areas. The glass material segment holds a significant market share due to its aesthetic appeal and thermal performance. Ventilated facades are also gaining traction due to their energy efficiency advantages.
In-depth Analysis: Detailed analysis is provided on the specific factors driving segment dominance. This includes market size, growth rates, and key drivers within each material and end-user segment. This helps stakeholders identify high-potential areas for investments and business expansions.
US Facade Market Product Innovations
Recent innovations in the US facade market focus on enhancing energy efficiency, durability, and aesthetics. Manufacturers are introducing advanced materials like self-cleaning glass, high-performance insulation panels, and dynamic facade systems that adapt to changing weather conditions. These innovations offer significant improvements in thermal performance, reduce energy consumption, and enhance the building's overall aesthetics. Key features of these products include improved sound insulation, reduced maintenance requirements, and increased longevity.
Propelling Factors for US Facade Market Growth
Several factors are driving the growth of the US facade market. Firstly, the increasing focus on energy efficiency and sustainability is pushing the adoption of energy-saving facade systems. Secondly, growing urbanization and rising construction activities in major cities contribute significantly to the market's expansion. Lastly, government initiatives and incentives for green buildings further stimulate market growth. The implementation of new building codes and energy efficiency standards is directly influencing the demand for improved facade solutions.
Obstacles in the US Facade Market
The US facade market faces challenges such as supply chain disruptions impacting material availability and costs. Furthermore, fluctuating raw material prices can cause instability in the market. Finally, intense competition among existing and new market players adds to the pressure.
Future Opportunities in US Facade Market
Future opportunities lie in the growing demand for smart building technologies and the increasing adoption of integrated facade systems. Furthermore, the development of sustainable and recyclable materials will drive future growth.
Major Players in the US Facade Market Ecosystem
- Seele
- USG Corporation
- Permasteelisa S p A
- Reynaers Group
- Kingspan Group
- Louisiana Pacific Corporation
- Guardian Industries
- New Hudson Facades
- Georgia-Pacific L L C
- Sky Facade Inc
- Elemex® Inc
- Alphacladding
- GAMCO CORPORATION
Key Developments in US Facade Market Industry
- November 2022: LP Building Solutions (LP) announced plans to add a second line to its renovated SmartSide® facility in Houlton, Maine, increasing annual production by 340 Million square feet and creating over 100 new jobs. This significantly boosts the supply of a key facade material.
- April 2022: The town of Mocksville launched a facade incentive grant program, offering up to USD 1,500 (or 50% of project costs) for commercial building renovations in the Central Business District. This initiative stimulates renovation projects and boosts market demand.
Strategic US Facade Market Forecast
The US facade market is poised for significant growth driven by increasing urbanization, sustainability concerns, and technological advancements. The market is expected to witness strong growth over the forecast period, driven by increasing demand for energy-efficient buildings and innovative facade systems. The focus on sustainable materials and technological integration will shape future market dynamics, presenting opportunities for innovative companies to thrive.
US Facade Market Segmentation
-
1. Type
- 1.1. Ventilated
- 1.2. Non-Ventilated
- 1.3. Others
-
2. Material
- 2.1. Glass
- 2.2. Metal
- 2.3. Plastic and Fibres
- 2.4. Stones
- 2.5. Others
-
3. End Users
- 3.1. Commercial
- 3.2. Residential
- 3.3. Others
US Facade Market Segmentation By Geography
-
1. North America
- 1.1. United States
- 1.2. Canada
- 1.3. Mexico
-
2. South America
- 2.1. Brazil
- 2.2. Argentina
- 2.3. Rest of South America
-
3. Europe
- 3.1. United Kingdom
- 3.2. Germany
- 3.3. France
- 3.4. Italy
- 3.5. Spain
- 3.6. Russia
- 3.7. Benelux
- 3.8. Nordics
- 3.9. Rest of Europe
-
4. Middle East & Africa
- 4.1. Turkey
- 4.2. Israel
- 4.3. GCC
- 4.4. North Africa
- 4.5. South Africa
- 4.6. Rest of Middle East & Africa
-
5. Asia Pacific
- 5.1. China
- 5.2. India
- 5.3. Japan
- 5.4. South Korea
- 5.5. ASEAN
- 5.6. Oceania
- 5.7. Rest of Asia Pacific
US Facade Market REPORT HIGHLIGHTS
| Aspects | Details |
|---|---|
| Study Period | 2019-2033 |
| Base Year | 2024 |
| Estimated Year | 2025 |
| Forecast Period | 2025-2033 |
| Historical Period | 2019-2024 |
| Growth Rate | CAGR of > 4.40% from 2019-2033 |
| Segmentation |
|
Table of Contents
- 1. Introduction
- 1.1. Research Scope
- 1.2. Market Segmentation
- 1.3. Research Methodology
- 1.4. Definitions and Assumptions
- 2. Executive Summary
- 2.1. Introduction
- 3. Market Dynamics
- 3.1. Introduction
- 3.2. Market Drivers
- 3.2.1. Rising Commercial Property Development; Rapid Digitalization of Commercial Construction
- 3.3. Market Restrains
- 3.3.1. Emerging Safety and Labour Issues; Rise in Cost of Construction
- 3.4. Market Trends
- 3.4.1. Glass Facades are Witnessing a Rise in Adoption
- 4. Market Factor Analysis
- 4.1. Porters Five Forces
- 4.2. Supply/Value Chain
- 4.3. PESTEL analysis
- 4.4. Market Entropy
- 4.5. Patent/Trademark Analysis
- 5. Global US Facade Market Analysis, Insights and Forecast, 2019-2031
- 5.1. Market Analysis, Insights and Forecast - by Type
- 5.1.1. Ventilated
- 5.1.2. Non-Ventilated
- 5.1.3. Others
- 5.2. Market Analysis, Insights and Forecast - by Material
- 5.2.1. Glass
- 5.2.2. Metal
- 5.2.3. Plastic and Fibres
- 5.2.4. Stones
- 5.2.5. Others
- 5.3. Market Analysis, Insights and Forecast - by End Users
- 5.3.1. Commercial
- 5.3.2. Residential
- 5.3.3. Others
- 5.4. Market Analysis, Insights and Forecast - by Region
- 5.4.1. North America
- 5.4.2. South America
- 5.4.3. Europe
- 5.4.4. Middle East & Africa
- 5.4.5. Asia Pacific
- 5.1. Market Analysis, Insights and Forecast - by Type
- 6. North America US Facade Market Analysis, Insights and Forecast, 2019-2031
- 6.1. Market Analysis, Insights and Forecast - by Type
- 6.1.1. Ventilated
- 6.1.2. Non-Ventilated
- 6.1.3. Others
- 6.2. Market Analysis, Insights and Forecast - by Material
- 6.2.1. Glass
- 6.2.2. Metal
- 6.2.3. Plastic and Fibres
- 6.2.4. Stones
- 6.2.5. Others
- 6.3. Market Analysis, Insights and Forecast - by End Users
- 6.3.1. Commercial
- 6.3.2. Residential
- 6.3.3. Others
- 6.1. Market Analysis, Insights and Forecast - by Type
- 7. South America US Facade Market Analysis, Insights and Forecast, 2019-2031
- 7.1. Market Analysis, Insights and Forecast - by Type
- 7.1.1. Ventilated
- 7.1.2. Non-Ventilated
- 7.1.3. Others
- 7.2. Market Analysis, Insights and Forecast - by Material
- 7.2.1. Glass
- 7.2.2. Metal
- 7.2.3. Plastic and Fibres
- 7.2.4. Stones
- 7.2.5. Others
- 7.3. Market Analysis, Insights and Forecast - by End Users
- 7.3.1. Commercial
- 7.3.2. Residential
- 7.3.3. Others
- 7.1. Market Analysis, Insights and Forecast - by Type
- 8. Europe US Facade Market Analysis, Insights and Forecast, 2019-2031
- 8.1. Market Analysis, Insights and Forecast - by Type
- 8.1.1. Ventilated
- 8.1.2. Non-Ventilated
- 8.1.3. Others
- 8.2. Market Analysis, Insights and Forecast - by Material
- 8.2.1. Glass
- 8.2.2. Metal
- 8.2.3. Plastic and Fibres
- 8.2.4. Stones
- 8.2.5. Others
- 8.3. Market Analysis, Insights and Forecast - by End Users
- 8.3.1. Commercial
- 8.3.2. Residential
- 8.3.3. Others
- 8.1. Market Analysis, Insights and Forecast - by Type
- 9. Middle East & Africa US Facade Market Analysis, Insights and Forecast, 2019-2031
- 9.1. Market Analysis, Insights and Forecast - by Type
- 9.1.1. Ventilated
- 9.1.2. Non-Ventilated
- 9.1.3. Others
- 9.2. Market Analysis, Insights and Forecast - by Material
- 9.2.1. Glass
- 9.2.2. Metal
- 9.2.3. Plastic and Fibres
- 9.2.4. Stones
- 9.2.5. Others
- 9.3. Market Analysis, Insights and Forecast - by End Users
- 9.3.1. Commercial
- 9.3.2. Residential
- 9.3.3. Others
- 9.1. Market Analysis, Insights and Forecast - by Type
- 10. Asia Pacific US Facade Market Analysis, Insights and Forecast, 2019-2031
- 10.1. Market Analysis, Insights and Forecast - by Type
- 10.1.1. Ventilated
- 10.1.2. Non-Ventilated
- 10.1.3. Others
- 10.2. Market Analysis, Insights and Forecast - by Material
- 10.2.1. Glass
- 10.2.2. Metal
- 10.2.3. Plastic and Fibres
- 10.2.4. Stones
- 10.2.5. Others
- 10.3. Market Analysis, Insights and Forecast - by End Users
- 10.3.1. Commercial
- 10.3.2. Residential
- 10.3.3. Others
- 10.1. Market Analysis, Insights and Forecast - by Type
- 11. Northeast US Facade Market Analysis, Insights and Forecast, 2019-2031
- 12. Southeast US Facade Market Analysis, Insights and Forecast, 2019-2031
- 13. Midwest US Facade Market Analysis, Insights and Forecast, 2019-2031
- 14. Southwest US Facade Market Analysis, Insights and Forecast, 2019-2031
- 15. West US Facade Market Analysis, Insights and Forecast, 2019-2031
- 16. Competitive Analysis
- 16.1. Global Market Share Analysis 2024
- 16.2. Company Profiles
- 16.2.1 Seele
- 16.2.1.1. Overview
- 16.2.1.2. Products
- 16.2.1.3. SWOT Analysis
- 16.2.1.4. Recent Developments
- 16.2.1.5. Financials (Based on Availability)
- 16.2.2 USG Corporation
- 16.2.2.1. Overview
- 16.2.2.2. Products
- 16.2.2.3. SWOT Analysis
- 16.2.2.4. Recent Developments
- 16.2.2.5. Financials (Based on Availability)
- 16.2.3 Permasteelisa S p A
- 16.2.3.1. Overview
- 16.2.3.2. Products
- 16.2.3.3. SWOT Analysis
- 16.2.3.4. Recent Developments
- 16.2.3.5. Financials (Based on Availability)
- 16.2.4 Reynaers Group
- 16.2.4.1. Overview
- 16.2.4.2. Products
- 16.2.4.3. SWOT Analysis
- 16.2.4.4. Recent Developments
- 16.2.4.5. Financials (Based on Availability)
- 16.2.5 Kingspan Group
- 16.2.5.1. Overview
- 16.2.5.2. Products
- 16.2.5.3. SWOT Analysis
- 16.2.5.4. Recent Developments
- 16.2.5.5. Financials (Based on Availability)
- 16.2.6 Louisiana Pacific Corporation
- 16.2.6.1. Overview
- 16.2.6.2. Products
- 16.2.6.3. SWOT Analysis
- 16.2.6.4. Recent Developments
- 16.2.6.5. Financials (Based on Availability)
- 16.2.7 Guardian Industries
- 16.2.7.1. Overview
- 16.2.7.2. Products
- 16.2.7.3. SWOT Analysis
- 16.2.7.4. Recent Developments
- 16.2.7.5. Financials (Based on Availability)
- 16.2.8 New Hudson Facades
- 16.2.8.1. Overview
- 16.2.8.2. Products
- 16.2.8.3. SWOT Analysis
- 16.2.8.4. Recent Developments
- 16.2.8.5. Financials (Based on Availability)
- 16.2.9 Georgia-Pacific L L C
- 16.2.9.1. Overview
- 16.2.9.2. Products
- 16.2.9.3. SWOT Analysis
- 16.2.9.4. Recent Developments
- 16.2.9.5. Financials (Based on Availability)
- 16.2.10 Sky Facade Inc
- 16.2.10.1. Overview
- 16.2.10.2. Products
- 16.2.10.3. SWOT Analysis
- 16.2.10.4. Recent Developments
- 16.2.10.5. Financials (Based on Availability)
- 16.2.11 Elemex® Inc **List Not Exhaustive
- 16.2.11.1. Overview
- 16.2.11.2. Products
- 16.2.11.3. SWOT Analysis
- 16.2.11.4. Recent Developments
- 16.2.11.5. Financials (Based on Availability)
- 16.2.12 Alphacladding
- 16.2.12.1. Overview
- 16.2.12.2. Products
- 16.2.12.3. SWOT Analysis
- 16.2.12.4. Recent Developments
- 16.2.12.5. Financials (Based on Availability)
- 16.2.13 GAMCO CORPORATION
- 16.2.13.1. Overview
- 16.2.13.2. Products
- 16.2.13.3. SWOT Analysis
- 16.2.13.4. Recent Developments
- 16.2.13.5. Financials (Based on Availability)
- 16.2.1 Seele
List of Figures
- Figure 1: Global US Facade Market Revenue Breakdown (Million, %) by Region 2024 & 2032
- Figure 2: United states US Facade Market Revenue (Million), by Country 2024 & 2032
- Figure 3: United states US Facade Market Revenue Share (%), by Country 2024 & 2032
- Figure 4: North America US Facade Market Revenue (Million), by Type 2024 & 2032
- Figure 5: North America US Facade Market Revenue Share (%), by Type 2024 & 2032
- Figure 6: North America US Facade Market Revenue (Million), by Material 2024 & 2032
- Figure 7: North America US Facade Market Revenue Share (%), by Material 2024 & 2032
- Figure 8: North America US Facade Market Revenue (Million), by End Users 2024 & 2032
- Figure 9: North America US Facade Market Revenue Share (%), by End Users 2024 & 2032
- Figure 10: North America US Facade Market Revenue (Million), by Country 2024 & 2032
- Figure 11: North America US Facade Market Revenue Share (%), by Country 2024 & 2032
- Figure 12: South America US Facade Market Revenue (Million), by Type 2024 & 2032
- Figure 13: South America US Facade Market Revenue Share (%), by Type 2024 & 2032
- Figure 14: South America US Facade Market Revenue (Million), by Material 2024 & 2032
- Figure 15: South America US Facade Market Revenue Share (%), by Material 2024 & 2032
- Figure 16: South America US Facade Market Revenue (Million), by End Users 2024 & 2032
- Figure 17: South America US Facade Market Revenue Share (%), by End Users 2024 & 2032
- Figure 18: South America US Facade Market Revenue (Million), by Country 2024 & 2032
- Figure 19: South America US Facade Market Revenue Share (%), by Country 2024 & 2032
- Figure 20: Europe US Facade Market Revenue (Million), by Type 2024 & 2032
- Figure 21: Europe US Facade Market Revenue Share (%), by Type 2024 & 2032
- Figure 22: Europe US Facade Market Revenue (Million), by Material 2024 & 2032
- Figure 23: Europe US Facade Market Revenue Share (%), by Material 2024 & 2032
- Figure 24: Europe US Facade Market Revenue (Million), by End Users 2024 & 2032
- Figure 25: Europe US Facade Market Revenue Share (%), by End Users 2024 & 2032
- Figure 26: Europe US Facade Market Revenue (Million), by Country 2024 & 2032
- Figure 27: Europe US Facade Market Revenue Share (%), by Country 2024 & 2032
- Figure 28: Middle East & Africa US Facade Market Revenue (Million), by Type 2024 & 2032
- Figure 29: Middle East & Africa US Facade Market Revenue Share (%), by Type 2024 & 2032
- Figure 30: Middle East & Africa US Facade Market Revenue (Million), by Material 2024 & 2032
- Figure 31: Middle East & Africa US Facade Market Revenue Share (%), by Material 2024 & 2032
- Figure 32: Middle East & Africa US Facade Market Revenue (Million), by End Users 2024 & 2032
- Figure 33: Middle East & Africa US Facade Market Revenue Share (%), by End Users 2024 & 2032
- Figure 34: Middle East & Africa US Facade Market Revenue (Million), by Country 2024 & 2032
- Figure 35: Middle East & Africa US Facade Market Revenue Share (%), by Country 2024 & 2032
- Figure 36: Asia Pacific US Facade Market Revenue (Million), by Type 2024 & 2032
- Figure 37: Asia Pacific US Facade Market Revenue Share (%), by Type 2024 & 2032
- Figure 38: Asia Pacific US Facade Market Revenue (Million), by Material 2024 & 2032
- Figure 39: Asia Pacific US Facade Market Revenue Share (%), by Material 2024 & 2032
- Figure 40: Asia Pacific US Facade Market Revenue (Million), by End Users 2024 & 2032
- Figure 41: Asia Pacific US Facade Market Revenue Share (%), by End Users 2024 & 2032
- Figure 42: Asia Pacific US Facade Market Revenue (Million), by Country 2024 & 2032
- Figure 43: Asia Pacific US Facade Market Revenue Share (%), by Country 2024 & 2032
List of Tables
- Table 1: Global US Facade Market Revenue Million Forecast, by Region 2019 & 2032
- Table 2: Global US Facade Market Revenue Million Forecast, by Type 2019 & 2032
- Table 3: Global US Facade Market Revenue Million Forecast, by Material 2019 & 2032
- Table 4: Global US Facade Market Revenue Million Forecast, by End Users 2019 & 2032
- Table 5: Global US Facade Market Revenue Million Forecast, by Region 2019 & 2032
- Table 6: Global US Facade Market Revenue Million Forecast, by Country 2019 & 2032
- Table 7: Northeast US Facade Market Revenue (Million) Forecast, by Application 2019 & 2032
- Table 8: Southeast US Facade Market Revenue (Million) Forecast, by Application 2019 & 2032
- Table 9: Midwest US Facade Market Revenue (Million) Forecast, by Application 2019 & 2032
- Table 10: Southwest US Facade Market Revenue (Million) Forecast, by Application 2019 & 2032
- Table 11: West US Facade Market Revenue (Million) Forecast, by Application 2019 & 2032
- Table 12: Global US Facade Market Revenue Million Forecast, by Type 2019 & 2032
- Table 13: Global US Facade Market Revenue Million Forecast, by Material 2019 & 2032
- Table 14: Global US Facade Market Revenue Million Forecast, by End Users 2019 & 2032
- Table 15: Global US Facade Market Revenue Million Forecast, by Country 2019 & 2032
- Table 16: United States US Facade Market Revenue (Million) Forecast, by Application 2019 & 2032
- Table 17: Canada US Facade Market Revenue (Million) Forecast, by Application 2019 & 2032
- Table 18: Mexico US Facade Market Revenue (Million) Forecast, by Application 2019 & 2032
- Table 19: Global US Facade Market Revenue Million Forecast, by Type 2019 & 2032
- Table 20: Global US Facade Market Revenue Million Forecast, by Material 2019 & 2032
- Table 21: Global US Facade Market Revenue Million Forecast, by End Users 2019 & 2032
- Table 22: Global US Facade Market Revenue Million Forecast, by Country 2019 & 2032
- Table 23: Brazil US Facade Market Revenue (Million) Forecast, by Application 2019 & 2032
- Table 24: Argentina US Facade Market Revenue (Million) Forecast, by Application 2019 & 2032
- Table 25: Rest of South America US Facade Market Revenue (Million) Forecast, by Application 2019 & 2032
- Table 26: Global US Facade Market Revenue Million Forecast, by Type 2019 & 2032
- Table 27: Global US Facade Market Revenue Million Forecast, by Material 2019 & 2032
- Table 28: Global US Facade Market Revenue Million Forecast, by End Users 2019 & 2032
- Table 29: Global US Facade Market Revenue Million Forecast, by Country 2019 & 2032
- Table 30: United Kingdom US Facade Market Revenue (Million) Forecast, by Application 2019 & 2032
- Table 31: Germany US Facade Market Revenue (Million) Forecast, by Application 2019 & 2032
- Table 32: France US Facade Market Revenue (Million) Forecast, by Application 2019 & 2032
- Table 33: Italy US Facade Market Revenue (Million) Forecast, by Application 2019 & 2032
- Table 34: Spain US Facade Market Revenue (Million) Forecast, by Application 2019 & 2032
- Table 35: Russia US Facade Market Revenue (Million) Forecast, by Application 2019 & 2032
- Table 36: Benelux US Facade Market Revenue (Million) Forecast, by Application 2019 & 2032
- Table 37: Nordics US Facade Market Revenue (Million) Forecast, by Application 2019 & 2032
- Table 38: Rest of Europe US Facade Market Revenue (Million) Forecast, by Application 2019 & 2032
- Table 39: Global US Facade Market Revenue Million Forecast, by Type 2019 & 2032
- Table 40: Global US Facade Market Revenue Million Forecast, by Material 2019 & 2032
- Table 41: Global US Facade Market Revenue Million Forecast, by End Users 2019 & 2032
- Table 42: Global US Facade Market Revenue Million Forecast, by Country 2019 & 2032
- Table 43: Turkey US Facade Market Revenue (Million) Forecast, by Application 2019 & 2032
- Table 44: Israel US Facade Market Revenue (Million) Forecast, by Application 2019 & 2032
- Table 45: GCC US Facade Market Revenue (Million) Forecast, by Application 2019 & 2032
- Table 46: North Africa US Facade Market Revenue (Million) Forecast, by Application 2019 & 2032
- Table 47: South Africa US Facade Market Revenue (Million) Forecast, by Application 2019 & 2032
- Table 48: Rest of Middle East & Africa US Facade Market Revenue (Million) Forecast, by Application 2019 & 2032
- Table 49: Global US Facade Market Revenue Million Forecast, by Type 2019 & 2032
- Table 50: Global US Facade Market Revenue Million Forecast, by Material 2019 & 2032
- Table 51: Global US Facade Market Revenue Million Forecast, by End Users 2019 & 2032
- Table 52: Global US Facade Market Revenue Million Forecast, by Country 2019 & 2032
- Table 53: China US Facade Market Revenue (Million) Forecast, by Application 2019 & 2032
- Table 54: India US Facade Market Revenue (Million) Forecast, by Application 2019 & 2032
- Table 55: Japan US Facade Market Revenue (Million) Forecast, by Application 2019 & 2032
- Table 56: South Korea US Facade Market Revenue (Million) Forecast, by Application 2019 & 2032
- Table 57: ASEAN US Facade Market Revenue (Million) Forecast, by Application 2019 & 2032
- Table 58: Oceania US Facade Market Revenue (Million) Forecast, by Application 2019 & 2032
- Table 59: Rest of Asia Pacific US Facade Market Revenue (Million) Forecast, by Application 2019 & 2032
Frequently Asked Questions
1. What is the projected Compound Annual Growth Rate (CAGR) of the US Facade Market?
The projected CAGR is approximately > 4.40%.
2. Which companies are prominent players in the US Facade Market?
Key companies in the market include Seele, USG Corporation, Permasteelisa S p A, Reynaers Group, Kingspan Group, Louisiana Pacific Corporation, Guardian Industries, New Hudson Facades, Georgia-Pacific L L C, Sky Facade Inc, Elemex® Inc **List Not Exhaustive, Alphacladding, GAMCO CORPORATION.
3. What are the main segments of the US Facade Market?
The market segments include Type, Material, End Users.
4. Can you provide details about the market size?
The market size is estimated to be USD XX Million as of 2022.
5. What are some drivers contributing to market growth?
Rising Commercial Property Development; Rapid Digitalization of Commercial Construction.
6. What are the notable trends driving market growth?
Glass Facades are Witnessing a Rise in Adoption.
7. Are there any restraints impacting market growth?
Emerging Safety and Labour Issues; Rise in Cost of Construction.
8. Can you provide examples of recent developments in the market?
November 2022: The newly renovated SmartSide® facility in Houlton, Maine, will get a second line, according to plans revealed by LP Building Solutions (LP). Following ramp-up, the second line will generate 340 million square feet annually and create more than 100 new jobs in the neighborhood.
9. What pricing options are available for accessing the report?
Pricing options include single-user, multi-user, and enterprise licenses priced at USD 3800, USD 4500, and USD 5800 respectively.
10. Is the market size provided in terms of value or volume?
The market size is provided in terms of value, measured in Million.
11. Are there any specific market keywords associated with the report?
Yes, the market keyword associated with the report is "US Facade Market," which aids in identifying and referencing the specific market segment covered.
12. How do I determine which pricing option suits my needs best?
The pricing options vary based on user requirements and access needs. Individual users may opt for single-user licenses, while businesses requiring broader access may choose multi-user or enterprise licenses for cost-effective access to the report.
13. Are there any additional resources or data provided in the US Facade Market report?
While the report offers comprehensive insights, it's advisable to review the specific contents or supplementary materials provided to ascertain if additional resources or data are available.
14. How can I stay updated on further developments or reports in the US Facade Market?
To stay informed about further developments, trends, and reports in the US Facade Market, consider subscribing to industry newsletters, following relevant companies and organizations, or regularly checking reputable industry news sources and publications.
Methodology
Step 1 - Identification of Relevant Samples Size from Population Database


Step 2 - Approaches for Defining Global Market Size (Value, Volume* & Price*)

Note*: In applicable scenarios
Step 3 - Data Sources
Primary Research
- Web Analytics
- Survey Reports
- Research Institute
- Latest Research Reports
- Opinion Leaders
Secondary Research
- Annual Reports
- White Paper
- Latest Press Release
- Industry Association
- Paid Database
- Investor Presentations

Step 4 - Data Triangulation
Involves using different sources of information in order to increase the validity of a study
These sources are likely to be stakeholders in a program - participants, other researchers, program staff, other community members, and so on.
Then we put all data in single framework & apply various statistical tools to find out the dynamic on the market.
During the analysis stage, feedback from the stakeholder groups would be compared to determine areas of agreement as well as areas of divergence
