

Key Insights
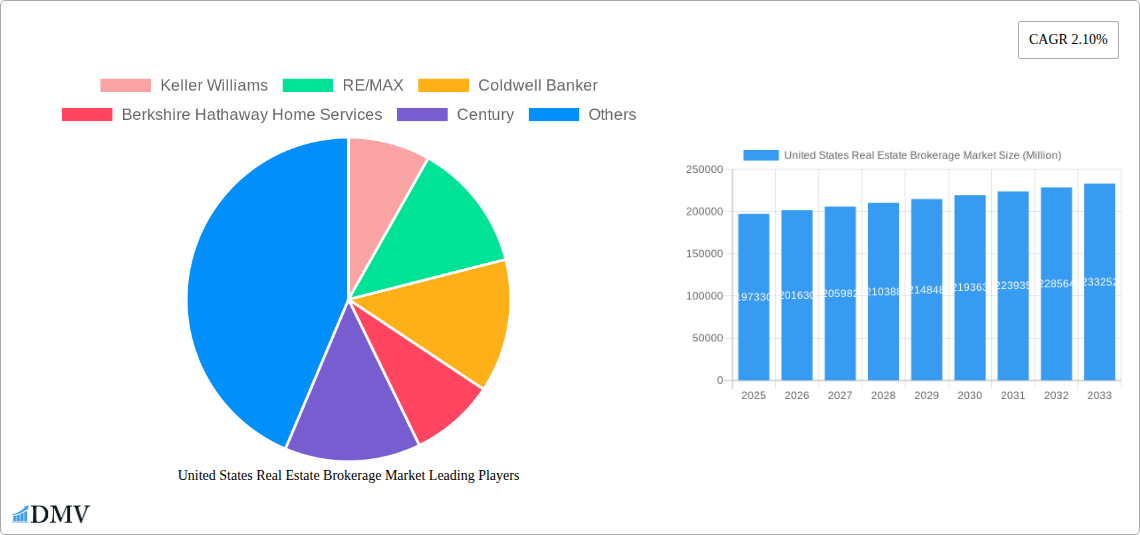
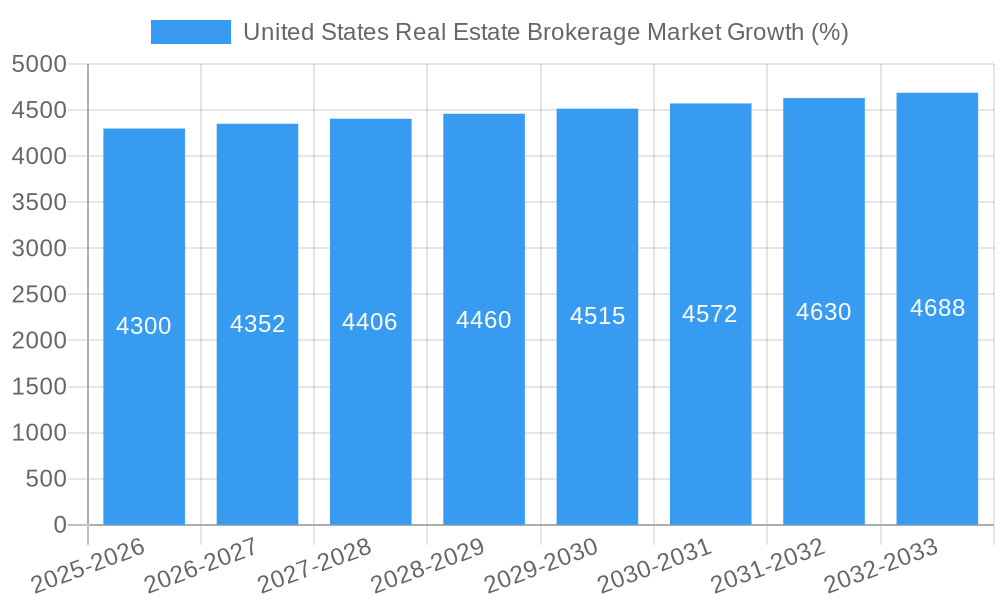
The United States real estate brokerage market, valued at $197.33 billion in 2025, exhibits a steady growth trajectory, projected to expand at a Compound Annual Growth Rate (CAGR) of 2.10% from 2025 to 2033. This sustained growth is fueled by several key drivers. A robust housing market, particularly in high-growth areas, consistently generates demand for brokerage services. Increasing technological adoption within the industry, including sophisticated online platforms and data analytics tools, enhances efficiency and expands market reach. Furthermore, the rise of iBuyers and PropTech companies, while disruptive, ultimately contribute to market expansion by creating new avenues for transactions and brokerage involvement. However, factors such as fluctuating interest rates, economic uncertainty, and increasing regulatory scrutiny pose potential restraints on market growth. The market is segmented by service type (residential, commercial, etc.), business model (full-service, discount brokerage), and geographic location. Leading players include established national and international brands like Keller Williams, RE/MAX, Coldwell Banker, and Berkshire Hathaway Home Services, along with newer entrants leveraging technology, such as Compass and eXp Realty. The competitive landscape is characterized by both fierce competition and strategic partnerships, driving innovation and market consolidation.
The projected market size for 2033 can be estimated based on the provided CAGR and 2025 value. Utilizing a CAGR calculator with a starting value of $197.33 billion and a growth rate of 2.10%, we can project a market size exceeding $230 billion by 2033. This signifies consistent, albeit moderate, expansion in the market, indicating sustained demand for real estate brokerage services. The market’s segmentation allows for nuanced analysis focusing on specific segments and their respective performance, including the impacts of technological advancements, regulatory changes, and evolving consumer preferences on revenue streams and market share for various companies. Successful companies will be those that effectively leverage technology, build strong brands, and adapt to shifting market conditions.
United States Real Estate Brokerage Market: A Comprehensive Report (2019-2033)
This insightful report provides a detailed analysis of the United States real estate brokerage market, encompassing historical performance (2019-2024), current status (2025), and future projections (2025-2033). Valued at $XX Million in 2025, the market is poised for significant growth, driven by technological advancements and evolving consumer preferences. This report is crucial for stakeholders seeking to understand market dynamics, identify key players, and capitalize on emerging opportunities within this dynamic sector.
United States Real Estate Brokerage Market Composition & Trends
The US real estate brokerage market is characterized by a moderately concentrated landscape, with key players like Keller Williams, RE/MAX, Coldwell Banker, Berkshire Hathaway Home Services, Century 21, Sotheby's International Realty, Compass, eXp Realty, Realogy Holdings Corp, and Redfin commanding significant market share. However, a substantial portion of the market remains fragmented amongst smaller, independent brokerages.
- Market Concentration: The top 10 players hold an estimated xx% of the market share in 2025, indicating a moderately concentrated yet competitive landscape.
- Innovation Catalysts: Technological advancements, including PropTech solutions and AI-powered tools, are driving efficiency and reshaping customer interactions.
- Regulatory Landscape: State-level regulations regarding licensing, disclosures, and fair housing practices significantly influence market operations.
- Substitute Products: While traditional brokerage services remain dominant, online platforms and iBuyers are emerging as viable alternatives, impacting market dynamics.
- End-User Profiles: The market caters to a diverse clientele, including first-time homebuyers, investors, luxury home buyers, and commercial property investors.
- M&A Activities: The market has witnessed a significant increase in mergers and acquisitions (M&A) activity, with deal values exceeding $XX Million in 2024 alone. Compass’s recent acquisitions illustrate this trend.
United States Real Estate Brokerage Market Industry Evolution
The US real estate brokerage market has witnessed consistent growth throughout the historical period (2019-2024), with a compound annual growth rate (CAGR) of xx%. This growth trajectory is projected to continue during the forecast period (2025-2033), albeit at a slightly moderated pace, reaching an estimated $XX Million by 2033. Several factors contribute to this evolution:
Technological advancements, such as virtual tours, online property listings, and sophisticated data analytics, have significantly enhanced the efficiency and reach of brokerage services. The increasing adoption of these technologies, measured by a xx% increase in usage between 2019 and 2024, has facilitated a more seamless and transparent customer experience. Simultaneously, shifting consumer demands toward personalized services and faster transaction processes are pushing brokerages to adapt and innovate. The rise of iBuying platforms and other PropTech solutions presents both opportunities and challenges for traditional brokerages, requiring strategic adaptation to maintain market relevance.
Leading Regions, Countries, or Segments in United States Real Estate Brokerage Market
The US real estate brokerage market displays regional variations in growth and market concentration. The Sun Belt region, encompassing states like Florida, Texas, Arizona, and California, consistently demonstrates higher transaction volumes and robust market activity.
- Key Drivers of Sun Belt Dominance:
- Strong population growth and in-migration patterns fueling housing demand.
- Favorable economic conditions and a relatively robust job market.
- Attractive lifestyle factors, including warm climates and recreational opportunities.
- Significant investment in new residential construction.
- Supportive regulatory environments conducive to real estate investment.
The dominance of this region is attributable to several interwoven factors. The sustained population growth in these states, driven by both domestic migration and international immigration, creates an inherent demand for housing. Further, the strong economic performance and job creation in these areas stimulate real estate investment, bolstering market activity. Lastly, the favorable climate and lifestyle appeal serve as compelling magnets for new residents, further bolstering housing demand.
United States Real Estate Brokerage Market Product Innovations
Recent innovations in the US real estate brokerage market include the adoption of AI-powered tools for property valuation and market analysis, virtual and augmented reality technologies for immersive property tours, and sophisticated data analytics platforms for personalized customer service. These advancements enhance efficiency, improve customer experience, and provide valuable insights for market predictions, driving competitive advantage. Unique selling propositions increasingly revolve around the use of technology to optimize the home buying and selling process.
Propelling Factors for United States Real Estate Brokerage Market Growth
Several factors contribute to the sustained growth of the US real estate brokerage market. Technological advancements, such as virtual tours and online platforms, have streamlined processes and broadened reach. Economic growth and low-interest rates historically stimulated home buying activity, driving transaction volumes. Finally, supportive government policies and regulations contribute to a stable and functioning market.
Obstacles in the United States Real Estate Brokerage Market Market
The US real estate brokerage market faces several challenges. Regulatory hurdles and compliance requirements can be complex and costly. Supply chain disruptions, particularly impacting new construction, can restrict inventory and impact prices. Finally, intense competition from both established players and new entrants in the PropTech space presents a constant pressure on margins and market share.
Future Opportunities in United States Real Estate Brokerage Market
Future opportunities lie in leveraging advanced technologies like AI and blockchain for enhanced security and efficiency. Expansion into underserved markets and focusing on niche segments, like sustainable or luxury properties, offer potential for growth. Finally, adapting to evolving consumer preferences for personalized and tech-enabled services will be crucial for success.
Major Players in the United States Real Estate Brokerage Market Ecosystem
- Keller Williams
- RE/MAX
- Coldwell Banker
- Berkshire Hathaway Home Services
- Century 21
- Sotheby's International Realty
- Compass
- eXp Realty
- Realogy Holdings Corp
- Redfin
- 63 Other Companies
Key Developments in United States Real Estate Brokerage Market Industry
- May 2024: Compass Inc. acquires Parks Real Estate, expanding its agent network and technological reach in Tennessee.
- April 2024: Compass finalizes the acquisition of Latter & Blum, strengthening its presence in Louisiana and the Gulf Coast region.
Strategic United States Real Estate Brokerage Market Market Forecast
The US real estate brokerage market is projected to experience continued growth, fueled by technological innovations, evolving consumer preferences, and economic factors. Opportunities exist in leveraging data analytics, personalized services, and strategic partnerships to capture market share and drive profitability. The focus on technology and efficient service will be crucial for success in the coming years.
United States Real Estate Brokerage Market Segmentation
-
1. Type
- 1.1. Residential
- 1.2. Non-Residential
-
2. Service
- 2.1. Sales
- 2.2. Rental
United States Real Estate Brokerage Market Segmentation By Geography
- 1. United States
United States Real Estate Brokerage Market REPORT HIGHLIGHTS
| Aspects | Details |
|---|---|
| Study Period | 2019-2033 |
| Base Year | 2024 |
| Estimated Year | 2025 |
| Forecast Period | 2025-2033 |
| Historical Period | 2019-2024 |
| Growth Rate | CAGR of 2.10% from 2019-2033 |
| Segmentation |
|
Table of Contents
- 1. Introduction
- 1.1. Research Scope
- 1.2. Market Segmentation
- 1.3. Research Methodology
- 1.4. Definitions and Assumptions
- 2. Executive Summary
- 2.1. Introduction
- 3. Market Dynamics
- 3.1. Introduction
- 3.2. Market Drivers
- 3.2.1. 4.; Increasing Urbanization Driving the Market4.; Regulatory Environment Driving the market
- 3.3. Market Restrains
- 3.3.1. 4.; Increasing Urbanization Driving the Market4.; Regulatory Environment Driving the market
- 3.4. Market Trends
- 3.4.1 Industrial Sector Leads Real Estate Absorption
- 3.4.2 Retail Tightens Vacancy Rates
- 4. Market Factor Analysis
- 4.1. Porters Five Forces
- 4.2. Supply/Value Chain
- 4.3. PESTEL analysis
- 4.4. Market Entropy
- 4.5. Patent/Trademark Analysis
- 5. United States Real Estate Brokerage Market Analysis, Insights and Forecast, 2019-2031
- 5.1. Market Analysis, Insights and Forecast - by Type
- 5.1.1. Residential
- 5.1.2. Non-Residential
- 5.2. Market Analysis, Insights and Forecast - by Service
- 5.2.1. Sales
- 5.2.2. Rental
- 5.3. Market Analysis, Insights and Forecast - by Region
- 5.3.1. United States
- 5.1. Market Analysis, Insights and Forecast - by Type
- 6. Competitive Analysis
- 6.1. Market Share Analysis 2024
- 6.2. Company Profiles
- 6.2.1 Keller Williams
- 6.2.1.1. Overview
- 6.2.1.2. Products
- 6.2.1.3. SWOT Analysis
- 6.2.1.4. Recent Developments
- 6.2.1.5. Financials (Based on Availability)
- 6.2.2 RE/MAX
- 6.2.2.1. Overview
- 6.2.2.2. Products
- 6.2.2.3. SWOT Analysis
- 6.2.2.4. Recent Developments
- 6.2.2.5. Financials (Based on Availability)
- 6.2.3 Coldwell Banker
- 6.2.3.1. Overview
- 6.2.3.2. Products
- 6.2.3.3. SWOT Analysis
- 6.2.3.4. Recent Developments
- 6.2.3.5. Financials (Based on Availability)
- 6.2.4 Berkshire Hathaway Home Services
- 6.2.4.1. Overview
- 6.2.4.2. Products
- 6.2.4.3. SWOT Analysis
- 6.2.4.4. Recent Developments
- 6.2.4.5. Financials (Based on Availability)
- 6.2.5 Century
- 6.2.5.1. Overview
- 6.2.5.2. Products
- 6.2.5.3. SWOT Analysis
- 6.2.5.4. Recent Developments
- 6.2.5.5. Financials (Based on Availability)
- 6.2.6 Sotheby's International Realty
- 6.2.6.1. Overview
- 6.2.6.2. Products
- 6.2.6.3. SWOT Analysis
- 6.2.6.4. Recent Developments
- 6.2.6.5. Financials (Based on Availability)
- 6.2.7 Compass
- 6.2.7.1. Overview
- 6.2.7.2. Products
- 6.2.7.3. SWOT Analysis
- 6.2.7.4. Recent Developments
- 6.2.7.5. Financials (Based on Availability)
- 6.2.8 eXp Realty
- 6.2.8.1. Overview
- 6.2.8.2. Products
- 6.2.8.3. SWOT Analysis
- 6.2.8.4. Recent Developments
- 6.2.8.5. Financials (Based on Availability)
- 6.2.9 Realogy Holdings Corp
- 6.2.9.1. Overview
- 6.2.9.2. Products
- 6.2.9.3. SWOT Analysis
- 6.2.9.4. Recent Developments
- 6.2.9.5. Financials (Based on Availability)
- 6.2.10 Redfin**List Not Exhaustive 6 3 Other Companie
- 6.2.10.1. Overview
- 6.2.10.2. Products
- 6.2.10.3. SWOT Analysis
- 6.2.10.4. Recent Developments
- 6.2.10.5. Financials (Based on Availability)
- 6.2.1 Keller Williams
List of Figures
- Figure 1: United States Real Estate Brokerage Market Revenue Breakdown (Million, %) by Product 2024 & 2032
- Figure 2: United States Real Estate Brokerage Market Share (%) by Company 2024
List of Tables
- Table 1: United States Real Estate Brokerage Market Revenue Million Forecast, by Region 2019 & 2032
- Table 2: United States Real Estate Brokerage Market Volume Billion Forecast, by Region 2019 & 2032
- Table 3: United States Real Estate Brokerage Market Revenue Million Forecast, by Type 2019 & 2032
- Table 4: United States Real Estate Brokerage Market Volume Billion Forecast, by Type 2019 & 2032
- Table 5: United States Real Estate Brokerage Market Revenue Million Forecast, by Service 2019 & 2032
- Table 6: United States Real Estate Brokerage Market Volume Billion Forecast, by Service 2019 & 2032
- Table 7: United States Real Estate Brokerage Market Revenue Million Forecast, by Region 2019 & 2032
- Table 8: United States Real Estate Brokerage Market Volume Billion Forecast, by Region 2019 & 2032
- Table 9: United States Real Estate Brokerage Market Revenue Million Forecast, by Type 2019 & 2032
- Table 10: United States Real Estate Brokerage Market Volume Billion Forecast, by Type 2019 & 2032
- Table 11: United States Real Estate Brokerage Market Revenue Million Forecast, by Service 2019 & 2032
- Table 12: United States Real Estate Brokerage Market Volume Billion Forecast, by Service 2019 & 2032
- Table 13: United States Real Estate Brokerage Market Revenue Million Forecast, by Country 2019 & 2032
- Table 14: United States Real Estate Brokerage Market Volume Billion Forecast, by Country 2019 & 2032
Frequently Asked Questions
1. What is the projected Compound Annual Growth Rate (CAGR) of the United States Real Estate Brokerage Market?
The projected CAGR is approximately 2.10%.
2. Which companies are prominent players in the United States Real Estate Brokerage Market?
Key companies in the market include Keller Williams, RE/MAX, Coldwell Banker, Berkshire Hathaway Home Services, Century, Sotheby's International Realty, Compass, eXp Realty, Realogy Holdings Corp, Redfin**List Not Exhaustive 6 3 Other Companie.
3. What are the main segments of the United States Real Estate Brokerage Market?
The market segments include Type, Service.
4. Can you provide details about the market size?
The market size is estimated to be USD 197.33 Million as of 2022.
5. What are some drivers contributing to market growth?
4.; Increasing Urbanization Driving the Market4.; Regulatory Environment Driving the market.
6. What are the notable trends driving market growth?
Industrial Sector Leads Real Estate Absorption. Retail Tightens Vacancy Rates.
7. Are there any restraints impacting market growth?
4.; Increasing Urbanization Driving the Market4.; Regulatory Environment Driving the market.
8. Can you provide examples of recent developments in the market?
May 2024: Compass Inc., the leading residential real estate brokerage by sales volume in the United States, acquired Parks Real Estate, Tennessee's top residential real estate firm that boasts over 1,500 agents. Known for its strategic acquisitions and organic growth, Compass's collaboration with Parks Real Estate not only enriches its agent pool but also grants these agents access to Compass's cutting-edge technology and a vast national referral network.
9. What pricing options are available for accessing the report?
Pricing options include single-user, multi-user, and enterprise licenses priced at USD 3800, USD 4500, and USD 5800 respectively.
10. Is the market size provided in terms of value or volume?
The market size is provided in terms of value, measured in Million and volume, measured in Billion.
11. Are there any specific market keywords associated with the report?
Yes, the market keyword associated with the report is "United States Real Estate Brokerage Market," which aids in identifying and referencing the specific market segment covered.
12. How do I determine which pricing option suits my needs best?
The pricing options vary based on user requirements and access needs. Individual users may opt for single-user licenses, while businesses requiring broader access may choose multi-user or enterprise licenses for cost-effective access to the report.
13. Are there any additional resources or data provided in the United States Real Estate Brokerage Market report?
While the report offers comprehensive insights, it's advisable to review the specific contents or supplementary materials provided to ascertain if additional resources or data are available.
14. How can I stay updated on further developments or reports in the United States Real Estate Brokerage Market?
To stay informed about further developments, trends, and reports in the United States Real Estate Brokerage Market, consider subscribing to industry newsletters, following relevant companies and organizations, or regularly checking reputable industry news sources and publications.
Methodology
Step 1 - Identification of Relevant Samples Size from Population Database


Step 2 - Approaches for Defining Global Market Size (Value, Volume* & Price*)

Note*: In applicable scenarios
Step 3 - Data Sources
Primary Research
- Web Analytics
- Survey Reports
- Research Institute
- Latest Research Reports
- Opinion Leaders
Secondary Research
- Annual Reports
- White Paper
- Latest Press Release
- Industry Association
- Paid Database
- Investor Presentations

Step 4 - Data Triangulation
Involves using different sources of information in order to increase the validity of a study
These sources are likely to be stakeholders in a program - participants, other researchers, program staff, other community members, and so on.
Then we put all data in single framework & apply various statistical tools to find out the dynamic on the market.
During the analysis stage, feedback from the stakeholder groups would be compared to determine areas of agreement as well as areas of divergence
