

Key Insights
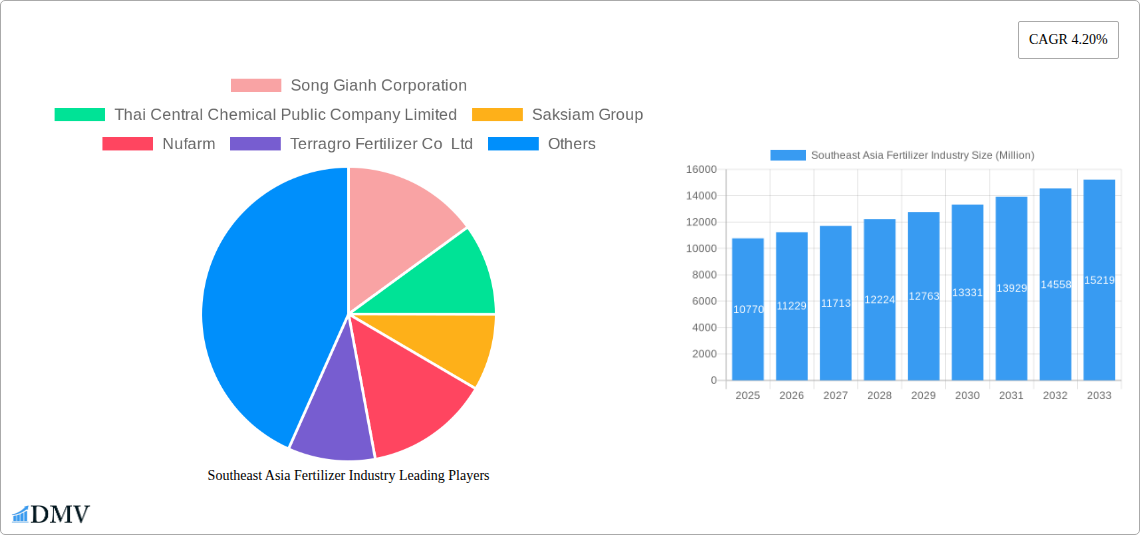
The Southeast Asia fertilizer market, valued at $10.77 billion in 2025, is projected to experience robust growth, driven by a rising population, increasing demand for food, and the expansion of agricultural activities across the region. The compound annual growth rate (CAGR) of 4.20% from 2025 to 2033 indicates a steady expansion, with the market expected to surpass $16 billion by 2033. Key drivers include government initiatives promoting agricultural modernization, growing adoption of high-yielding crop varieties requiring enhanced fertilization, and increasing investments in agricultural infrastructure. While challenges exist, such as price volatility of raw materials and environmental concerns related to fertilizer use, the overall market outlook remains positive. The market segmentation reveals significant demand across various crops, with grains and cereals, oilseeds and pulses, and fruits and vegetables representing major application areas. Nitrogenous fertilizers dominate the market by type, reflecting the high nitrogen requirements of many staple crops. Leading companies like Yara International ASA, Nufarm, and several prominent Southeast Asian players are actively competing to meet the growing demand, further fueling market expansion.
The Asia-Pacific region, particularly countries like China, India, and others within Southeast Asia, plays a crucial role in the global fertilizer market. This strong regional performance is attributed to factors including intensive agricultural practices, favorable government policies supporting agricultural production, and a growing middle class increasing food consumption. The market is witnessing a shift towards balanced fertilization practices and the adoption of advanced technologies like precision farming. This transition is being driven by a greater awareness of environmental sustainability and the need for efficient nutrient management. Companies are responding by developing innovative fertilizer products, including those with slow-release formulations and enhanced nutrient use efficiency to reduce environmental impact while maximizing crop yields. The forecast period anticipates continued growth fuelled by a combination of factors including improved agricultural techniques, increasing crop yields and the overall growth of the region's economy.
Southeast Asia Fertilizer Industry: Market Analysis & Forecast 2019-2033
This comprehensive report delivers an in-depth analysis of the Southeast Asia fertilizer industry, providing invaluable insights for stakeholders seeking to navigate this dynamic market. With a focus on market trends, leading players, and future opportunities, this study offers a crucial resource for strategic decision-making. The report covers the period from 2019 to 2033, with a base year of 2025 and a forecast period spanning 2025-2033. The total market value is estimated at xx Million for 2025.
Southeast Asia Fertilizer Industry Market Composition & Trends
This section evaluates the competitive landscape, examining market concentration, innovation drivers, regulatory frameworks, substitute product impacts, end-user behavior, and merger & acquisition (M&A) activities within the Southeast Asia fertilizer market. We analyze market share distribution among key players, including Song Gianh Corporation, Thai Central Chemical Public Company Limited, Saksiam Group, Nufarm, Terragro Fertilizer Co Ltd, Yara International ASA, Farmcochem Group, Ninh Binh Phosphate Fertilizer JSC, PK Fertilizers, Southern Fertilizer JSC, and others. The report details M&A deal values and their influence on market dynamics, providing a comprehensive overview of the industry's competitive structure. Market share distribution in 2025 is estimated as follows:
- Top 3 Players: Holding approximately 40% of the market share.
- Mid-sized Players: Holding approximately 35% of the market share.
- Smaller Players: Holding approximately 25% of the market share.
The total value of M&A deals in the historical period (2019-2024) is estimated at xx Million, with an anticipated xx Million in the forecast period (2025-2033). Innovation is driven by increasing demand for high-efficiency fertilizers and sustainable agricultural practices. Regulatory changes impacting fertilizer usage and environmental protection are also thoroughly examined.
Southeast Asia Fertilizer Industry Industry Evolution
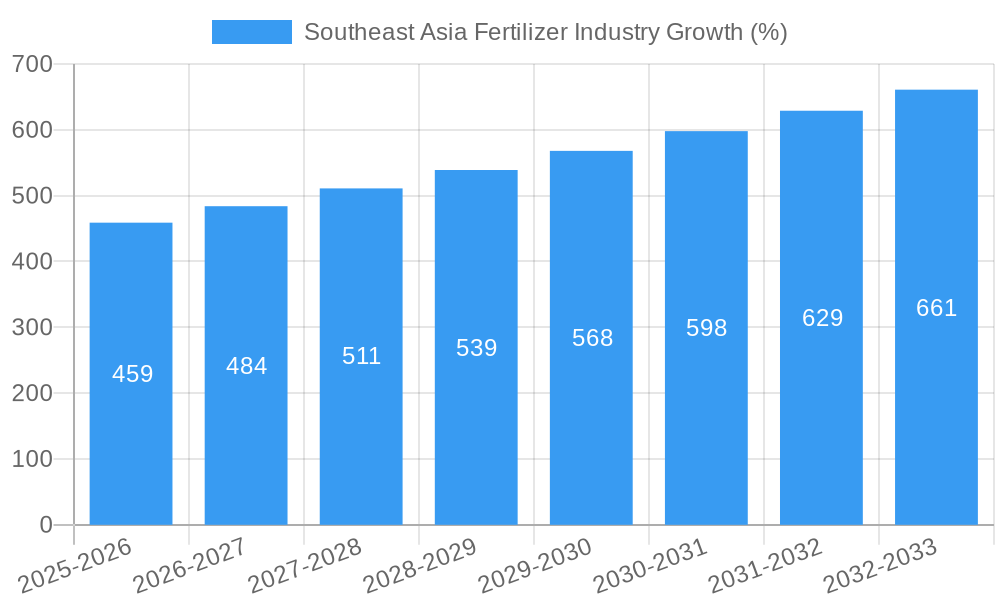
This section analyzes the Southeast Asia fertilizer industry's growth trajectory from 2019 to 2033, examining technological advancements and evolving consumer preferences. The report details historical growth rates and projects future expansion based on several factors. We explore the adoption rates of new fertilizer technologies, including the increasing use of precision farming techniques and the growing demand for organic and bio-fertilizers. The market exhibited a Compound Annual Growth Rate (CAGR) of xx% during the historical period (2019-2024) and is projected to grow at a CAGR of xx% during the forecast period (2025-2033), reaching an estimated value of xx Million by 2033. This growth is fueled by factors including rising agricultural production, increasing population, and government initiatives promoting agricultural development. The shift towards sustainable agriculture practices is also impacting consumer demand, leading to greater adoption of environmentally friendly fertilizers.
Leading Regions, Countries, or Segments in Southeast Asia Fertilizer Industry
This section identifies the leading regions, countries, and segments within the Southeast Asia fertilizer market. Analysis considers both application (Grains and Cereals, Oilseeds and Pulses, Commercial Crops, Fruits and Vegetables, Other Crop Types) and fertilizer type (Nitrogenous Fertilizers, Phosphatic Fertilizers, Potash Fertilizers, Secondary Nutrient Fertilizers, Micronutrients).
Key Drivers:
- Investment Trends: Significant investments in agricultural infrastructure and technology are driving growth in specific regions.
- Regulatory Support: Government policies and subsidies supporting fertilizer usage and agricultural development are influencing market dynamics.
Dominance Factors: Indonesia and Vietnam are identified as leading countries due to their significant agricultural output and government support for the agricultural sector. The Grains and Cereals segment dominates by application, driven by high demand from the rice and corn industries. Nitrogenous fertilizers represent the largest segment by type.
Southeast Asia Fertilizer Industry Product Innovations
Recent innovations include the development of slow-release fertilizers, biofertilizers, and nanofertilizers, offering enhanced nutrient delivery and reduced environmental impact. These innovations aim to improve crop yields while minimizing negative environmental consequences. Specific examples of unique selling propositions include extended nutrient availability, improved crop uptake efficiency, and reduced fertilizer runoff.
Propelling Factors for Southeast Asia Fertilizer Industry Growth
Growth is primarily driven by rising agricultural production, increasing food demand fueled by population growth, and government support for agricultural modernization and development. Technological advancements in fertilizer production and application techniques contribute significantly to increased efficiency and yield. Favorable government policies, including subsidies and tax incentives for fertilizer usage, further stimulate market expansion.
Obstacles in the Southeast Asia Fertilizer Market
The industry faces challenges from fluctuating raw material prices, supply chain disruptions, and intense competition. Stringent environmental regulations and concerns regarding fertilizer's environmental impact also pose significant constraints. These factors can lead to price volatility and affect the profitability of fertilizer producers and distributors.
Future Opportunities in Southeast Asia Fertilizer Industry
Emerging opportunities include expanding into new markets with high agricultural potential, adopting precision farming technologies for efficient fertilizer application, and developing innovative fertilizer products tailored to specific crop needs and environmental conditions. Furthermore, growing awareness of sustainable agriculture practices creates a demand for eco-friendly fertilizers, presenting a significant growth area for environmentally conscious producers.
Major Players in the Southeast Asia Fertilizer Industry Ecosystem
- Song Gianh Corporation
- Thai Central Chemical Public Company Limited
- Saksiam Group
- Nufarm
- Terragro Fertilizer Co Ltd
- Yara International ASA
- Farmcochem Group
- Ninh Binh Phosphate Fertilizer JSC
- PK Fertilizers
- Southern Fertilizer JSC
Key Developments in Southeast Asia Fertilizer Industry Industry
- 2022 Q3: Nufarm launched a new line of slow-release fertilizers.
- 2023 Q1: A major merger between two fertilizer companies resulted in increased market consolidation. (Specific details will be included in the full report)
- 2024 Q4: New environmental regulations were implemented, impacting fertilizer production and distribution. (Specific details will be included in the full report)
Strategic Southeast Asia Fertilizer Industry Market Forecast
The Southeast Asia fertilizer market is poised for robust growth, driven by rising agricultural output and increasing demand for food security. Continued technological advancements, coupled with supportive government policies, will play a key role in shaping the industry's future. The focus on sustainable agriculture practices presents significant opportunities for environmentally friendly fertilizer solutions. The market's overall growth trajectory remains positive, promising considerable potential for investors and industry participants.
Southeast Asia Fertilizer Industry Segmentation
- 1. Production Analysis
- 2. Consumption Analysis
- 3. Import Market Analysis (Value & Volume)
- 4. Export Market Analysis (Value & Volume)
- 5. Price Trend Analysis
Southeast Asia Fertilizer Industry Segmentation By Geography
-
1. North America
- 1.1. United States
- 1.2. Canada
- 1.3. Mexico
-
2. South America
- 2.1. Brazil
- 2.2. Argentina
- 2.3. Rest of South America
-
3. Europe
- 3.1. United Kingdom
- 3.2. Germany
- 3.3. France
- 3.4. Italy
- 3.5. Spain
- 3.6. Russia
- 3.7. Benelux
- 3.8. Nordics
- 3.9. Rest of Europe
-
4. Middle East & Africa
- 4.1. Turkey
- 4.2. Israel
- 4.3. GCC
- 4.4. North Africa
- 4.5. South Africa
- 4.6. Rest of Middle East & Africa
-
5. Asia Pacific
- 5.1. China
- 5.2. India
- 5.3. Japan
- 5.4. South Korea
- 5.5. ASEAN
- 5.6. Oceania
- 5.7. Rest of Asia Pacific

Southeast Asia Fertilizer Industry REPORT HIGHLIGHTS
| Aspects | Details |
|---|---|
| Study Period | 2019-2033 |
| Base Year | 2024 |
| Estimated Year | 2025 |
| Forecast Period | 2025-2033 |
| Historical Period | 2019-2024 |
| Growth Rate | CAGR of 4.20% from 2019-2033 |
| Segmentation |
|
Table of Contents
- 1. Introduction
- 1.1. Research Scope
- 1.2. Market Segmentation
- 1.3. Research Methodology
- 1.4. Definitions and Assumptions
- 2. Executive Summary
- 2.1. Introduction
- 3. Market Dynamics
- 3.1. Introduction
- 3.2. Market Drivers
- 3.2.1. Demand For Higher Crop Yields; Application of Chelates in Micronutrient Intoxication; Micronutrient Deficiency In Soil
- 3.3. Market Restrains
- 3.3.1. Non-biodegradable Nature of Chelates; Rise of Organic Farming and Restriction on the Use of Synthetic Chelating Agents
- 3.4. Market Trends
- 3.4.1. Need for Improving Productivity Amid Growing Demand for Food Crops
- 4. Market Factor Analysis
- 4.1. Porters Five Forces
- 4.2. Supply/Value Chain
- 4.3. PESTEL analysis
- 4.4. Market Entropy
- 4.5. Patent/Trademark Analysis
- 5. Global Southeast Asia Fertilizer Industry Analysis, Insights and Forecast, 2019-2031
- 5.1. Market Analysis, Insights and Forecast - by Production Analysis
- 5.2. Market Analysis, Insights and Forecast - by Consumption Analysis
- 5.3. Market Analysis, Insights and Forecast - by Import Market Analysis (Value & Volume)
- 5.4. Market Analysis, Insights and Forecast - by Export Market Analysis (Value & Volume)
- 5.5. Market Analysis, Insights and Forecast - by Price Trend Analysis
- 5.6. Market Analysis, Insights and Forecast - by Region
- 5.6.1. North America
- 5.6.2. South America
- 5.6.3. Europe
- 5.6.4. Middle East & Africa
- 5.6.5. Asia Pacific
- 5.1. Market Analysis, Insights and Forecast - by Production Analysis
- 6. North America Southeast Asia Fertilizer Industry Analysis, Insights and Forecast, 2019-2031
- 6.1. Market Analysis, Insights and Forecast - by Production Analysis
- 6.2. Market Analysis, Insights and Forecast - by Consumption Analysis
- 6.3. Market Analysis, Insights and Forecast - by Import Market Analysis (Value & Volume)
- 6.4. Market Analysis, Insights and Forecast - by Export Market Analysis (Value & Volume)
- 6.5. Market Analysis, Insights and Forecast - by Price Trend Analysis
- 6.1. Market Analysis, Insights and Forecast - by Production Analysis
- 7. South America Southeast Asia Fertilizer Industry Analysis, Insights and Forecast, 2019-2031
- 7.1. Market Analysis, Insights and Forecast - by Production Analysis
- 7.2. Market Analysis, Insights and Forecast - by Consumption Analysis
- 7.3. Market Analysis, Insights and Forecast - by Import Market Analysis (Value & Volume)
- 7.4. Market Analysis, Insights and Forecast - by Export Market Analysis (Value & Volume)
- 7.5. Market Analysis, Insights and Forecast - by Price Trend Analysis
- 7.1. Market Analysis, Insights and Forecast - by Production Analysis
- 8. Europe Southeast Asia Fertilizer Industry Analysis, Insights and Forecast, 2019-2031
- 8.1. Market Analysis, Insights and Forecast - by Production Analysis
- 8.2. Market Analysis, Insights and Forecast - by Consumption Analysis
- 8.3. Market Analysis, Insights and Forecast - by Import Market Analysis (Value & Volume)
- 8.4. Market Analysis, Insights and Forecast - by Export Market Analysis (Value & Volume)
- 8.5. Market Analysis, Insights and Forecast - by Price Trend Analysis
- 8.1. Market Analysis, Insights and Forecast - by Production Analysis
- 9. Middle East & Africa Southeast Asia Fertilizer Industry Analysis, Insights and Forecast, 2019-2031
- 9.1. Market Analysis, Insights and Forecast - by Production Analysis
- 9.2. Market Analysis, Insights and Forecast - by Consumption Analysis
- 9.3. Market Analysis, Insights and Forecast - by Import Market Analysis (Value & Volume)
- 9.4. Market Analysis, Insights and Forecast - by Export Market Analysis (Value & Volume)
- 9.5. Market Analysis, Insights and Forecast - by Price Trend Analysis
- 9.1. Market Analysis, Insights and Forecast - by Production Analysis
- 10. Asia Pacific Southeast Asia Fertilizer Industry Analysis, Insights and Forecast, 2019-2031
- 10.1. Market Analysis, Insights and Forecast - by Production Analysis
- 10.2. Market Analysis, Insights and Forecast - by Consumption Analysis
- 10.3. Market Analysis, Insights and Forecast - by Import Market Analysis (Value & Volume)
- 10.4. Market Analysis, Insights and Forecast - by Export Market Analysis (Value & Volume)
- 10.5. Market Analysis, Insights and Forecast - by Price Trend Analysis
- 10.1. Market Analysis, Insights and Forecast - by Production Analysis
- 11. China Southeast Asia Fertilizer Industry Analysis, Insights and Forecast, 2019-2031
- 12. Japan Southeast Asia Fertilizer Industry Analysis, Insights and Forecast, 2019-2031
- 13. India Southeast Asia Fertilizer Industry Analysis, Insights and Forecast, 2019-2031
- 14. South Korea Southeast Asia Fertilizer Industry Analysis, Insights and Forecast, 2019-2031
- 15. Taiwan Southeast Asia Fertilizer Industry Analysis, Insights and Forecast, 2019-2031
- 16. Australia Southeast Asia Fertilizer Industry Analysis, Insights and Forecast, 2019-2031
- 17. Rest of Asia-Pacific Southeast Asia Fertilizer Industry Analysis, Insights and Forecast, 2019-2031
- 18. Competitive Analysis
- 18.1. Global Market Share Analysis 2024
- 18.2. Company Profiles
- 18.2.1 Song Gianh Corporation
- 18.2.1.1. Overview
- 18.2.1.2. Products
- 18.2.1.3. SWOT Analysis
- 18.2.1.4. Recent Developments
- 18.2.1.5. Financials (Based on Availability)
- 18.2.2 Thai Central Chemical Public Company Limited
- 18.2.2.1. Overview
- 18.2.2.2. Products
- 18.2.2.3. SWOT Analysis
- 18.2.2.4. Recent Developments
- 18.2.2.5. Financials (Based on Availability)
- 18.2.3 Saksiam Group
- 18.2.3.1. Overview
- 18.2.3.2. Products
- 18.2.3.3. SWOT Analysis
- 18.2.3.4. Recent Developments
- 18.2.3.5. Financials (Based on Availability)
- 18.2.4 Nufarm
- 18.2.4.1. Overview
- 18.2.4.2. Products
- 18.2.4.3. SWOT Analysis
- 18.2.4.4. Recent Developments
- 18.2.4.5. Financials (Based on Availability)
- 18.2.5 Terragro Fertilizer Co Ltd
- 18.2.5.1. Overview
- 18.2.5.2. Products
- 18.2.5.3. SWOT Analysis
- 18.2.5.4. Recent Developments
- 18.2.5.5. Financials (Based on Availability)
- 18.2.6 Yara International ASA
- 18.2.6.1. Overview
- 18.2.6.2. Products
- 18.2.6.3. SWOT Analysis
- 18.2.6.4. Recent Developments
- 18.2.6.5. Financials (Based on Availability)
- 18.2.7 Farmcochem Group
- 18.2.7.1. Overview
- 18.2.7.2. Products
- 18.2.7.3. SWOT Analysis
- 18.2.7.4. Recent Developments
- 18.2.7.5. Financials (Based on Availability)
- 18.2.8 Ninh Binh Phosphate Fertilizer JSC
- 18.2.8.1. Overview
- 18.2.8.2. Products
- 18.2.8.3. SWOT Analysis
- 18.2.8.4. Recent Developments
- 18.2.8.5. Financials (Based on Availability)
- 18.2.9 PK Fertilizers*List Not Exhaustive
- 18.2.9.1. Overview
- 18.2.9.2. Products
- 18.2.9.3. SWOT Analysis
- 18.2.9.4. Recent Developments
- 18.2.9.5. Financials (Based on Availability)
- 18.2.10 Southern Fertilizer JSC
- 18.2.10.1. Overview
- 18.2.10.2. Products
- 18.2.10.3. SWOT Analysis
- 18.2.10.4. Recent Developments
- 18.2.10.5. Financials (Based on Availability)
- 18.2.1 Song Gianh Corporation
List of Figures
- Figure 1: Global Southeast Asia Fertilizer Industry Revenue Breakdown (Million, %) by Region 2024 & 2032
- Figure 2: Asia Pacific Southeast Asia Fertilizer Industry Revenue (Million), by Country 2024 & 2032
- Figure 3: Asia Pacific Southeast Asia Fertilizer Industry Revenue Share (%), by Country 2024 & 2032
- Figure 4: North America Southeast Asia Fertilizer Industry Revenue (Million), by Production Analysis 2024 & 2032
- Figure 5: North America Southeast Asia Fertilizer Industry Revenue Share (%), by Production Analysis 2024 & 2032
- Figure 6: North America Southeast Asia Fertilizer Industry Revenue (Million), by Consumption Analysis 2024 & 2032
- Figure 7: North America Southeast Asia Fertilizer Industry Revenue Share (%), by Consumption Analysis 2024 & 2032
- Figure 8: North America Southeast Asia Fertilizer Industry Revenue (Million), by Import Market Analysis (Value & Volume) 2024 & 2032
- Figure 9: North America Southeast Asia Fertilizer Industry Revenue Share (%), by Import Market Analysis (Value & Volume) 2024 & 2032
- Figure 10: North America Southeast Asia Fertilizer Industry Revenue (Million), by Export Market Analysis (Value & Volume) 2024 & 2032
- Figure 11: North America Southeast Asia Fertilizer Industry Revenue Share (%), by Export Market Analysis (Value & Volume) 2024 & 2032
- Figure 12: North America Southeast Asia Fertilizer Industry Revenue (Million), by Price Trend Analysis 2024 & 2032
- Figure 13: North America Southeast Asia Fertilizer Industry Revenue Share (%), by Price Trend Analysis 2024 & 2032
- Figure 14: North America Southeast Asia Fertilizer Industry Revenue (Million), by Country 2024 & 2032
- Figure 15: North America Southeast Asia Fertilizer Industry Revenue Share (%), by Country 2024 & 2032
- Figure 16: South America Southeast Asia Fertilizer Industry Revenue (Million), by Production Analysis 2024 & 2032
- Figure 17: South America Southeast Asia Fertilizer Industry Revenue Share (%), by Production Analysis 2024 & 2032
- Figure 18: South America Southeast Asia Fertilizer Industry Revenue (Million), by Consumption Analysis 2024 & 2032
- Figure 19: South America Southeast Asia Fertilizer Industry Revenue Share (%), by Consumption Analysis 2024 & 2032
- Figure 20: South America Southeast Asia Fertilizer Industry Revenue (Million), by Import Market Analysis (Value & Volume) 2024 & 2032
- Figure 21: South America Southeast Asia Fertilizer Industry Revenue Share (%), by Import Market Analysis (Value & Volume) 2024 & 2032
- Figure 22: South America Southeast Asia Fertilizer Industry Revenue (Million), by Export Market Analysis (Value & Volume) 2024 & 2032
- Figure 23: South America Southeast Asia Fertilizer Industry Revenue Share (%), by Export Market Analysis (Value & Volume) 2024 & 2032
- Figure 24: South America Southeast Asia Fertilizer Industry Revenue (Million), by Price Trend Analysis 2024 & 2032
- Figure 25: South America Southeast Asia Fertilizer Industry Revenue Share (%), by Price Trend Analysis 2024 & 2032
- Figure 26: South America Southeast Asia Fertilizer Industry Revenue (Million), by Country 2024 & 2032
- Figure 27: South America Southeast Asia Fertilizer Industry Revenue Share (%), by Country 2024 & 2032
- Figure 28: Europe Southeast Asia Fertilizer Industry Revenue (Million), by Production Analysis 2024 & 2032
- Figure 29: Europe Southeast Asia Fertilizer Industry Revenue Share (%), by Production Analysis 2024 & 2032
- Figure 30: Europe Southeast Asia Fertilizer Industry Revenue (Million), by Consumption Analysis 2024 & 2032
- Figure 31: Europe Southeast Asia Fertilizer Industry Revenue Share (%), by Consumption Analysis 2024 & 2032
- Figure 32: Europe Southeast Asia Fertilizer Industry Revenue (Million), by Import Market Analysis (Value & Volume) 2024 & 2032
- Figure 33: Europe Southeast Asia Fertilizer Industry Revenue Share (%), by Import Market Analysis (Value & Volume) 2024 & 2032
- Figure 34: Europe Southeast Asia Fertilizer Industry Revenue (Million), by Export Market Analysis (Value & Volume) 2024 & 2032
- Figure 35: Europe Southeast Asia Fertilizer Industry Revenue Share (%), by Export Market Analysis (Value & Volume) 2024 & 2032
- Figure 36: Europe Southeast Asia Fertilizer Industry Revenue (Million), by Price Trend Analysis 2024 & 2032
- Figure 37: Europe Southeast Asia Fertilizer Industry Revenue Share (%), by Price Trend Analysis 2024 & 2032
- Figure 38: Europe Southeast Asia Fertilizer Industry Revenue (Million), by Country 2024 & 2032
- Figure 39: Europe Southeast Asia Fertilizer Industry Revenue Share (%), by Country 2024 & 2032
- Figure 40: Middle East & Africa Southeast Asia Fertilizer Industry Revenue (Million), by Production Analysis 2024 & 2032
- Figure 41: Middle East & Africa Southeast Asia Fertilizer Industry Revenue Share (%), by Production Analysis 2024 & 2032
- Figure 42: Middle East & Africa Southeast Asia Fertilizer Industry Revenue (Million), by Consumption Analysis 2024 & 2032
- Figure 43: Middle East & Africa Southeast Asia Fertilizer Industry Revenue Share (%), by Consumption Analysis 2024 & 2032
- Figure 44: Middle East & Africa Southeast Asia Fertilizer Industry Revenue (Million), by Import Market Analysis (Value & Volume) 2024 & 2032
- Figure 45: Middle East & Africa Southeast Asia Fertilizer Industry Revenue Share (%), by Import Market Analysis (Value & Volume) 2024 & 2032
- Figure 46: Middle East & Africa Southeast Asia Fertilizer Industry Revenue (Million), by Export Market Analysis (Value & Volume) 2024 & 2032
- Figure 47: Middle East & Africa Southeast Asia Fertilizer Industry Revenue Share (%), by Export Market Analysis (Value & Volume) 2024 & 2032
- Figure 48: Middle East & Africa Southeast Asia Fertilizer Industry Revenue (Million), by Price Trend Analysis 2024 & 2032
- Figure 49: Middle East & Africa Southeast Asia Fertilizer Industry Revenue Share (%), by Price Trend Analysis 2024 & 2032
- Figure 50: Middle East & Africa Southeast Asia Fertilizer Industry Revenue (Million), by Country 2024 & 2032
- Figure 51: Middle East & Africa Southeast Asia Fertilizer Industry Revenue Share (%), by Country 2024 & 2032
- Figure 52: Asia Pacific Southeast Asia Fertilizer Industry Revenue (Million), by Production Analysis 2024 & 2032
- Figure 53: Asia Pacific Southeast Asia Fertilizer Industry Revenue Share (%), by Production Analysis 2024 & 2032
- Figure 54: Asia Pacific Southeast Asia Fertilizer Industry Revenue (Million), by Consumption Analysis 2024 & 2032
- Figure 55: Asia Pacific Southeast Asia Fertilizer Industry Revenue Share (%), by Consumption Analysis 2024 & 2032
- Figure 56: Asia Pacific Southeast Asia Fertilizer Industry Revenue (Million), by Import Market Analysis (Value & Volume) 2024 & 2032
- Figure 57: Asia Pacific Southeast Asia Fertilizer Industry Revenue Share (%), by Import Market Analysis (Value & Volume) 2024 & 2032
- Figure 58: Asia Pacific Southeast Asia Fertilizer Industry Revenue (Million), by Export Market Analysis (Value & Volume) 2024 & 2032
- Figure 59: Asia Pacific Southeast Asia Fertilizer Industry Revenue Share (%), by Export Market Analysis (Value & Volume) 2024 & 2032
- Figure 60: Asia Pacific Southeast Asia Fertilizer Industry Revenue (Million), by Price Trend Analysis 2024 & 2032
- Figure 61: Asia Pacific Southeast Asia Fertilizer Industry Revenue Share (%), by Price Trend Analysis 2024 & 2032
- Figure 62: Asia Pacific Southeast Asia Fertilizer Industry Revenue (Million), by Country 2024 & 2032
- Figure 63: Asia Pacific Southeast Asia Fertilizer Industry Revenue Share (%), by Country 2024 & 2032
List of Tables
- Table 1: Global Southeast Asia Fertilizer Industry Revenue Million Forecast, by Region 2019 & 2032
- Table 2: Global Southeast Asia Fertilizer Industry Revenue Million Forecast, by Production Analysis 2019 & 2032
- Table 3: Global Southeast Asia Fertilizer Industry Revenue Million Forecast, by Consumption Analysis 2019 & 2032
- Table 4: Global Southeast Asia Fertilizer Industry Revenue Million Forecast, by Import Market Analysis (Value & Volume) 2019 & 2032
- Table 5: Global Southeast Asia Fertilizer Industry Revenue Million Forecast, by Export Market Analysis (Value & Volume) 2019 & 2032
- Table 6: Global Southeast Asia Fertilizer Industry Revenue Million Forecast, by Price Trend Analysis 2019 & 2032
- Table 7: Global Southeast Asia Fertilizer Industry Revenue Million Forecast, by Region 2019 & 2032
- Table 8: Global Southeast Asia Fertilizer Industry Revenue Million Forecast, by Country 2019 & 2032
- Table 9: China Southeast Asia Fertilizer Industry Revenue (Million) Forecast, by Application 2019 & 2032
- Table 10: Japan Southeast Asia Fertilizer Industry Revenue (Million) Forecast, by Application 2019 & 2032
- Table 11: India Southeast Asia Fertilizer Industry Revenue (Million) Forecast, by Application 2019 & 2032
- Table 12: South Korea Southeast Asia Fertilizer Industry Revenue (Million) Forecast, by Application 2019 & 2032
- Table 13: Taiwan Southeast Asia Fertilizer Industry Revenue (Million) Forecast, by Application 2019 & 2032
- Table 14: Australia Southeast Asia Fertilizer Industry Revenue (Million) Forecast, by Application 2019 & 2032
- Table 15: Rest of Asia-Pacific Southeast Asia Fertilizer Industry Revenue (Million) Forecast, by Application 2019 & 2032
- Table 16: Global Southeast Asia Fertilizer Industry Revenue Million Forecast, by Production Analysis 2019 & 2032
- Table 17: Global Southeast Asia Fertilizer Industry Revenue Million Forecast, by Consumption Analysis 2019 & 2032
- Table 18: Global Southeast Asia Fertilizer Industry Revenue Million Forecast, by Import Market Analysis (Value & Volume) 2019 & 2032
- Table 19: Global Southeast Asia Fertilizer Industry Revenue Million Forecast, by Export Market Analysis (Value & Volume) 2019 & 2032
- Table 20: Global Southeast Asia Fertilizer Industry Revenue Million Forecast, by Price Trend Analysis 2019 & 2032
- Table 21: Global Southeast Asia Fertilizer Industry Revenue Million Forecast, by Country 2019 & 2032
- Table 22: United States Southeast Asia Fertilizer Industry Revenue (Million) Forecast, by Application 2019 & 2032
- Table 23: Canada Southeast Asia Fertilizer Industry Revenue (Million) Forecast, by Application 2019 & 2032
- Table 24: Mexico Southeast Asia Fertilizer Industry Revenue (Million) Forecast, by Application 2019 & 2032
- Table 25: Global Southeast Asia Fertilizer Industry Revenue Million Forecast, by Production Analysis 2019 & 2032
- Table 26: Global Southeast Asia Fertilizer Industry Revenue Million Forecast, by Consumption Analysis 2019 & 2032
- Table 27: Global Southeast Asia Fertilizer Industry Revenue Million Forecast, by Import Market Analysis (Value & Volume) 2019 & 2032
- Table 28: Global Southeast Asia Fertilizer Industry Revenue Million Forecast, by Export Market Analysis (Value & Volume) 2019 & 2032
- Table 29: Global Southeast Asia Fertilizer Industry Revenue Million Forecast, by Price Trend Analysis 2019 & 2032
- Table 30: Global Southeast Asia Fertilizer Industry Revenue Million Forecast, by Country 2019 & 2032
- Table 31: Brazil Southeast Asia Fertilizer Industry Revenue (Million) Forecast, by Application 2019 & 2032
- Table 32: Argentina Southeast Asia Fertilizer Industry Revenue (Million) Forecast, by Application 2019 & 2032
- Table 33: Rest of South America Southeast Asia Fertilizer Industry Revenue (Million) Forecast, by Application 2019 & 2032
- Table 34: Global Southeast Asia Fertilizer Industry Revenue Million Forecast, by Production Analysis 2019 & 2032
- Table 35: Global Southeast Asia Fertilizer Industry Revenue Million Forecast, by Consumption Analysis 2019 & 2032
- Table 36: Global Southeast Asia Fertilizer Industry Revenue Million Forecast, by Import Market Analysis (Value & Volume) 2019 & 2032
- Table 37: Global Southeast Asia Fertilizer Industry Revenue Million Forecast, by Export Market Analysis (Value & Volume) 2019 & 2032
- Table 38: Global Southeast Asia Fertilizer Industry Revenue Million Forecast, by Price Trend Analysis 2019 & 2032
- Table 39: Global Southeast Asia Fertilizer Industry Revenue Million Forecast, by Country 2019 & 2032
- Table 40: United Kingdom Southeast Asia Fertilizer Industry Revenue (Million) Forecast, by Application 2019 & 2032
- Table 41: Germany Southeast Asia Fertilizer Industry Revenue (Million) Forecast, by Application 2019 & 2032
- Table 42: France Southeast Asia Fertilizer Industry Revenue (Million) Forecast, by Application 2019 & 2032
- Table 43: Italy Southeast Asia Fertilizer Industry Revenue (Million) Forecast, by Application 2019 & 2032
- Table 44: Spain Southeast Asia Fertilizer Industry Revenue (Million) Forecast, by Application 2019 & 2032
- Table 45: Russia Southeast Asia Fertilizer Industry Revenue (Million) Forecast, by Application 2019 & 2032
- Table 46: Benelux Southeast Asia Fertilizer Industry Revenue (Million) Forecast, by Application 2019 & 2032
- Table 47: Nordics Southeast Asia Fertilizer Industry Revenue (Million) Forecast, by Application 2019 & 2032
- Table 48: Rest of Europe Southeast Asia Fertilizer Industry Revenue (Million) Forecast, by Application 2019 & 2032
- Table 49: Global Southeast Asia Fertilizer Industry Revenue Million Forecast, by Production Analysis 2019 & 2032
- Table 50: Global Southeast Asia Fertilizer Industry Revenue Million Forecast, by Consumption Analysis 2019 & 2032
- Table 51: Global Southeast Asia Fertilizer Industry Revenue Million Forecast, by Import Market Analysis (Value & Volume) 2019 & 2032
- Table 52: Global Southeast Asia Fertilizer Industry Revenue Million Forecast, by Export Market Analysis (Value & Volume) 2019 & 2032
- Table 53: Global Southeast Asia Fertilizer Industry Revenue Million Forecast, by Price Trend Analysis 2019 & 2032
- Table 54: Global Southeast Asia Fertilizer Industry Revenue Million Forecast, by Country 2019 & 2032
- Table 55: Turkey Southeast Asia Fertilizer Industry Revenue (Million) Forecast, by Application 2019 & 2032
- Table 56: Israel Southeast Asia Fertilizer Industry Revenue (Million) Forecast, by Application 2019 & 2032
- Table 57: GCC Southeast Asia Fertilizer Industry Revenue (Million) Forecast, by Application 2019 & 2032
- Table 58: North Africa Southeast Asia Fertilizer Industry Revenue (Million) Forecast, by Application 2019 & 2032
- Table 59: South Africa Southeast Asia Fertilizer Industry Revenue (Million) Forecast, by Application 2019 & 2032
- Table 60: Rest of Middle East & Africa Southeast Asia Fertilizer Industry Revenue (Million) Forecast, by Application 2019 & 2032
- Table 61: Global Southeast Asia Fertilizer Industry Revenue Million Forecast, by Production Analysis 2019 & 2032
- Table 62: Global Southeast Asia Fertilizer Industry Revenue Million Forecast, by Consumption Analysis 2019 & 2032
- Table 63: Global Southeast Asia Fertilizer Industry Revenue Million Forecast, by Import Market Analysis (Value & Volume) 2019 & 2032
- Table 64: Global Southeast Asia Fertilizer Industry Revenue Million Forecast, by Export Market Analysis (Value & Volume) 2019 & 2032
- Table 65: Global Southeast Asia Fertilizer Industry Revenue Million Forecast, by Price Trend Analysis 2019 & 2032
- Table 66: Global Southeast Asia Fertilizer Industry Revenue Million Forecast, by Country 2019 & 2032
- Table 67: China Southeast Asia Fertilizer Industry Revenue (Million) Forecast, by Application 2019 & 2032
- Table 68: India Southeast Asia Fertilizer Industry Revenue (Million) Forecast, by Application 2019 & 2032
- Table 69: Japan Southeast Asia Fertilizer Industry Revenue (Million) Forecast, by Application 2019 & 2032
- Table 70: South Korea Southeast Asia Fertilizer Industry Revenue (Million) Forecast, by Application 2019 & 2032
- Table 71: ASEAN Southeast Asia Fertilizer Industry Revenue (Million) Forecast, by Application 2019 & 2032
- Table 72: Oceania Southeast Asia Fertilizer Industry Revenue (Million) Forecast, by Application 2019 & 2032
- Table 73: Rest of Asia Pacific Southeast Asia Fertilizer Industry Revenue (Million) Forecast, by Application 2019 & 2032
Frequently Asked Questions
1. What is the projected Compound Annual Growth Rate (CAGR) of the Southeast Asia Fertilizer Industry?
The projected CAGR is approximately 4.20%.
2. Which companies are prominent players in the Southeast Asia Fertilizer Industry?
Key companies in the market include Song Gianh Corporation, Thai Central Chemical Public Company Limited, Saksiam Group, Nufarm, Terragro Fertilizer Co Ltd, Yara International ASA, Farmcochem Group, Ninh Binh Phosphate Fertilizer JSC, PK Fertilizers*List Not Exhaustive, Southern Fertilizer JSC.
3. What are the main segments of the Southeast Asia Fertilizer Industry?
The market segments include Production Analysis, Consumption Analysis, Import Market Analysis (Value & Volume), Export Market Analysis (Value & Volume), Price Trend Analysis.
4. Can you provide details about the market size?
The market size is estimated to be USD 10.77 Million as of 2022.
5. What are some drivers contributing to market growth?
Demand For Higher Crop Yields; Application of Chelates in Micronutrient Intoxication; Micronutrient Deficiency In Soil.
6. What are the notable trends driving market growth?
Need for Improving Productivity Amid Growing Demand for Food Crops.
7. Are there any restraints impacting market growth?
Non-biodegradable Nature of Chelates; Rise of Organic Farming and Restriction on the Use of Synthetic Chelating Agents.
8. Can you provide examples of recent developments in the market?
N/A
9. What pricing options are available for accessing the report?
Pricing options include single-user, multi-user, and enterprise licenses priced at USD 4750, USD 5250, and USD 8750 respectively.
10. Is the market size provided in terms of value or volume?
The market size is provided in terms of value, measured in Million.
11. Are there any specific market keywords associated with the report?
Yes, the market keyword associated with the report is "Southeast Asia Fertilizer Industry," which aids in identifying and referencing the specific market segment covered.
12. How do I determine which pricing option suits my needs best?
The pricing options vary based on user requirements and access needs. Individual users may opt for single-user licenses, while businesses requiring broader access may choose multi-user or enterprise licenses for cost-effective access to the report.
13. Are there any additional resources or data provided in the Southeast Asia Fertilizer Industry report?
While the report offers comprehensive insights, it's advisable to review the specific contents or supplementary materials provided to ascertain if additional resources or data are available.
14. How can I stay updated on further developments or reports in the Southeast Asia Fertilizer Industry?
To stay informed about further developments, trends, and reports in the Southeast Asia Fertilizer Industry, consider subscribing to industry newsletters, following relevant companies and organizations, or regularly checking reputable industry news sources and publications.
Methodology
Step 1 - Identification of Relevant Samples Size from Population Database


Step 2 - Approaches for Defining Global Market Size (Value, Volume* & Price*)

Note*: In applicable scenarios
Step 3 - Data Sources
Primary Research
- Web Analytics
- Survey Reports
- Research Institute
- Latest Research Reports
- Opinion Leaders
Secondary Research
- Annual Reports
- White Paper
- Latest Press Release
- Industry Association
- Paid Database
- Investor Presentations

Step 4 - Data Triangulation
Involves using different sources of information in order to increase the validity of a study
These sources are likely to be stakeholders in a program - participants, other researchers, program staff, other community members, and so on.
Then we put all data in single framework & apply various statistical tools to find out the dynamic on the market.
During the analysis stage, feedback from the stakeholder groups would be compared to determine areas of agreement as well as areas of divergence
