

Key Insights
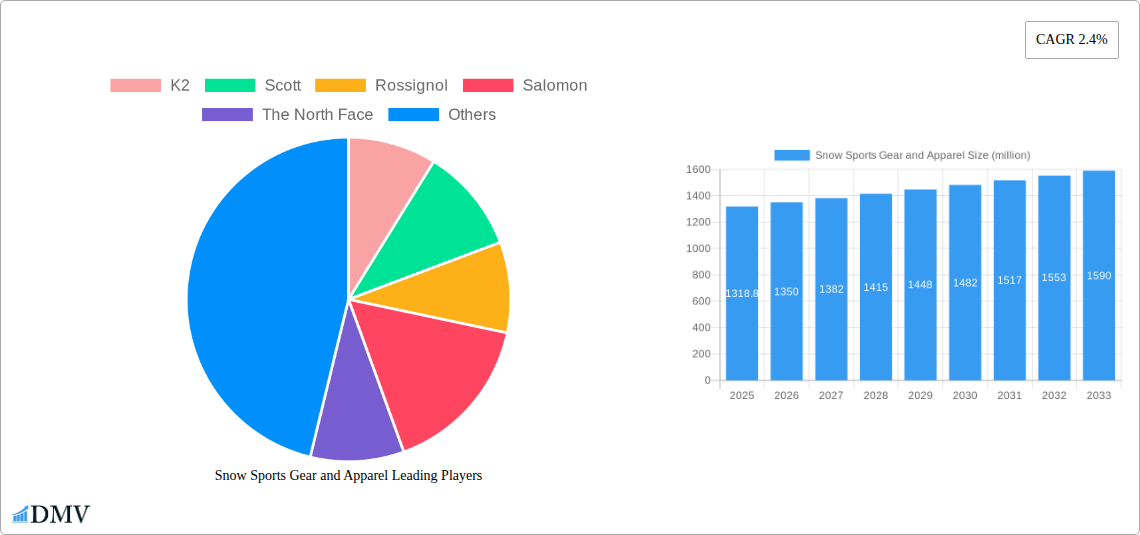
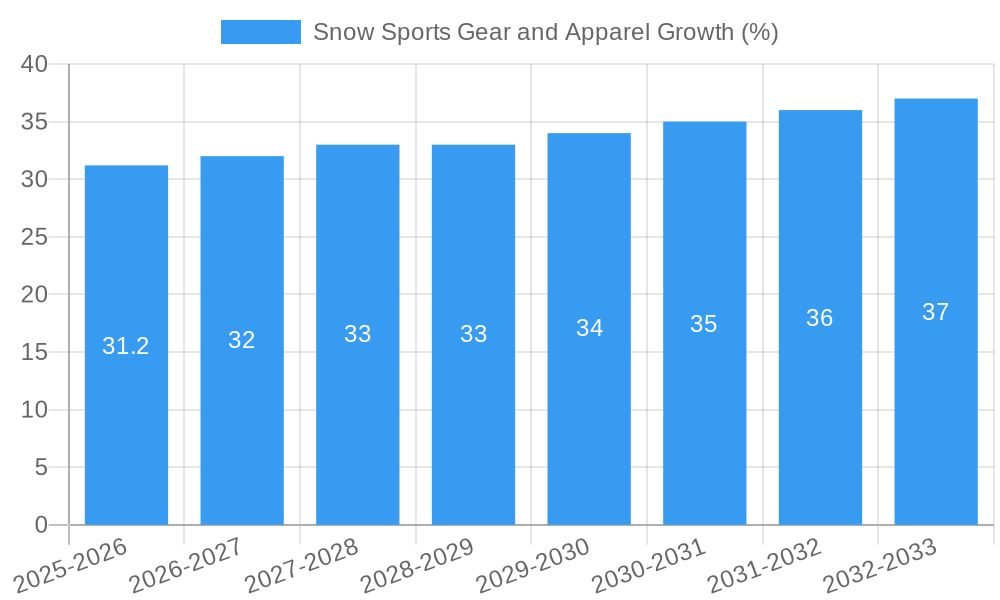
The global snow sports gear and apparel market, valued at $1318.8 million in 2025, is projected to experience steady growth, driven by several key factors. Rising disposable incomes in developing economies, coupled with a growing interest in outdoor recreational activities, particularly among millennials and Gen Z, are fueling demand for high-performance and stylish snow sports equipment. Technological advancements in materials science are leading to lighter, warmer, and more durable products, enhancing the overall user experience and attracting a wider range of participants. The increasing popularity of winter sports tourism, including skiing, snowboarding, and snowshoeing, further contributes to market expansion. However, challenges remain, including the impact of climate change on snowfall patterns and the associated economic implications for ski resorts and related industries. Furthermore, price sensitivity and the availability of affordable alternatives can influence purchasing decisions, especially in price-conscious markets. Despite these restraints, the market is expected to exhibit a Compound Annual Growth Rate (CAGR) of 2.4% between 2025 and 2033, indicating a positive outlook for long-term growth.
The competitive landscape is characterized by a mix of established international brands and emerging niche players. Major players like K2, Salomon, Rossignol, and The North Face dominate the market through strong brand recognition, extensive distribution networks, and continuous product innovation. These brands leverage endorsements from professional athletes and strategic collaborations to solidify their market positions. Meanwhile, smaller, specialized brands cater to specific segments, offering high-quality, often niche, products that command premium pricing. The market’s future growth will likely be influenced by the success of these established brands in adapting to changing consumer preferences, incorporating sustainable manufacturing practices, and responding to the evolving demands of a climate-conscious consumer base. Furthermore, the increasing adoption of e-commerce platforms is expected to reshape the retail landscape, creating both opportunities and challenges for brands.
Snow Sports Gear and Apparel Market Report: 2019-2033
This comprehensive report provides an in-depth analysis of the global snow sports gear and apparel market, projecting a market valuation exceeding $XX million by 2033. The study period covers 2019-2033, with a base year of 2025 and a forecast period of 2025-2033. This insightful analysis meticulously examines market trends, competitive dynamics, technological advancements, and future growth prospects, offering valuable insights for stakeholders across the value chain. Key players analyzed include K2, Scott, Rossignol, Salomon, The North Face, and many more. This report is essential for businesses seeking to navigate the evolving landscape of this dynamic industry.
Snow Sports Gear and Apparel Market Composition & Trends
The global snow sports gear and apparel market, valued at $XX million in 2025, exhibits a moderately concentrated landscape. Key players like K2, Scott, and Rossignol hold significant market share, while numerous smaller niche players cater to specific segments. Market share distribution is dynamic, influenced by product innovation, marketing strategies, and strategic acquisitions.
- Market Concentration: The Herfindahl-Hirschman Index (HHI) for the market is estimated at XX, indicating a moderately concentrated market.
- Innovation Catalysts: Advancements in materials science (e.g., lightweight, durable fabrics) and technology (e.g., integrated heating systems, performance tracking sensors) are driving product innovation.
- Regulatory Landscape: Regulations concerning product safety and environmental sustainability are shaping market practices and influencing product development.
- Substitute Products: The market faces competition from alternative recreational activities and apparel brands offering comparable functionalities.
- End-User Profiles: The market primarily caters to passionate skiers and snowboarders, encompassing both amateur and professional athletes, with a growing segment of eco-conscious consumers.
- M&A Activities: The historical period (2019-2024) witnessed XX million in M&A deals, predominantly focused on expanding product portfolios and market reach. We project $XX million in M&A activity during the forecast period (2025-2033).
Snow Sports Gear and Apparel Industry Evolution
From 2019 to 2024, the snow sports gear and apparel market experienced a Compound Annual Growth Rate (CAGR) of XX%. This growth trajectory is attributed to several factors: the increasing popularity of winter sports, particularly among younger demographics, the rise of e-commerce, and the development of innovative, high-performance products. The market is witnessing a notable shift in consumer demand towards sustainable and ethically sourced products, prompting brands to adopt eco-friendly manufacturing practices and utilize recycled materials. Technological advancements, such as the integration of smart technology into apparel and equipment, have enhanced the user experience, leading to increased adoption rates. For instance, the adoption rate of heated apparel increased by XX% between 2020 and 2024. The forecast period (2025-2033) projects a CAGR of XX%, driven by continued innovation and expanding market penetration in emerging economies.
Leading Regions, Countries, or Segments in Snow Sports Gear and Apparel
North America and Europe remain dominant regions, accounting for XX% of the global market in 2025. This dominance is driven by several factors:
- High Participation Rates: Established winter sports culture and infrastructure contribute to high participation rates.
- Strong Consumer Spending: High disposable incomes support significant investment in high-quality equipment and apparel.
- Technological Advancements: These regions are hubs for innovation and technological advancements in snow sports gear.
- Government Support: Government initiatives promoting winter tourism and sports development further bolster the market.
- Well-established Distribution Networks: Efficient distribution channels ensure product availability and accessibility to consumers.
Asia-Pacific is experiencing the fastest growth, with a projected CAGR of XX% during the forecast period, fueled by rising disposable incomes and increasing participation in winter sports.
Snow Sports Gear and Apparel Product Innovations
Recent innovations include lighter, more breathable fabrics incorporating advanced waterproofing technologies, integrated heating systems for apparel and boots, and enhanced safety features in helmets and protective gear. These advancements cater to consumer demand for improved performance, comfort, and safety, resulting in a premium price point for advanced products. Companies are also increasingly focusing on developing sustainable and environmentally friendly products using recycled and bio-based materials.
Propelling Factors for Snow Sports Gear and Apparel Growth
Several factors contribute to the market's growth. Technological advancements, such as improved materials and designs, enhance product performance and appeal. The rising disposable income in emerging economies increases purchasing power. Favorable government policies supporting winter sports tourism further boost the market. Finally, the growing popularity of winter sports among diverse demographics fuels sustained growth.
Obstacles in the Snow Sports Gear and Apparel Market
The market faces challenges such as unpredictable weather patterns impacting the winter sports season, fluctuating raw material prices, and intense competition from established and emerging brands. Supply chain disruptions, particularly concerning raw materials sourced globally, can lead to production delays and increased costs. These factors can negatively influence profitability and market expansion.
Future Opportunities in Snow Sports Gear and Apparel
Significant opportunities lie in expanding into emerging markets, developing eco-friendly and sustainable products, and leveraging smart technologies for enhanced product functionality and user experience. Personalized products, catering to individual needs and preferences, represent a significant growth area. Furthermore, integrating data analytics and wearable technology offers potential for personalized training and performance optimization.
Major Players in the Snow Sports Gear and Apparel Ecosystem
- K2
- Scott
- Rossignol
- Salomon
- The North Face
- Dynafit
- Tecnica
- Fischer
- Atomic
- Marker
- Volkl
- Marmot
- Diabello
- Blizzard
- Arcteryx
- Dynastar
- Black Diamond
- Elan
- La Sportiva
- Mammut
- Vaude
- Movement
- Salewa
- Lange
- Black Crows
- Millet
- Hagan
- Uvex
- Wedze
- Deuter
Key Developments in Snow Sports Gear and Apparel Industry
- 2022 Q4: Salomon launched a new line of sustainable ski boots.
- 2023 Q1: K2 acquired a smaller competitor, expanding its market share.
- 2023 Q3: The North Face introduced a new line of recycled-material snow jackets.
- (Further details would be added based on actual market developments)
Strategic Snow Sports Gear and Apparel Market Forecast
The snow sports gear and apparel market is poised for continued growth, driven by innovation, expanding market penetration, and the growing popularity of winter sports globally. The forecast period (2025-2033) anticipates significant market expansion, particularly in emerging economies. Strategic partnerships and collaborations will play a key role in shaping future market dynamics, with a focus on sustainability and technological advancements.
Snow Sports Gear and Apparel Segmentation
-
1. Application
- 1.1. The Allrounder
- 1.2. The Uphill Ski Tourer
- 1.3. The Freeride Tourer
- 1.4. The Racer
-
2. Types
- 2.1. Ski Boots
- 2.2. Ski Bindings
- 2.3. Skis
- 2.4. Ski Backpacks
- 2.5. Ski Helmets
- 2.6. Ski Apparel
- 2.7. Others
Snow Sports Gear and Apparel Segmentation By Geography
-
1. North America
- 1.1. United States
- 1.2. Canada
- 1.3. Mexico
-
2. South America
- 2.1. Brazil
- 2.2. Argentina
- 2.3. Rest of South America
-
3. Europe
- 3.1. United Kingdom
- 3.2. Germany
- 3.3. France
- 3.4. Italy
- 3.5. Spain
- 3.6. Russia
- 3.7. Benelux
- 3.8. Nordics
- 3.9. Rest of Europe
-
4. Middle East & Africa
- 4.1. Turkey
- 4.2. Israel
- 4.3. GCC
- 4.4. North Africa
- 4.5. South Africa
- 4.6. Rest of Middle East & Africa
-
5. Asia Pacific
- 5.1. China
- 5.2. India
- 5.3. Japan
- 5.4. South Korea
- 5.5. ASEAN
- 5.6. Oceania
- 5.7. Rest of Asia Pacific

Snow Sports Gear and Apparel REPORT HIGHLIGHTS
| Aspects | Details |
|---|---|
| Study Period | 2019-2033 |
| Base Year | 2024 |
| Estimated Year | 2025 |
| Forecast Period | 2025-2033 |
| Historical Period | 2019-2024 |
| Growth Rate | CAGR of 2.4% from 2019-2033 |
| Segmentation |
|
Table of Contents
- 1. Introduction
- 1.1. Research Scope
- 1.2. Market Segmentation
- 1.3. Research Methodology
- 1.4. Definitions and Assumptions
- 2. Executive Summary
- 2.1. Introduction
- 3. Market Dynamics
- 3.1. Introduction
- 3.2. Market Drivers
- 3.3. Market Restrains
- 3.4. Market Trends
- 4. Market Factor Analysis
- 4.1. Porters Five Forces
- 4.2. Supply/Value Chain
- 4.3. PESTEL analysis
- 4.4. Market Entropy
- 4.5. Patent/Trademark Analysis
- 5. Global Snow Sports Gear and Apparel Analysis, Insights and Forecast, 2019-2031
- 5.1. Market Analysis, Insights and Forecast - by Application
- 5.1.1. The Allrounder
- 5.1.2. The Uphill Ski Tourer
- 5.1.3. The Freeride Tourer
- 5.1.4. The Racer
- 5.2. Market Analysis, Insights and Forecast - by Types
- 5.2.1. Ski Boots
- 5.2.2. Ski Bindings
- 5.2.3. Skis
- 5.2.4. Ski Backpacks
- 5.2.5. Ski Helmets
- 5.2.6. Ski Apparel
- 5.2.7. Others
- 5.3. Market Analysis, Insights and Forecast - by Region
- 5.3.1. North America
- 5.3.2. South America
- 5.3.3. Europe
- 5.3.4. Middle East & Africa
- 5.3.5. Asia Pacific
- 5.1. Market Analysis, Insights and Forecast - by Application
- 6. North America Snow Sports Gear and Apparel Analysis, Insights and Forecast, 2019-2031
- 6.1. Market Analysis, Insights and Forecast - by Application
- 6.1.1. The Allrounder
- 6.1.2. The Uphill Ski Tourer
- 6.1.3. The Freeride Tourer
- 6.1.4. The Racer
- 6.2. Market Analysis, Insights and Forecast - by Types
- 6.2.1. Ski Boots
- 6.2.2. Ski Bindings
- 6.2.3. Skis
- 6.2.4. Ski Backpacks
- 6.2.5. Ski Helmets
- 6.2.6. Ski Apparel
- 6.2.7. Others
- 6.1. Market Analysis, Insights and Forecast - by Application
- 7. South America Snow Sports Gear and Apparel Analysis, Insights and Forecast, 2019-2031
- 7.1. Market Analysis, Insights and Forecast - by Application
- 7.1.1. The Allrounder
- 7.1.2. The Uphill Ski Tourer
- 7.1.3. The Freeride Tourer
- 7.1.4. The Racer
- 7.2. Market Analysis, Insights and Forecast - by Types
- 7.2.1. Ski Boots
- 7.2.2. Ski Bindings
- 7.2.3. Skis
- 7.2.4. Ski Backpacks
- 7.2.5. Ski Helmets
- 7.2.6. Ski Apparel
- 7.2.7. Others
- 7.1. Market Analysis, Insights and Forecast - by Application
- 8. Europe Snow Sports Gear and Apparel Analysis, Insights and Forecast, 2019-2031
- 8.1. Market Analysis, Insights and Forecast - by Application
- 8.1.1. The Allrounder
- 8.1.2. The Uphill Ski Tourer
- 8.1.3. The Freeride Tourer
- 8.1.4. The Racer
- 8.2. Market Analysis, Insights and Forecast - by Types
- 8.2.1. Ski Boots
- 8.2.2. Ski Bindings
- 8.2.3. Skis
- 8.2.4. Ski Backpacks
- 8.2.5. Ski Helmets
- 8.2.6. Ski Apparel
- 8.2.7. Others
- 8.1. Market Analysis, Insights and Forecast - by Application
- 9. Middle East & Africa Snow Sports Gear and Apparel Analysis, Insights and Forecast, 2019-2031
- 9.1. Market Analysis, Insights and Forecast - by Application
- 9.1.1. The Allrounder
- 9.1.2. The Uphill Ski Tourer
- 9.1.3. The Freeride Tourer
- 9.1.4. The Racer
- 9.2. Market Analysis, Insights and Forecast - by Types
- 9.2.1. Ski Boots
- 9.2.2. Ski Bindings
- 9.2.3. Skis
- 9.2.4. Ski Backpacks
- 9.2.5. Ski Helmets
- 9.2.6. Ski Apparel
- 9.2.7. Others
- 9.1. Market Analysis, Insights and Forecast - by Application
- 10. Asia Pacific Snow Sports Gear and Apparel Analysis, Insights and Forecast, 2019-2031
- 10.1. Market Analysis, Insights and Forecast - by Application
- 10.1.1. The Allrounder
- 10.1.2. The Uphill Ski Tourer
- 10.1.3. The Freeride Tourer
- 10.1.4. The Racer
- 10.2. Market Analysis, Insights and Forecast - by Types
- 10.2.1. Ski Boots
- 10.2.2. Ski Bindings
- 10.2.3. Skis
- 10.2.4. Ski Backpacks
- 10.2.5. Ski Helmets
- 10.2.6. Ski Apparel
- 10.2.7. Others
- 10.1. Market Analysis, Insights and Forecast - by Application
- 11. Competitive Analysis
- 11.1. Global Market Share Analysis 2024
- 11.2. Company Profiles
- 11.2.1 K2
- 11.2.1.1. Overview
- 11.2.1.2. Products
- 11.2.1.3. SWOT Analysis
- 11.2.1.4. Recent Developments
- 11.2.1.5. Financials (Based on Availability)
- 11.2.2 Scott
- 11.2.2.1. Overview
- 11.2.2.2. Products
- 11.2.2.3. SWOT Analysis
- 11.2.2.4. Recent Developments
- 11.2.2.5. Financials (Based on Availability)
- 11.2.3 Rossignol
- 11.2.3.1. Overview
- 11.2.3.2. Products
- 11.2.3.3. SWOT Analysis
- 11.2.3.4. Recent Developments
- 11.2.3.5. Financials (Based on Availability)
- 11.2.4 Salomon
- 11.2.4.1. Overview
- 11.2.4.2. Products
- 11.2.4.3. SWOT Analysis
- 11.2.4.4. Recent Developments
- 11.2.4.5. Financials (Based on Availability)
- 11.2.5 The North Face
- 11.2.5.1. Overview
- 11.2.5.2. Products
- 11.2.5.3. SWOT Analysis
- 11.2.5.4. Recent Developments
- 11.2.5.5. Financials (Based on Availability)
- 11.2.6 Dynafit
- 11.2.6.1. Overview
- 11.2.6.2. Products
- 11.2.6.3. SWOT Analysis
- 11.2.6.4. Recent Developments
- 11.2.6.5. Financials (Based on Availability)
- 11.2.7 Tecnica
- 11.2.7.1. Overview
- 11.2.7.2. Products
- 11.2.7.3. SWOT Analysis
- 11.2.7.4. Recent Developments
- 11.2.7.5. Financials (Based on Availability)
- 11.2.8 Fischer
- 11.2.8.1. Overview
- 11.2.8.2. Products
- 11.2.8.3. SWOT Analysis
- 11.2.8.4. Recent Developments
- 11.2.8.5. Financials (Based on Availability)
- 11.2.9 Atomic
- 11.2.9.1. Overview
- 11.2.9.2. Products
- 11.2.9.3. SWOT Analysis
- 11.2.9.4. Recent Developments
- 11.2.9.5. Financials (Based on Availability)
- 11.2.10 Marker
- 11.2.10.1. Overview
- 11.2.10.2. Products
- 11.2.10.3. SWOT Analysis
- 11.2.10.4. Recent Developments
- 11.2.10.5. Financials (Based on Availability)
- 11.2.11 Volkl
- 11.2.11.1. Overview
- 11.2.11.2. Products
- 11.2.11.3. SWOT Analysis
- 11.2.11.4. Recent Developments
- 11.2.11.5. Financials (Based on Availability)
- 11.2.12 Marmot
- 11.2.12.1. Overview
- 11.2.12.2. Products
- 11.2.12.3. SWOT Analysis
- 11.2.12.4. Recent Developments
- 11.2.12.5. Financials (Based on Availability)
- 11.2.13 Diabello
- 11.2.13.1. Overview
- 11.2.13.2. Products
- 11.2.13.3. SWOT Analysis
- 11.2.13.4. Recent Developments
- 11.2.13.5. Financials (Based on Availability)
- 11.2.14 Blizzard
- 11.2.14.1. Overview
- 11.2.14.2. Products
- 11.2.14.3. SWOT Analysis
- 11.2.14.4. Recent Developments
- 11.2.14.5. Financials (Based on Availability)
- 11.2.15 Arcteryx
- 11.2.15.1. Overview
- 11.2.15.2. Products
- 11.2.15.3. SWOT Analysis
- 11.2.15.4. Recent Developments
- 11.2.15.5. Financials (Based on Availability)
- 11.2.16 Dynastar
- 11.2.16.1. Overview
- 11.2.16.2. Products
- 11.2.16.3. SWOT Analysis
- 11.2.16.4. Recent Developments
- 11.2.16.5. Financials (Based on Availability)
- 11.2.17 Black Diamond
- 11.2.17.1. Overview
- 11.2.17.2. Products
- 11.2.17.3. SWOT Analysis
- 11.2.17.4. Recent Developments
- 11.2.17.5. Financials (Based on Availability)
- 11.2.18 Elan
- 11.2.18.1. Overview
- 11.2.18.2. Products
- 11.2.18.3. SWOT Analysis
- 11.2.18.4. Recent Developments
- 11.2.18.5. Financials (Based on Availability)
- 11.2.19 La Sportiva
- 11.2.19.1. Overview
- 11.2.19.2. Products
- 11.2.19.3. SWOT Analysis
- 11.2.19.4. Recent Developments
- 11.2.19.5. Financials (Based on Availability)
- 11.2.20 Mammut
- 11.2.20.1. Overview
- 11.2.20.2. Products
- 11.2.20.3. SWOT Analysis
- 11.2.20.4. Recent Developments
- 11.2.20.5. Financials (Based on Availability)
- 11.2.21 Vaude
- 11.2.21.1. Overview
- 11.2.21.2. Products
- 11.2.21.3. SWOT Analysis
- 11.2.21.4. Recent Developments
- 11.2.21.5. Financials (Based on Availability)
- 11.2.22 Movement
- 11.2.22.1. Overview
- 11.2.22.2. Products
- 11.2.22.3. SWOT Analysis
- 11.2.22.4. Recent Developments
- 11.2.22.5. Financials (Based on Availability)
- 11.2.23 Salewa
- 11.2.23.1. Overview
- 11.2.23.2. Products
- 11.2.23.3. SWOT Analysis
- 11.2.23.4. Recent Developments
- 11.2.23.5. Financials (Based on Availability)
- 11.2.24 Lange
- 11.2.24.1. Overview
- 11.2.24.2. Products
- 11.2.24.3. SWOT Analysis
- 11.2.24.4. Recent Developments
- 11.2.24.5. Financials (Based on Availability)
- 11.2.25 Black Crows
- 11.2.25.1. Overview
- 11.2.25.2. Products
- 11.2.25.3. SWOT Analysis
- 11.2.25.4. Recent Developments
- 11.2.25.5. Financials (Based on Availability)
- 11.2.26 Millet
- 11.2.26.1. Overview
- 11.2.26.2. Products
- 11.2.26.3. SWOT Analysis
- 11.2.26.4. Recent Developments
- 11.2.26.5. Financials (Based on Availability)
- 11.2.27 Hagan
- 11.2.27.1. Overview
- 11.2.27.2. Products
- 11.2.27.3. SWOT Analysis
- 11.2.27.4. Recent Developments
- 11.2.27.5. Financials (Based on Availability)
- 11.2.28 Uvex
- 11.2.28.1. Overview
- 11.2.28.2. Products
- 11.2.28.3. SWOT Analysis
- 11.2.28.4. Recent Developments
- 11.2.28.5. Financials (Based on Availability)
- 11.2.29 Wedze
- 11.2.29.1. Overview
- 11.2.29.2. Products
- 11.2.29.3. SWOT Analysis
- 11.2.29.4. Recent Developments
- 11.2.29.5. Financials (Based on Availability)
- 11.2.30 Deuter
- 11.2.30.1. Overview
- 11.2.30.2. Products
- 11.2.30.3. SWOT Analysis
- 11.2.30.4. Recent Developments
- 11.2.30.5. Financials (Based on Availability)
- 11.2.1 K2
List of Figures
- Figure 1: Global Snow Sports Gear and Apparel Revenue Breakdown (million, %) by Region 2024 & 2032
- Figure 2: North America Snow Sports Gear and Apparel Revenue (million), by Application 2024 & 2032
- Figure 3: North America Snow Sports Gear and Apparel Revenue Share (%), by Application 2024 & 2032
- Figure 4: North America Snow Sports Gear and Apparel Revenue (million), by Types 2024 & 2032
- Figure 5: North America Snow Sports Gear and Apparel Revenue Share (%), by Types 2024 & 2032
- Figure 6: North America Snow Sports Gear and Apparel Revenue (million), by Country 2024 & 2032
- Figure 7: North America Snow Sports Gear and Apparel Revenue Share (%), by Country 2024 & 2032
- Figure 8: South America Snow Sports Gear and Apparel Revenue (million), by Application 2024 & 2032
- Figure 9: South America Snow Sports Gear and Apparel Revenue Share (%), by Application 2024 & 2032
- Figure 10: South America Snow Sports Gear and Apparel Revenue (million), by Types 2024 & 2032
- Figure 11: South America Snow Sports Gear and Apparel Revenue Share (%), by Types 2024 & 2032
- Figure 12: South America Snow Sports Gear and Apparel Revenue (million), by Country 2024 & 2032
- Figure 13: South America Snow Sports Gear and Apparel Revenue Share (%), by Country 2024 & 2032
- Figure 14: Europe Snow Sports Gear and Apparel Revenue (million), by Application 2024 & 2032
- Figure 15: Europe Snow Sports Gear and Apparel Revenue Share (%), by Application 2024 & 2032
- Figure 16: Europe Snow Sports Gear and Apparel Revenue (million), by Types 2024 & 2032
- Figure 17: Europe Snow Sports Gear and Apparel Revenue Share (%), by Types 2024 & 2032
- Figure 18: Europe Snow Sports Gear and Apparel Revenue (million), by Country 2024 & 2032
- Figure 19: Europe Snow Sports Gear and Apparel Revenue Share (%), by Country 2024 & 2032
- Figure 20: Middle East & Africa Snow Sports Gear and Apparel Revenue (million), by Application 2024 & 2032
- Figure 21: Middle East & Africa Snow Sports Gear and Apparel Revenue Share (%), by Application 2024 & 2032
- Figure 22: Middle East & Africa Snow Sports Gear and Apparel Revenue (million), by Types 2024 & 2032
- Figure 23: Middle East & Africa Snow Sports Gear and Apparel Revenue Share (%), by Types 2024 & 2032
- Figure 24: Middle East & Africa Snow Sports Gear and Apparel Revenue (million), by Country 2024 & 2032
- Figure 25: Middle East & Africa Snow Sports Gear and Apparel Revenue Share (%), by Country 2024 & 2032
- Figure 26: Asia Pacific Snow Sports Gear and Apparel Revenue (million), by Application 2024 & 2032
- Figure 27: Asia Pacific Snow Sports Gear and Apparel Revenue Share (%), by Application 2024 & 2032
- Figure 28: Asia Pacific Snow Sports Gear and Apparel Revenue (million), by Types 2024 & 2032
- Figure 29: Asia Pacific Snow Sports Gear and Apparel Revenue Share (%), by Types 2024 & 2032
- Figure 30: Asia Pacific Snow Sports Gear and Apparel Revenue (million), by Country 2024 & 2032
- Figure 31: Asia Pacific Snow Sports Gear and Apparel Revenue Share (%), by Country 2024 & 2032
List of Tables
- Table 1: Global Snow Sports Gear and Apparel Revenue million Forecast, by Region 2019 & 2032
- Table 2: Global Snow Sports Gear and Apparel Revenue million Forecast, by Application 2019 & 2032
- Table 3: Global Snow Sports Gear and Apparel Revenue million Forecast, by Types 2019 & 2032
- Table 4: Global Snow Sports Gear and Apparel Revenue million Forecast, by Region 2019 & 2032
- Table 5: Global Snow Sports Gear and Apparel Revenue million Forecast, by Application 2019 & 2032
- Table 6: Global Snow Sports Gear and Apparel Revenue million Forecast, by Types 2019 & 2032
- Table 7: Global Snow Sports Gear and Apparel Revenue million Forecast, by Country 2019 & 2032
- Table 8: United States Snow Sports Gear and Apparel Revenue (million) Forecast, by Application 2019 & 2032
- Table 9: Canada Snow Sports Gear and Apparel Revenue (million) Forecast, by Application 2019 & 2032
- Table 10: Mexico Snow Sports Gear and Apparel Revenue (million) Forecast, by Application 2019 & 2032
- Table 11: Global Snow Sports Gear and Apparel Revenue million Forecast, by Application 2019 & 2032
- Table 12: Global Snow Sports Gear and Apparel Revenue million Forecast, by Types 2019 & 2032
- Table 13: Global Snow Sports Gear and Apparel Revenue million Forecast, by Country 2019 & 2032
- Table 14: Brazil Snow Sports Gear and Apparel Revenue (million) Forecast, by Application 2019 & 2032
- Table 15: Argentina Snow Sports Gear and Apparel Revenue (million) Forecast, by Application 2019 & 2032
- Table 16: Rest of South America Snow Sports Gear and Apparel Revenue (million) Forecast, by Application 2019 & 2032
- Table 17: Global Snow Sports Gear and Apparel Revenue million Forecast, by Application 2019 & 2032
- Table 18: Global Snow Sports Gear and Apparel Revenue million Forecast, by Types 2019 & 2032
- Table 19: Global Snow Sports Gear and Apparel Revenue million Forecast, by Country 2019 & 2032
- Table 20: United Kingdom Snow Sports Gear and Apparel Revenue (million) Forecast, by Application 2019 & 2032
- Table 21: Germany Snow Sports Gear and Apparel Revenue (million) Forecast, by Application 2019 & 2032
- Table 22: France Snow Sports Gear and Apparel Revenue (million) Forecast, by Application 2019 & 2032
- Table 23: Italy Snow Sports Gear and Apparel Revenue (million) Forecast, by Application 2019 & 2032
- Table 24: Spain Snow Sports Gear and Apparel Revenue (million) Forecast, by Application 2019 & 2032
- Table 25: Russia Snow Sports Gear and Apparel Revenue (million) Forecast, by Application 2019 & 2032
- Table 26: Benelux Snow Sports Gear and Apparel Revenue (million) Forecast, by Application 2019 & 2032
- Table 27: Nordics Snow Sports Gear and Apparel Revenue (million) Forecast, by Application 2019 & 2032
- Table 28: Rest of Europe Snow Sports Gear and Apparel Revenue (million) Forecast, by Application 2019 & 2032
- Table 29: Global Snow Sports Gear and Apparel Revenue million Forecast, by Application 2019 & 2032
- Table 30: Global Snow Sports Gear and Apparel Revenue million Forecast, by Types 2019 & 2032
- Table 31: Global Snow Sports Gear and Apparel Revenue million Forecast, by Country 2019 & 2032
- Table 32: Turkey Snow Sports Gear and Apparel Revenue (million) Forecast, by Application 2019 & 2032
- Table 33: Israel Snow Sports Gear and Apparel Revenue (million) Forecast, by Application 2019 & 2032
- Table 34: GCC Snow Sports Gear and Apparel Revenue (million) Forecast, by Application 2019 & 2032
- Table 35: North Africa Snow Sports Gear and Apparel Revenue (million) Forecast, by Application 2019 & 2032
- Table 36: South Africa Snow Sports Gear and Apparel Revenue (million) Forecast, by Application 2019 & 2032
- Table 37: Rest of Middle East & Africa Snow Sports Gear and Apparel Revenue (million) Forecast, by Application 2019 & 2032
- Table 38: Global Snow Sports Gear and Apparel Revenue million Forecast, by Application 2019 & 2032
- Table 39: Global Snow Sports Gear and Apparel Revenue million Forecast, by Types 2019 & 2032
- Table 40: Global Snow Sports Gear and Apparel Revenue million Forecast, by Country 2019 & 2032
- Table 41: China Snow Sports Gear and Apparel Revenue (million) Forecast, by Application 2019 & 2032
- Table 42: India Snow Sports Gear and Apparel Revenue (million) Forecast, by Application 2019 & 2032
- Table 43: Japan Snow Sports Gear and Apparel Revenue (million) Forecast, by Application 2019 & 2032
- Table 44: South Korea Snow Sports Gear and Apparel Revenue (million) Forecast, by Application 2019 & 2032
- Table 45: ASEAN Snow Sports Gear and Apparel Revenue (million) Forecast, by Application 2019 & 2032
- Table 46: Oceania Snow Sports Gear and Apparel Revenue (million) Forecast, by Application 2019 & 2032
- Table 47: Rest of Asia Pacific Snow Sports Gear and Apparel Revenue (million) Forecast, by Application 2019 & 2032
Frequently Asked Questions
1. What is the projected Compound Annual Growth Rate (CAGR) of the Snow Sports Gear and Apparel?
The projected CAGR is approximately 2.4%.
2. Which companies are prominent players in the Snow Sports Gear and Apparel?
Key companies in the market include K2, Scott, Rossignol, Salomon, The North Face, Dynafit, Tecnica, Fischer, Atomic, Marker, Volkl, Marmot, Diabello, Blizzard, Arcteryx, Dynastar, Black Diamond, Elan, La Sportiva, Mammut, Vaude, Movement, Salewa, Lange, Black Crows, Millet, Hagan, Uvex, Wedze, Deuter.
3. What are the main segments of the Snow Sports Gear and Apparel?
The market segments include Application, Types.
4. Can you provide details about the market size?
The market size is estimated to be USD 1318.8 million as of 2022.
5. What are some drivers contributing to market growth?
N/A
6. What are the notable trends driving market growth?
N/A
7. Are there any restraints impacting market growth?
N/A
8. Can you provide examples of recent developments in the market?
N/A
9. What pricing options are available for accessing the report?
Pricing options include single-user, multi-user, and enterprise licenses priced at USD 2900.00, USD 4350.00, and USD 5800.00 respectively.
10. Is the market size provided in terms of value or volume?
The market size is provided in terms of value, measured in million.
11. Are there any specific market keywords associated with the report?
Yes, the market keyword associated with the report is "Snow Sports Gear and Apparel," which aids in identifying and referencing the specific market segment covered.
12. How do I determine which pricing option suits my needs best?
The pricing options vary based on user requirements and access needs. Individual users may opt for single-user licenses, while businesses requiring broader access may choose multi-user or enterprise licenses for cost-effective access to the report.
13. Are there any additional resources or data provided in the Snow Sports Gear and Apparel report?
While the report offers comprehensive insights, it's advisable to review the specific contents or supplementary materials provided to ascertain if additional resources or data are available.
14. How can I stay updated on further developments or reports in the Snow Sports Gear and Apparel?
To stay informed about further developments, trends, and reports in the Snow Sports Gear and Apparel, consider subscribing to industry newsletters, following relevant companies and organizations, or regularly checking reputable industry news sources and publications.
Methodology
Step 1 - Identification of Relevant Samples Size from Population Database


Step 2 - Approaches for Defining Global Market Size (Value, Volume* & Price*)

Note*: In applicable scenarios
Step 3 - Data Sources
Primary Research
- Web Analytics
- Survey Reports
- Research Institute
- Latest Research Reports
- Opinion Leaders
Secondary Research
- Annual Reports
- White Paper
- Latest Press Release
- Industry Association
- Paid Database
- Investor Presentations

Step 4 - Data Triangulation
Involves using different sources of information in order to increase the validity of a study
These sources are likely to be stakeholders in a program - participants, other researchers, program staff, other community members, and so on.
Then we put all data in single framework & apply various statistical tools to find out the dynamic on the market.
During the analysis stage, feedback from the stakeholder groups would be compared to determine areas of agreement as well as areas of divergence
