

Key Insights
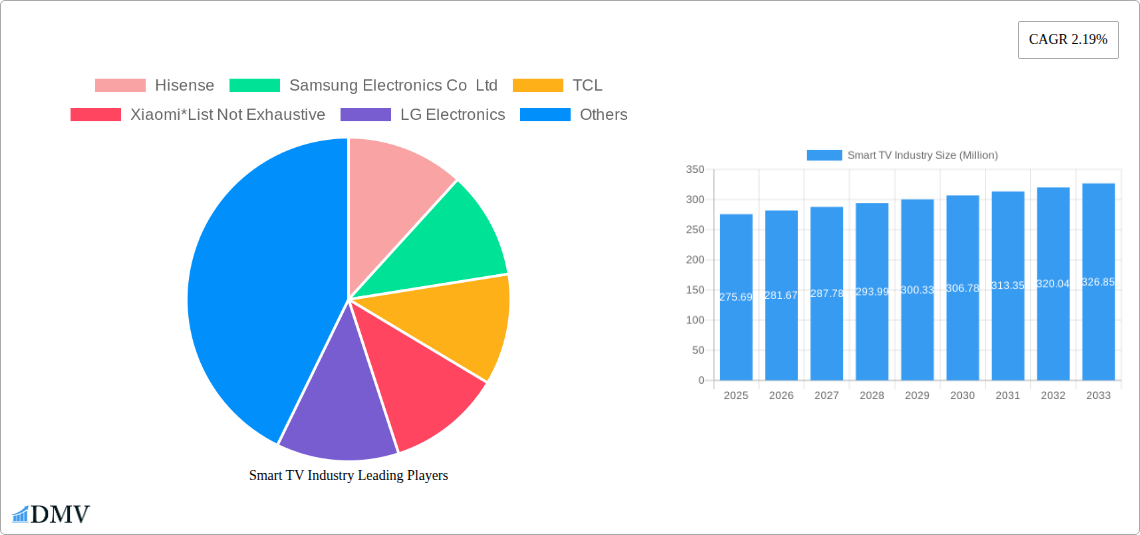
The global smart TV market, valued at $275.69 million in 2025, is projected to experience steady growth, driven by several key factors. Increasing disposable incomes, particularly in developing economies across Asia-Pacific and Latin America, are fueling demand for larger screen sizes and advanced features. The ongoing shift towards streaming services and over-the-top (OTT) content consumption is significantly boosting smart TV adoption. Technological advancements, such as the introduction of higher resolutions (8K) and improved display technologies like OLED and QLED, are further stimulating market expansion. Consumers are increasingly drawn to enhanced picture quality, immersive viewing experiences, and the integration of smart features like voice assistants and sophisticated operating systems. However, the market faces certain restraints. The high cost of premium features like 8K resolution and large screen sizes can limit accessibility for price-sensitive consumers. Furthermore, concerns around e-waste generation from the rapid replacement cycle of electronic devices pose a sustainability challenge.
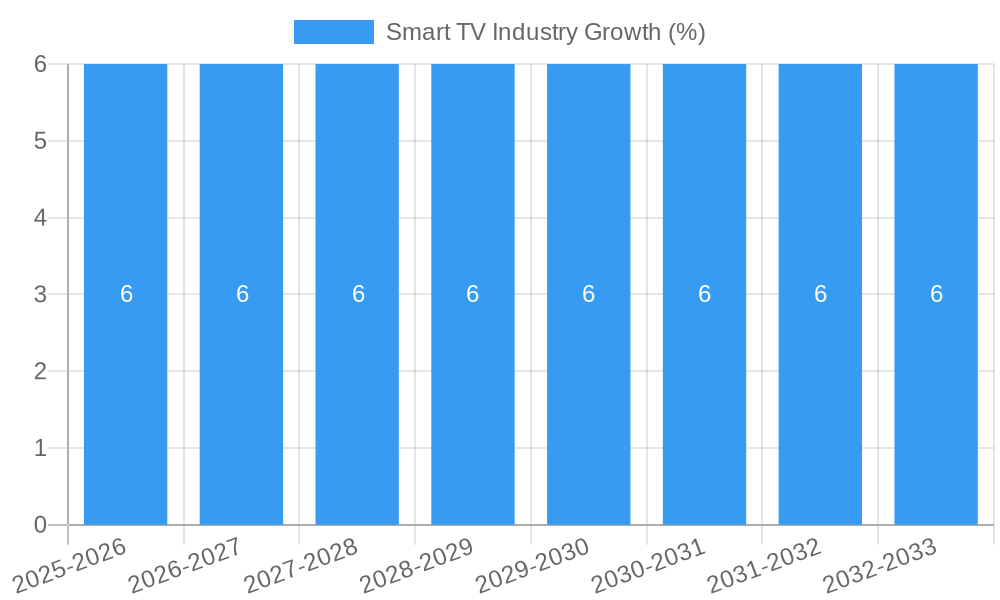
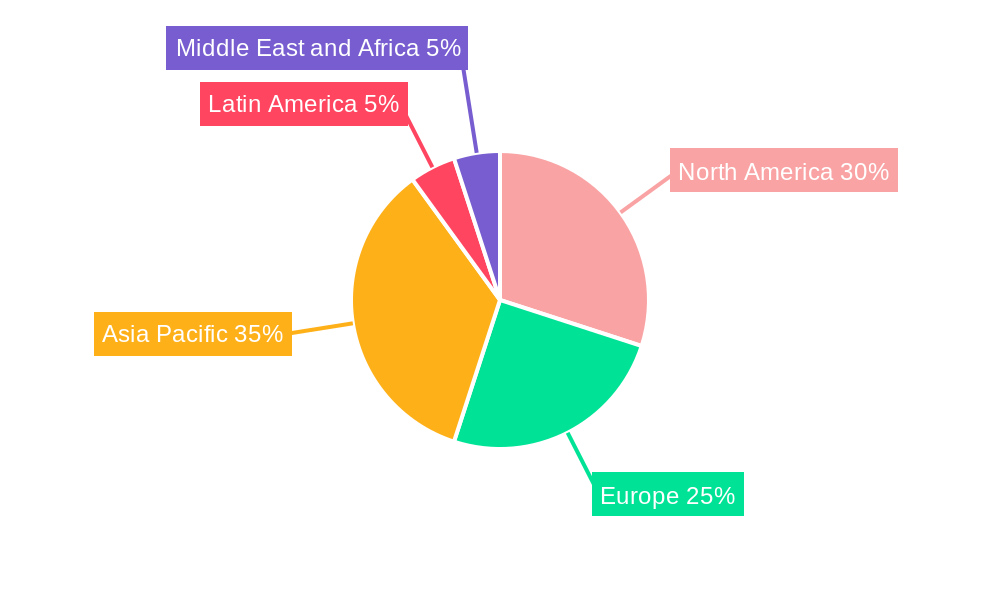
Segmentation reveals a diverse market landscape. While 4K resolution currently dominates, the emergence of 8K technology, although currently niche, represents a future growth area. Larger screen sizes (55 inches and above) are gaining traction, driven by the preference for immersive home entertainment. OLED and QLED panels are commanding premium price points, but their superior picture quality is a major driver of their growth. The competitive landscape is fiercely contested, with major players like Samsung, LG, Hisense, TCL, and Xiaomi vying for market share through technological innovation, aggressive pricing strategies, and strategic partnerships. Regional differences are also significant; the Asia-Pacific region, particularly India and Southeast Asia, is anticipated to witness substantial growth due to burgeoning middle classes and rising adoption rates. North America and Europe, while mature markets, will continue to contribute significantly to the overall market value, driven by upgrades and replacement cycles. The projected CAGR of 2.19% indicates a consistent, albeit moderate, growth trajectory over the forecast period (2025-2033).
Smart TV Industry Market Report: 2019-2033
This comprehensive report provides an in-depth analysis of the global Smart TV industry, encompassing market trends, technological advancements, leading players, and future growth prospects from 2019 to 2033. The study period covers the historical period (2019-2024), the base year (2025), and the forecast period (2025-2033), offering valuable insights for stakeholders across the value chain. With a focus on key segments (Resolution Type, Size, Panel Type) and major players like Hisense, Samsung Electronics Co Ltd, TCL, Xiaomi, and LG Electronics, this report is an essential resource for strategic decision-making. The report projects a market value exceeding xx Million by 2033.
Smart TV Industry Market Composition & Trends
This section delves into the competitive landscape of the Smart TV market, analyzing market concentration, key innovation drivers, the regulatory environment, substitute product threats, end-user profiles, and merger & acquisition (M&A) activities. The report examines the market share distribution among major players, revealing the dominance of established brands while also highlighting the emergence of new competitors. Detailed analysis of M&A activities, including deal values (xx Million), will illustrate strategic shifts within the industry.
- Market Concentration: Analysis of market share held by top 5 players, revealing the degree of competition and potential for disruption.
- Innovation Catalysts: Examination of factors driving innovation, such as advancements in display technology (OLED, QLED, MicroLED), improved processing power, and the integration of smart features (AI, voice control).
- Regulatory Landscape: Review of global and regional regulations impacting the Smart TV industry, encompassing safety standards, data privacy concerns, and trade policies.
- Substitute Products: Assessment of alternative entertainment technologies (e.g., streaming services, gaming consoles) and their potential impact on Smart TV market growth.
- End-User Profiles: Segmentation of the consumer base based on demographics, purchasing behavior, and preferences, identifying key target markets.
- M&A Activities: Analysis of recent M&A deals in the Smart TV industry, including transaction values and strategic implications for market consolidation.
Smart TV Industry Industry Evolution
This section traces the evolution of the Smart TV market, analyzing market growth trajectories, technological progress, and shifts in consumer demand from 2019 to 2033. The report will quantify growth rates (xx% CAGR) and adoption metrics for key technologies. It will explore the transition from standard definition to high-definition displays (HD/FHD, 4K, 8K), the increasing demand for larger screen sizes, and the rising popularity of premium panel technologies (OLED, QLED). The impact of evolving consumer preferences, such as increased demand for streaming capabilities and smart home integration, will also be analyzed in detail.
Leading Regions, Countries, or Segments in Smart TV Industry
This section pinpoints the dominant regions, countries, and segments within the Smart TV market. A detailed analysis of factors driving the dominance of specific regions and segments (by resolution type, size, and panel type) will be provided.
- By Resolution Type: Analysis of market share and growth for HD/FHD, 4K, and 8K Smart TVs. Key drivers will be identified for each resolution segment, including price points, technological advancements, and consumer preferences.
- By Size (inches): Market share and growth analysis for different screen sizes (39”, 48”, 55”, etc.), highlighting the drivers behind the popularity of specific screen sizes in different regions.
- By Panel Type: Detailed analysis of the market share and growth of LCD, OLED, and QLED Smart TVs. Investment trends, technological advancements, and consumer perceptions will be examined.
The report will also include a regional breakdown, identifying the leading countries in Smart TV adoption and consumption, and will highlight the factors contributing to their dominance, including economic factors, consumer trends, and government policies.
Smart TV Industry Product Innovations
This section showcases recent innovations in Smart TV technology, focusing on unique selling propositions (USPs) and technological advancements. Examples include advancements in display technology (e.g., Mini-LED, MicroLED), enhanced audio features (e.g., Dolby Atmos), improved smart features (e.g., AI-powered voice assistants), and increased integration with other smart home devices. The report will also assess the performance metrics of these innovations.
Propelling Factors for Smart TV Growth
Several key factors are driving the growth of the Smart TV industry. Technological advancements, such as the development of higher-resolution displays (4K, 8K) and the incorporation of smart features (e.g., voice control, AI), are significantly enhancing the user experience and driving adoption. Economic factors, including increasing disposable incomes in developing economies and the affordability of Smart TVs, are expanding the market's reach. Favorable regulatory policies in certain regions are also stimulating market growth.
Obstacles in the Smart TV Industry Market
The Smart TV industry faces several challenges, including regulatory hurdles (e.g., data privacy concerns), supply chain disruptions impacting component availability and production costs, and intense competitive pressure from established players and new entrants. These factors can lead to price fluctuations and impact overall market growth. The report quantifies the impact of these challenges (e.g., estimated percentage reduction in growth due to supply chain disruptions).
Future Opportunities in Smart TV Industry
The Smart TV industry presents several promising opportunities for growth. Emerging markets in developing economies offer significant untapped potential, while technological advancements, such as the development of foldable and rollable displays, and the integration of next-generation technologies (e.g., 8K resolution, HDR), will continue to drive innovation and consumer demand. New consumer trends, such as the increasing demand for personalized entertainment experiences, also present exciting opportunities for growth.
Major Players in the Smart TV Industry Ecosystem
Key Developments in Smart TV Industry
- January 2021: Hisense launched its TriChroma Laser TV, featuring enhanced color purity and brightness.
- August 2021: Xiaomi launched the Mi TV 5X series in India, expanding its presence in the region.
Strategic Smart TV Industry Market Forecast
The Smart TV industry is poised for continued growth, driven by ongoing technological advancements, expanding global markets, and increasing consumer demand for superior entertainment experiences. The market is expected to witness significant expansion in the coming years, with particular growth anticipated in emerging markets and in the adoption of premium display technologies. The forecast period (2025-2033) anticipates robust growth, driven by these factors and the ongoing integration of Smart TVs into broader smart home ecosystems.
Smart TV Industry Segmentation
-
1. Resolution Type
- 1.1. HD/FHD
- 1.2. 4K
- 1.3. 8K
-
2. Size (in inches)
- 2.1. Greater than 32
- 2.2. 39-43
- 2.3. 48-50
- 2.4. 55-60
- 2.5. Less than 65
-
3. Panel Type
- 3.1. LCD
- 3.2. OLED
- 3.3. QLED
Smart TV Industry Segmentation By Geography
- 1. North America
- 2. Europe
-
3. Asia Pacific
- 3.1. India
- 3.2. Southeast Asia
- 4. Latin America
- 5. Middle East and Africa
Smart TV Industry REPORT HIGHLIGHTS
| Aspects | Details |
|---|---|
| Study Period | 2019-2033 |
| Base Year | 2024 |
| Estimated Year | 2025 |
| Forecast Period | 2025-2033 |
| Historical Period | 2019-2024 |
| Growth Rate | CAGR of 2.19% from 2019-2033 |
| Segmentation |
|
Table of Contents
- 1. Introduction
- 1.1. Research Scope
- 1.2. Market Segmentation
- 1.3. Research Methodology
- 1.4. Definitions and Assumptions
- 2. Executive Summary
- 2.1. Introduction
- 3. Market Dynamics
- 3.1. Introduction
- 3.2. Market Drivers
- 3.2.1. Growing Disposable Income Across Emerging Economies; Rising Trend of Video-on-Demand Service
- 3.3. Market Restrains
- 3.3.1. The Need for High Investment in Content Creation and Broadcasting; Bandwidth Allocation for 4K Resolution
- 3.4. Market Trends
- 3.4.1. QLED is Expected to Witness Significant Growth
- 4. Market Factor Analysis
- 4.1. Porters Five Forces
- 4.2. Supply/Value Chain
- 4.3. PESTEL analysis
- 4.4. Market Entropy
- 4.5. Patent/Trademark Analysis
- 5. Global Smart TV Industry Analysis, Insights and Forecast, 2019-2031
- 5.1. Market Analysis, Insights and Forecast - by Resolution Type
- 5.1.1. HD/FHD
- 5.1.2. 4K
- 5.1.3. 8K
- 5.2. Market Analysis, Insights and Forecast - by Size (in inches)
- 5.2.1. Greater than 32
- 5.2.2. 39-43
- 5.2.3. 48-50
- 5.2.4. 55-60
- 5.2.5. Less than 65
- 5.3. Market Analysis, Insights and Forecast - by Panel Type
- 5.3.1. LCD
- 5.3.2. OLED
- 5.3.3. QLED
- 5.4. Market Analysis, Insights and Forecast - by Region
- 5.4.1. North America
- 5.4.2. Europe
- 5.4.3. Asia Pacific
- 5.4.4. Latin America
- 5.4.5. Middle East and Africa
- 5.1. Market Analysis, Insights and Forecast - by Resolution Type
- 6. North America Smart TV Industry Analysis, Insights and Forecast, 2019-2031
- 6.1. Market Analysis, Insights and Forecast - by Resolution Type
- 6.1.1. HD/FHD
- 6.1.2. 4K
- 6.1.3. 8K
- 6.2. Market Analysis, Insights and Forecast - by Size (in inches)
- 6.2.1. Greater than 32
- 6.2.2. 39-43
- 6.2.3. 48-50
- 6.2.4. 55-60
- 6.2.5. Less than 65
- 6.3. Market Analysis, Insights and Forecast - by Panel Type
- 6.3.1. LCD
- 6.3.2. OLED
- 6.3.3. QLED
- 6.1. Market Analysis, Insights and Forecast - by Resolution Type
- 7. Europe Smart TV Industry Analysis, Insights and Forecast, 2019-2031
- 7.1. Market Analysis, Insights and Forecast - by Resolution Type
- 7.1.1. HD/FHD
- 7.1.2. 4K
- 7.1.3. 8K
- 7.2. Market Analysis, Insights and Forecast - by Size (in inches)
- 7.2.1. Greater than 32
- 7.2.2. 39-43
- 7.2.3. 48-50
- 7.2.4. 55-60
- 7.2.5. Less than 65
- 7.3. Market Analysis, Insights and Forecast - by Panel Type
- 7.3.1. LCD
- 7.3.2. OLED
- 7.3.3. QLED
- 7.1. Market Analysis, Insights and Forecast - by Resolution Type
- 8. Asia Pacific Smart TV Industry Analysis, Insights and Forecast, 2019-2031
- 8.1. Market Analysis, Insights and Forecast - by Resolution Type
- 8.1.1. HD/FHD
- 8.1.2. 4K
- 8.1.3. 8K
- 8.2. Market Analysis, Insights and Forecast - by Size (in inches)
- 8.2.1. Greater than 32
- 8.2.2. 39-43
- 8.2.3. 48-50
- 8.2.4. 55-60
- 8.2.5. Less than 65
- 8.3. Market Analysis, Insights and Forecast - by Panel Type
- 8.3.1. LCD
- 8.3.2. OLED
- 8.3.3. QLED
- 8.1. Market Analysis, Insights and Forecast - by Resolution Type
- 9. Latin America Smart TV Industry Analysis, Insights and Forecast, 2019-2031
- 9.1. Market Analysis, Insights and Forecast - by Resolution Type
- 9.1.1. HD/FHD
- 9.1.2. 4K
- 9.1.3. 8K
- 9.2. Market Analysis, Insights and Forecast - by Size (in inches)
- 9.2.1. Greater than 32
- 9.2.2. 39-43
- 9.2.3. 48-50
- 9.2.4. 55-60
- 9.2.5. Less than 65
- 9.3. Market Analysis, Insights and Forecast - by Panel Type
- 9.3.1. LCD
- 9.3.2. OLED
- 9.3.3. QLED
- 9.1. Market Analysis, Insights and Forecast - by Resolution Type
- 10. Middle East and Africa Smart TV Industry Analysis, Insights and Forecast, 2019-2031
- 10.1. Market Analysis, Insights and Forecast - by Resolution Type
- 10.1.1. HD/FHD
- 10.1.2. 4K
- 10.1.3. 8K
- 10.2. Market Analysis, Insights and Forecast - by Size (in inches)
- 10.2.1. Greater than 32
- 10.2.2. 39-43
- 10.2.3. 48-50
- 10.2.4. 55-60
- 10.2.5. Less than 65
- 10.3. Market Analysis, Insights and Forecast - by Panel Type
- 10.3.1. LCD
- 10.3.2. OLED
- 10.3.3. QLED
- 10.1. Market Analysis, Insights and Forecast - by Resolution Type
- 11. North America Smart TV Industry Analysis, Insights and Forecast, 2019-2031
- 11.1. Market Analysis, Insights and Forecast - By Country/Sub-region
- 11.1.1.
- 12. Europe Smart TV Industry Analysis, Insights and Forecast, 2019-2031
- 12.1. Market Analysis, Insights and Forecast - By Country/Sub-region
- 12.1.1.
- 13. Asia Pacific Smart TV Industry Analysis, Insights and Forecast, 2019-2031
- 13.1. Market Analysis, Insights and Forecast - By Country/Sub-region
- 13.1.1 India
- 13.1.2 Southeast Asia
- 14. Latin America Smart TV Industry Analysis, Insights and Forecast, 2019-2031
- 14.1. Market Analysis, Insights and Forecast - By Country/Sub-region
- 14.1.1.
- 15. Middle East and Africa Smart TV Industry Analysis, Insights and Forecast, 2019-2031
- 15.1. Market Analysis, Insights and Forecast - By Country/Sub-region
- 15.1.1.
- 16. Competitive Analysis
- 16.1. Global Market Share Analysis 2024
- 16.2. Company Profiles
- 16.2.1 Hisense
- 16.2.1.1. Overview
- 16.2.1.2. Products
- 16.2.1.3. SWOT Analysis
- 16.2.1.4. Recent Developments
- 16.2.1.5. Financials (Based on Availability)
- 16.2.2 Samsung Electronics Co Ltd
- 16.2.2.1. Overview
- 16.2.2.2. Products
- 16.2.2.3. SWOT Analysis
- 16.2.2.4. Recent Developments
- 16.2.2.5. Financials (Based on Availability)
- 16.2.3 TCL
- 16.2.3.1. Overview
- 16.2.3.2. Products
- 16.2.3.3. SWOT Analysis
- 16.2.3.4. Recent Developments
- 16.2.3.5. Financials (Based on Availability)
- 16.2.4 Xiaomi*List Not Exhaustive
- 16.2.4.1. Overview
- 16.2.4.2. Products
- 16.2.4.3. SWOT Analysis
- 16.2.4.4. Recent Developments
- 16.2.4.5. Financials (Based on Availability)
- 16.2.5 LG Electronics
- 16.2.5.1. Overview
- 16.2.5.2. Products
- 16.2.5.3. SWOT Analysis
- 16.2.5.4. Recent Developments
- 16.2.5.5. Financials (Based on Availability)
- 16.2.1 Hisense
List of Figures
- Figure 1: Global Smart TV Industry Revenue Breakdown (Million, %) by Region 2024 & 2032
- Figure 2: North America Smart TV Industry Revenue (Million), by Country 2024 & 2032
- Figure 3: North America Smart TV Industry Revenue Share (%), by Country 2024 & 2032
- Figure 4: Europe Smart TV Industry Revenue (Million), by Country 2024 & 2032
- Figure 5: Europe Smart TV Industry Revenue Share (%), by Country 2024 & 2032
- Figure 6: Asia Pacific Smart TV Industry Revenue (Million), by Country 2024 & 2032
- Figure 7: Asia Pacific Smart TV Industry Revenue Share (%), by Country 2024 & 2032
- Figure 8: Latin America Smart TV Industry Revenue (Million), by Country 2024 & 2032
- Figure 9: Latin America Smart TV Industry Revenue Share (%), by Country 2024 & 2032
- Figure 10: Middle East and Africa Smart TV Industry Revenue (Million), by Country 2024 & 2032
- Figure 11: Middle East and Africa Smart TV Industry Revenue Share (%), by Country 2024 & 2032
- Figure 12: North America Smart TV Industry Revenue (Million), by Resolution Type 2024 & 2032
- Figure 13: North America Smart TV Industry Revenue Share (%), by Resolution Type 2024 & 2032
- Figure 14: North America Smart TV Industry Revenue (Million), by Size (in inches) 2024 & 2032
- Figure 15: North America Smart TV Industry Revenue Share (%), by Size (in inches) 2024 & 2032
- Figure 16: North America Smart TV Industry Revenue (Million), by Panel Type 2024 & 2032
- Figure 17: North America Smart TV Industry Revenue Share (%), by Panel Type 2024 & 2032
- Figure 18: North America Smart TV Industry Revenue (Million), by Country 2024 & 2032
- Figure 19: North America Smart TV Industry Revenue Share (%), by Country 2024 & 2032
- Figure 20: Europe Smart TV Industry Revenue (Million), by Resolution Type 2024 & 2032
- Figure 21: Europe Smart TV Industry Revenue Share (%), by Resolution Type 2024 & 2032
- Figure 22: Europe Smart TV Industry Revenue (Million), by Size (in inches) 2024 & 2032
- Figure 23: Europe Smart TV Industry Revenue Share (%), by Size (in inches) 2024 & 2032
- Figure 24: Europe Smart TV Industry Revenue (Million), by Panel Type 2024 & 2032
- Figure 25: Europe Smart TV Industry Revenue Share (%), by Panel Type 2024 & 2032
- Figure 26: Europe Smart TV Industry Revenue (Million), by Country 2024 & 2032
- Figure 27: Europe Smart TV Industry Revenue Share (%), by Country 2024 & 2032
- Figure 28: Asia Pacific Smart TV Industry Revenue (Million), by Resolution Type 2024 & 2032
- Figure 29: Asia Pacific Smart TV Industry Revenue Share (%), by Resolution Type 2024 & 2032
- Figure 30: Asia Pacific Smart TV Industry Revenue (Million), by Size (in inches) 2024 & 2032
- Figure 31: Asia Pacific Smart TV Industry Revenue Share (%), by Size (in inches) 2024 & 2032
- Figure 32: Asia Pacific Smart TV Industry Revenue (Million), by Panel Type 2024 & 2032
- Figure 33: Asia Pacific Smart TV Industry Revenue Share (%), by Panel Type 2024 & 2032
- Figure 34: Asia Pacific Smart TV Industry Revenue (Million), by Country 2024 & 2032
- Figure 35: Asia Pacific Smart TV Industry Revenue Share (%), by Country 2024 & 2032
- Figure 36: Latin America Smart TV Industry Revenue (Million), by Resolution Type 2024 & 2032
- Figure 37: Latin America Smart TV Industry Revenue Share (%), by Resolution Type 2024 & 2032
- Figure 38: Latin America Smart TV Industry Revenue (Million), by Size (in inches) 2024 & 2032
- Figure 39: Latin America Smart TV Industry Revenue Share (%), by Size (in inches) 2024 & 2032
- Figure 40: Latin America Smart TV Industry Revenue (Million), by Panel Type 2024 & 2032
- Figure 41: Latin America Smart TV Industry Revenue Share (%), by Panel Type 2024 & 2032
- Figure 42: Latin America Smart TV Industry Revenue (Million), by Country 2024 & 2032
- Figure 43: Latin America Smart TV Industry Revenue Share (%), by Country 2024 & 2032
- Figure 44: Middle East and Africa Smart TV Industry Revenue (Million), by Resolution Type 2024 & 2032
- Figure 45: Middle East and Africa Smart TV Industry Revenue Share (%), by Resolution Type 2024 & 2032
- Figure 46: Middle East and Africa Smart TV Industry Revenue (Million), by Size (in inches) 2024 & 2032
- Figure 47: Middle East and Africa Smart TV Industry Revenue Share (%), by Size (in inches) 2024 & 2032
- Figure 48: Middle East and Africa Smart TV Industry Revenue (Million), by Panel Type 2024 & 2032
- Figure 49: Middle East and Africa Smart TV Industry Revenue Share (%), by Panel Type 2024 & 2032
- Figure 50: Middle East and Africa Smart TV Industry Revenue (Million), by Country 2024 & 2032
- Figure 51: Middle East and Africa Smart TV Industry Revenue Share (%), by Country 2024 & 2032
List of Tables
- Table 1: Global Smart TV Industry Revenue Million Forecast, by Region 2019 & 2032
- Table 2: Global Smart TV Industry Revenue Million Forecast, by Resolution Type 2019 & 2032
- Table 3: Global Smart TV Industry Revenue Million Forecast, by Size (in inches) 2019 & 2032
- Table 4: Global Smart TV Industry Revenue Million Forecast, by Panel Type 2019 & 2032
- Table 5: Global Smart TV Industry Revenue Million Forecast, by Region 2019 & 2032
- Table 6: Global Smart TV Industry Revenue Million Forecast, by Country 2019 & 2032
- Table 7: Smart TV Industry Revenue (Million) Forecast, by Application 2019 & 2032
- Table 8: Global Smart TV Industry Revenue Million Forecast, by Country 2019 & 2032
- Table 9: Smart TV Industry Revenue (Million) Forecast, by Application 2019 & 2032
- Table 10: Global Smart TV Industry Revenue Million Forecast, by Country 2019 & 2032
- Table 11: India Smart TV Industry Revenue (Million) Forecast, by Application 2019 & 2032
- Table 12: Southeast Asia Smart TV Industry Revenue (Million) Forecast, by Application 2019 & 2032
- Table 13: Global Smart TV Industry Revenue Million Forecast, by Country 2019 & 2032
- Table 14: Smart TV Industry Revenue (Million) Forecast, by Application 2019 & 2032
- Table 15: Global Smart TV Industry Revenue Million Forecast, by Country 2019 & 2032
- Table 16: Smart TV Industry Revenue (Million) Forecast, by Application 2019 & 2032
- Table 17: Global Smart TV Industry Revenue Million Forecast, by Resolution Type 2019 & 2032
- Table 18: Global Smart TV Industry Revenue Million Forecast, by Size (in inches) 2019 & 2032
- Table 19: Global Smart TV Industry Revenue Million Forecast, by Panel Type 2019 & 2032
- Table 20: Global Smart TV Industry Revenue Million Forecast, by Country 2019 & 2032
- Table 21: Global Smart TV Industry Revenue Million Forecast, by Resolution Type 2019 & 2032
- Table 22: Global Smart TV Industry Revenue Million Forecast, by Size (in inches) 2019 & 2032
- Table 23: Global Smart TV Industry Revenue Million Forecast, by Panel Type 2019 & 2032
- Table 24: Global Smart TV Industry Revenue Million Forecast, by Country 2019 & 2032
- Table 25: Global Smart TV Industry Revenue Million Forecast, by Resolution Type 2019 & 2032
- Table 26: Global Smart TV Industry Revenue Million Forecast, by Size (in inches) 2019 & 2032
- Table 27: Global Smart TV Industry Revenue Million Forecast, by Panel Type 2019 & 2032
- Table 28: Global Smart TV Industry Revenue Million Forecast, by Country 2019 & 2032
- Table 29: India Smart TV Industry Revenue (Million) Forecast, by Application 2019 & 2032
- Table 30: Southeast Asia Smart TV Industry Revenue (Million) Forecast, by Application 2019 & 2032
- Table 31: Global Smart TV Industry Revenue Million Forecast, by Resolution Type 2019 & 2032
- Table 32: Global Smart TV Industry Revenue Million Forecast, by Size (in inches) 2019 & 2032
- Table 33: Global Smart TV Industry Revenue Million Forecast, by Panel Type 2019 & 2032
- Table 34: Global Smart TV Industry Revenue Million Forecast, by Country 2019 & 2032
- Table 35: Global Smart TV Industry Revenue Million Forecast, by Resolution Type 2019 & 2032
- Table 36: Global Smart TV Industry Revenue Million Forecast, by Size (in inches) 2019 & 2032
- Table 37: Global Smart TV Industry Revenue Million Forecast, by Panel Type 2019 & 2032
- Table 38: Global Smart TV Industry Revenue Million Forecast, by Country 2019 & 2032
Frequently Asked Questions
1. What is the projected Compound Annual Growth Rate (CAGR) of the Smart TV Industry?
The projected CAGR is approximately 2.19%.
2. Which companies are prominent players in the Smart TV Industry?
Key companies in the market include Hisense, Samsung Electronics Co Ltd, TCL, Xiaomi*List Not Exhaustive, LG Electronics.
3. What are the main segments of the Smart TV Industry?
The market segments include Resolution Type, Size (in inches), Panel Type.
4. Can you provide details about the market size?
The market size is estimated to be USD 275.69 Million as of 2022.
5. What are some drivers contributing to market growth?
Growing Disposable Income Across Emerging Economies; Rising Trend of Video-on-Demand Service.
6. What are the notable trends driving market growth?
QLED is Expected to Witness Significant Growth.
7. Are there any restraints impacting market growth?
The Need for High Investment in Content Creation and Broadcasting; Bandwidth Allocation for 4K Resolution.
8. Can you provide examples of recent developments in the market?
January 2021 - Hisense launched a new product line of laser TV, TriChroma Laser TV, using its cutting-edge display technology. The laser TV will control and package separate lasers to get purer colors for display. TriChroma will have 20% brightness enhancement at the pixel level with a 430-nit picture brightness. The new TV product line will be offered in various screen sizes, including 75-inch to 100-inch giant screens. The company also aims to provide its customers with customized solutions, home fitness screens, and various professional options for different industries.
9. What pricing options are available for accessing the report?
Pricing options include single-user, multi-user, and enterprise licenses priced at USD 4750, USD 5250, and USD 8750 respectively.
10. Is the market size provided in terms of value or volume?
The market size is provided in terms of value, measured in Million.
11. Are there any specific market keywords associated with the report?
Yes, the market keyword associated with the report is "Smart TV Industry," which aids in identifying and referencing the specific market segment covered.
12. How do I determine which pricing option suits my needs best?
The pricing options vary based on user requirements and access needs. Individual users may opt for single-user licenses, while businesses requiring broader access may choose multi-user or enterprise licenses for cost-effective access to the report.
13. Are there any additional resources or data provided in the Smart TV Industry report?
While the report offers comprehensive insights, it's advisable to review the specific contents or supplementary materials provided to ascertain if additional resources or data are available.
14. How can I stay updated on further developments or reports in the Smart TV Industry?
To stay informed about further developments, trends, and reports in the Smart TV Industry, consider subscribing to industry newsletters, following relevant companies and organizations, or regularly checking reputable industry news sources and publications.
Methodology
Step 1 - Identification of Relevant Samples Size from Population Database


Step 2 - Approaches for Defining Global Market Size (Value, Volume* & Price*)

Note*: In applicable scenarios
Step 3 - Data Sources
Primary Research
- Web Analytics
- Survey Reports
- Research Institute
- Latest Research Reports
- Opinion Leaders
Secondary Research
- Annual Reports
- White Paper
- Latest Press Release
- Industry Association
- Paid Database
- Investor Presentations

Step 4 - Data Triangulation
Involves using different sources of information in order to increase the validity of a study
These sources are likely to be stakeholders in a program - participants, other researchers, program staff, other community members, and so on.
Then we put all data in single framework & apply various statistical tools to find out the dynamic on the market.
During the analysis stage, feedback from the stakeholder groups would be compared to determine areas of agreement as well as areas of divergence
