

Key Insights
The U.S. smart home market is experiencing robust growth, projected to reach a substantial size driven by increasing consumer adoption of smart devices and the integration of home automation systems. The market's compound annual growth rate (CAGR) of 9.12% from 2019 to 2024 indicates a strong upward trajectory, expected to continue through 2033. Key drivers include rising disposable incomes, increased awareness of home security concerns, the convenience offered by automated systems, and advancements in technologies like AI and IoT. Growth is fueled by diverse segments, including comfort and lighting, control and connectivity, energy management, home entertainment, security systems, and smart appliances. The prominence of leading technology companies like Google, Amazon, and Apple in this space further accelerates innovation and market penetration. The North American market, particularly the United States, holds a significant share, benefiting from a higher level of technological adoption and a well-established infrastructure. While data privacy concerns and the initial cost of implementation might act as restraints, the long-term benefits in terms of convenience, energy savings, and security are expected to outweigh these factors. The increasing availability of affordable smart home devices and user-friendly interfaces is also a critical factor driving broader market acceptance.
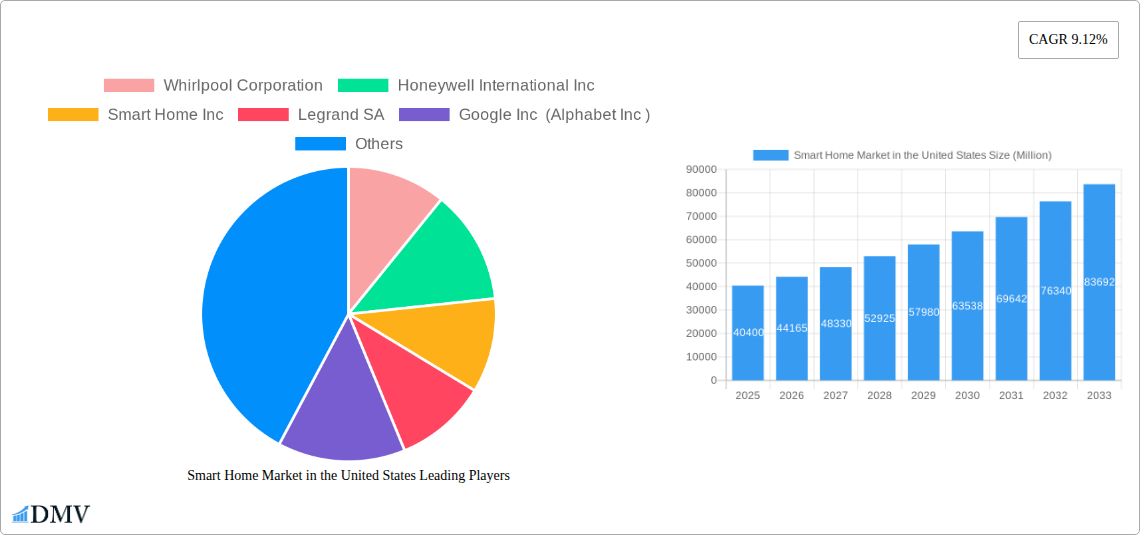
Further analysis suggests that the diverse product segments contribute differentially to market expansion. Security systems, driven by heightened security concerns and advanced technology integration, are likely to experience particularly strong growth. Energy management solutions are expected to see increased demand due to rising energy costs and a growing focus on sustainability. Meanwhile, the home entertainment segment, encompassing smart TVs and audio systems, will likely maintain steady growth, driven by consumer preference for enhanced home entertainment experiences. The continued integration of these segments into comprehensive smart home ecosystems underscores the interconnected nature of this burgeoning market, promoting the adoption of holistic solutions across various aspects of home living. The dominance of established players like Whirlpool, Honeywell, and Legrand, alongside tech giants like Google and Amazon, ensures a competitive landscape that fuels innovation and provides a wide array of options for consumers. This continuous innovation is likely to be a key driver for market expansion in the coming years.
Smart Home Market in the United States: A Comprehensive Report (2019-2033)
This insightful report provides a detailed analysis of the burgeoning Smart Home Market in the United States, offering a comprehensive overview of market dynamics, key players, and future growth projections. The study period spans from 2019 to 2033, with 2025 serving as the base and estimated year. This report is invaluable for stakeholders seeking to understand and capitalize on the significant opportunities within this rapidly evolving sector. The US smart home market is projected to reach xx Million by 2033, driven by technological advancements and increasing consumer adoption.
Smart Home Market in the United States Market Composition & Trends
The US smart home market exhibits a moderately concentrated landscape, with key players like Whirlpool Corporation, Honeywell International Inc, Google Inc (Alphabet Inc), and LG Electronics Inc holding significant market share. However, the market is also characterized by a dynamic competitive environment with numerous smaller players and continuous innovation. Market share distribution among the top 5 players is estimated at 45% in 2025. The overall market value in 2025 is estimated to be xx Million.
Innovation Catalysts: The market is driven by advancements in AI, IoT, and 5G technology, enabling seamless integration and enhanced functionality of smart home devices. The Matter standard, fostering interoperability between devices, significantly boosts innovation.
Regulatory Landscape: While largely unregulated, emerging privacy and data security concerns are shaping the regulatory environment, impacting product development and consumer adoption.
Substitute Products: Traditional home automation systems and individual standalone devices present some degree of substitution, although the integrated nature of smart home ecosystems offers significant advantages.
End-User Profiles: The market caters to a wide range of consumers, from tech-savvy early adopters to budget-conscious users seeking basic smart functionalities. Millennials and Gen Z represent significant consumer segments.
M&A Activities: The past five years have witnessed several significant M&A activities in the smart home sector, with deal values exceeding xx Million in aggregate. These strategic acquisitions reflect the consolidation trend and the increasing importance of scaling up operations and technology integration. Key acquisitions include (examples only, specific data not provided): Company A acquiring Company B for xx Million in 2023 and Company C merging with Company D resulting in a valuation of xx Million.
Smart Home Market in the United States Industry Evolution
The US smart home market has experienced robust growth from 2019-2024, with a compound annual growth rate (CAGR) of xx%. This growth trajectory is projected to continue through 2033, driven by several factors:
- Technological Advancements: The continuous innovation in areas like AI, machine learning, and IoT is enhancing the capabilities and user experience of smart home systems. Voice assistants, advanced security features, and energy-efficient solutions are major growth drivers.
- Rising Consumer Adoption: Increasing consumer awareness about the benefits of smart homes, such as convenience, energy efficiency, and enhanced security, is fueling demand. Smart home adoption rates are projected to increase by xx% annually until 2033, with significant growth concentrated among younger demographics.
- Decreasing Costs: The cost of smart home devices has been steadily declining, making them more accessible to a broader range of consumers. Economies of scale in manufacturing and competition in the market are pushing prices down.
- Improved Interoperability: The emergence of standards like Matter is addressing the long-standing issue of interoperability between different smart home devices and ecosystems, thereby enhancing user experience and stimulating market expansion.
The market is segmented by product type, including Comfort and Lighting, Control and Connectivity, Energy Management, Home Entertainment, Security, and Smart Appliances. Each segment shows varying growth rates depending on the technological and consumer adoption advancements. For example, the Security segment is anticipated to grow faster than the Comfort and Lighting sector due to increasing concerns about home safety and security.
Leading Regions, Countries, or Segments in Smart Home Market in the United States
Dominant Segment: The Comfort and Lighting segment holds the largest market share, driven by high consumer demand for smart lighting solutions and smart thermostats.
Key Drivers for Dominance:
- High Consumer Adoption: Smart lighting and climate control offer immediate convenience and tangible energy savings, driving widespread adoption.
- Extensive Product Availability: The market offers a wide range of smart lighting and climate control options from different vendors, catering to diverse preferences and budgets.
- Ease of Installation: Many smart lighting and thermostat systems are designed for relatively easy installation, reducing the barrier to entry for consumers.
Detailed Analysis: The dominance of the Comfort and Lighting segment is further reinforced by factors such as increasing energy costs, rising awareness about energy conservation, and the availability of increasingly sophisticated, user-friendly smart devices. The segment also benefits from economies of scale, resulting in lower prices, making the technology more accessible to a wider market segment. The integration of AI and machine learning further enhances this segment by optimizing energy consumption and personalizing user experience.
Smart Home Market in the United States Product Innovations
Recent years have witnessed a surge in innovative smart home products, including enhanced voice assistants with more natural language processing, AI-powered security systems with advanced threat detection, and energy-efficient appliances that can learn user patterns and optimize energy consumption. These innovations are marked by enhanced interoperability, improved user interfaces, and a focus on creating seamless and personalized experiences. Key differentiators include voice control, mobile app integration, and integration with other smart devices within the ecosystem.
Propelling Factors for Smart Home Market in the United States Growth
Several factors fuel the growth of the US smart home market:
- Technological Advancements: The continuous development of AI, IoT, and 5G connectivity enables greater functionality, interoperability, and user-friendliness.
- Rising Disposable Incomes: Increased disposable incomes allow more consumers to invest in smart home technology.
- Government Initiatives: Government incentives and regulations promoting energy efficiency further encourage smart home adoption. Examples include tax credits or rebates for energy-efficient smart appliances.
Obstacles in the Smart Home Market in the United States Market
Challenges hindering market growth include:
- High Initial Investment Costs: The initial investment for implementing a comprehensive smart home system can be significant, limiting adoption among budget-conscious consumers.
- Cybersecurity Concerns: Data breaches and hacking risks associated with connected devices pose a significant obstacle, especially in a largely unregulated landscape. Concerns over data privacy further hinder user confidence.
- Complexity of Setup and Use: Some smart home systems can be complex to set up and use, potentially discouraging adoption among less tech-savvy consumers.
Future Opportunities in Smart Home Market in the United States
Future opportunities lie in expanding into underserved markets, particularly among older demographics, and developing more affordable, user-friendly products. The integration of smart home technology with healthcare applications, such as remote patient monitoring and assisted living solutions, is also a promising area of growth.
Major Players in the Smart Home Market in the United States Ecosystem
- Whirlpool Corporation
- Honeywell International Inc
- Smart Home Inc
- Legrand SA
- Google Inc (Alphabet Inc)
- LG Electronics Inc
- Savant Systems Inc (GE Lighting)
- Emerson Electric Co
- Cisco Systems Inc
- Lutron Electronics Co Inc
- Siemens AG
- Microsoft Corporation
- Schneider Electric SE
- Control4 Corporation
- ABB Limited
- GE Appliances (Haier Group)
Key Developments in Smart Home Market in the United States Industry
- October 2022: Roku Inc. launched a new line of smart home products, expanding its ecosystem and increasing competition in the affordable smart home market.
- October 2022: Google's Nest introduced a redesigned Google Home app and new hardware, enhancing user experience and strengthening its position in the market.
- November 2022: The Matter standard's rollout and Amazon's WWA certification are expected to improve interoperability and standardization among smart home devices, driving overall market growth.
Strategic Smart Home Market in the United States Market Forecast
The US smart home market is poised for continued robust growth, driven by technological innovation, increasing consumer adoption, and the rising need for energy efficiency and enhanced security. The convergence of AI, IoT, and 5G technologies will unlock new possibilities and create more integrated, user-friendly smart home ecosystems. The continued expansion of the market will be further propelled by the resolution of interoperability challenges and government support.
Smart Home Market in the United States Segmentation
-
1. Product Type
- 1.1. Comfort and Lighting
- 1.2. Control and Connectivity
- 1.3. Energy Management
- 1.4. Home Entertainment
- 1.5. Security
- 1.6. Smart Appliances
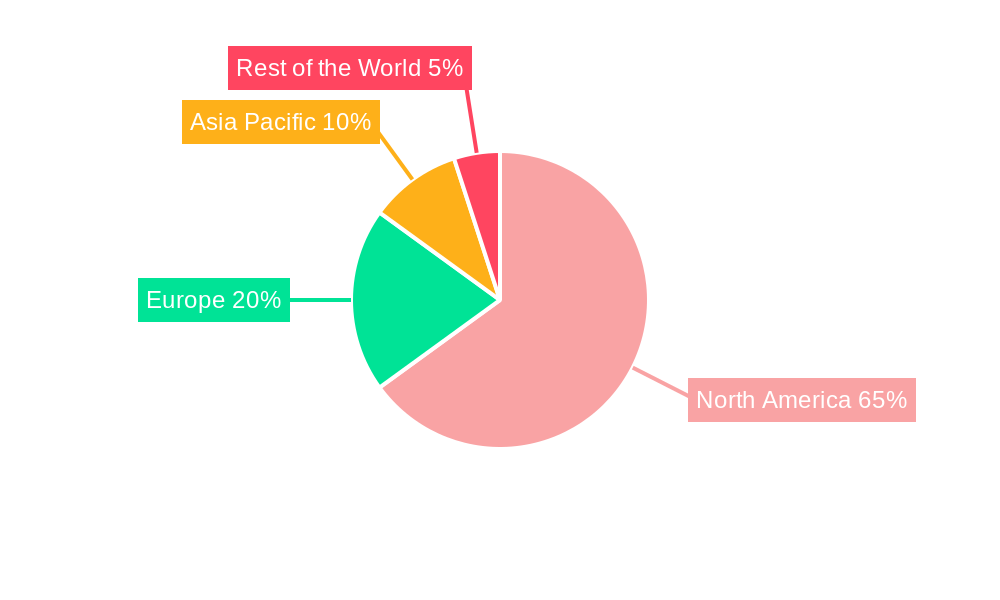
Smart Home Market in the United States Segmentation By Geography
-
1. North America
- 1.1. United States
- 1.2. Canada
- 1.3. Mexico
-
2. South America
- 2.1. Brazil
- 2.2. Argentina
- 2.3. Rest of South America
-
3. Europe
- 3.1. United Kingdom
- 3.2. Germany
- 3.3. France
- 3.4. Italy
- 3.5. Spain
- 3.6. Russia
- 3.7. Benelux
- 3.8. Nordics
- 3.9. Rest of Europe
-
4. Middle East & Africa
- 4.1. Turkey
- 4.2. Israel
- 4.3. GCC
- 4.4. North Africa
- 4.5. South Africa
- 4.6. Rest of Middle East & Africa
-
5. Asia Pacific
- 5.1. China
- 5.2. India
- 5.3. Japan
- 5.4. South Korea
- 5.5. ASEAN
- 5.6. Oceania
- 5.7. Rest of Asia Pacific
Smart Home Market in the United States REPORT HIGHLIGHTS
| Aspects | Details |
|---|---|
| Study Period | 2019-2033 |
| Base Year | 2024 |
| Estimated Year | 2025 |
| Forecast Period | 2025-2033 |
| Historical Period | 2019-2024 |
| Growth Rate | CAGR of 9.12% from 2019-2033 |
| Segmentation |
|
Table of Contents
- 1. Introduction
- 1.1. Research Scope
- 1.2. Market Segmentation
- 1.3. Research Methodology
- 1.4. Definitions and Assumptions
- 2. Executive Summary
- 2.1. Introduction
- 3. Market Dynamics
- 3.1. Introduction
- 3.2. Market Drivers
- 3.2.1. Increasing Demand for Energy-efficient Solutions; Growing Need for Automation of Security Systems
- 3.3. Market Restrains
- 3.3.1 High Installation and Replacement Costs
- 3.3.2 along with Privacy Concerns
- 3.4. Market Trends
- 3.4.1. Smart Appliances Accounted for the Highest Market Share
- 4. Market Factor Analysis
- 4.1. Porters Five Forces
- 4.2. Supply/Value Chain
- 4.3. PESTEL analysis
- 4.4. Market Entropy
- 4.5. Patent/Trademark Analysis
- 5. Global Smart Home Market in the United States Analysis, Insights and Forecast, 2019-2031
- 5.1. Market Analysis, Insights and Forecast - by Product Type
- 5.1.1. Comfort and Lighting
- 5.1.2. Control and Connectivity
- 5.1.3. Energy Management
- 5.1.4. Home Entertainment
- 5.1.5. Security
- 5.1.6. Smart Appliances
- 5.2. Market Analysis, Insights and Forecast - by Region
- 5.2.1. North America
- 5.2.2. South America
- 5.2.3. Europe
- 5.2.4. Middle East & Africa
- 5.2.5. Asia Pacific
- 5.1. Market Analysis, Insights and Forecast - by Product Type
- 6. North America Smart Home Market in the United States Analysis, Insights and Forecast, 2019-2031
- 6.1. Market Analysis, Insights and Forecast - by Product Type
- 6.1.1. Comfort and Lighting
- 6.1.2. Control and Connectivity
- 6.1.3. Energy Management
- 6.1.4. Home Entertainment
- 6.1.5. Security
- 6.1.6. Smart Appliances
- 6.1. Market Analysis, Insights and Forecast - by Product Type
- 7. South America Smart Home Market in the United States Analysis, Insights and Forecast, 2019-2031
- 7.1. Market Analysis, Insights and Forecast - by Product Type
- 7.1.1. Comfort and Lighting
- 7.1.2. Control and Connectivity
- 7.1.3. Energy Management
- 7.1.4. Home Entertainment
- 7.1.5. Security
- 7.1.6. Smart Appliances
- 7.1. Market Analysis, Insights and Forecast - by Product Type
- 8. Europe Smart Home Market in the United States Analysis, Insights and Forecast, 2019-2031
- 8.1. Market Analysis, Insights and Forecast - by Product Type
- 8.1.1. Comfort and Lighting
- 8.1.2. Control and Connectivity
- 8.1.3. Energy Management
- 8.1.4. Home Entertainment
- 8.1.5. Security
- 8.1.6. Smart Appliances
- 8.1. Market Analysis, Insights and Forecast - by Product Type
- 9. Middle East & Africa Smart Home Market in the United States Analysis, Insights and Forecast, 2019-2031
- 9.1. Market Analysis, Insights and Forecast - by Product Type
- 9.1.1. Comfort and Lighting
- 9.1.2. Control and Connectivity
- 9.1.3. Energy Management
- 9.1.4. Home Entertainment
- 9.1.5. Security
- 9.1.6. Smart Appliances
- 9.1. Market Analysis, Insights and Forecast - by Product Type
- 10. Asia Pacific Smart Home Market in the United States Analysis, Insights and Forecast, 2019-2031
- 10.1. Market Analysis, Insights and Forecast - by Product Type
- 10.1.1. Comfort and Lighting
- 10.1.2. Control and Connectivity
- 10.1.3. Energy Management
- 10.1.4. Home Entertainment
- 10.1.5. Security
- 10.1.6. Smart Appliances
- 10.1. Market Analysis, Insights and Forecast - by Product Type
- 11. North America Smart Home Market in the United States Analysis, Insights and Forecast, 2019-2031
- 11.1. Market Analysis, Insights and Forecast - By Country/Sub-region
- 11.1.1. undefined
- 12. Europe Smart Home Market in the United States Analysis, Insights and Forecast, 2019-2031
- 12.1. Market Analysis, Insights and Forecast - By Country/Sub-region
- 12.1.1. undefined
- 13. Asia Pacific Smart Home Market in the United States Analysis, Insights and Forecast, 2019-2031
- 13.1. Market Analysis, Insights and Forecast - By Country/Sub-region
- 13.1.1. undefined
- 14. Rest of the World Smart Home Market in the United States Analysis, Insights and Forecast, 2019-2031
- 14.1. Market Analysis, Insights and Forecast - By Country/Sub-region
- 14.1.1. undefined
- 15. United States Smart Home Market in the United States Analysis, Insights and Forecast, 2019-2031
- 15.1. Market Analysis, Insights and Forecast - By Country/Sub-region
- 15.1.1. undefined
- 16. Competitive Analysis
- 16.1. Global Market Share Analysis 2024
- 16.2. Company Profiles
- 16.2.1 Whirlpool Corporation
- 16.2.1.1. Overview
- 16.2.1.2. Products
- 16.2.1.3. SWOT Analysis
- 16.2.1.4. Recent Developments
- 16.2.1.5. Financials (Based on Availability)
- 16.2.2 Honeywell International Inc
- 16.2.2.1. Overview
- 16.2.2.2. Products
- 16.2.2.3. SWOT Analysis
- 16.2.2.4. Recent Developments
- 16.2.2.5. Financials (Based on Availability)
- 16.2.3 Smart Home Inc
- 16.2.3.1. Overview
- 16.2.3.2. Products
- 16.2.3.3. SWOT Analysis
- 16.2.3.4. Recent Developments
- 16.2.3.5. Financials (Based on Availability)
- 16.2.4 Legrand SA
- 16.2.4.1. Overview
- 16.2.4.2. Products
- 16.2.4.3. SWOT Analysis
- 16.2.4.4. Recent Developments
- 16.2.4.5. Financials (Based on Availability)
- 16.2.5 Google Inc (Alphabet Inc )
- 16.2.5.1. Overview
- 16.2.5.2. Products
- 16.2.5.3. SWOT Analysis
- 16.2.5.4. Recent Developments
- 16.2.5.5. Financials (Based on Availability)
- 16.2.6 LG Electronics Inc
- 16.2.6.1. Overview
- 16.2.6.2. Products
- 16.2.6.3. SWOT Analysis
- 16.2.6.4. Recent Developments
- 16.2.6.5. Financials (Based on Availability)
- 16.2.7 Savant Systems Inc (GE Lighting)
- 16.2.7.1. Overview
- 16.2.7.2. Products
- 16.2.7.3. SWOT Analysis
- 16.2.7.4. Recent Developments
- 16.2.7.5. Financials (Based on Availability)
- 16.2.8 Emerson Electric Co
- 16.2.8.1. Overview
- 16.2.8.2. Products
- 16.2.8.3. SWOT Analysis
- 16.2.8.4. Recent Developments
- 16.2.8.5. Financials (Based on Availability)
- 16.2.9 Cisco Systems Inc
- 16.2.9.1. Overview
- 16.2.9.2. Products
- 16.2.9.3. SWOT Analysis
- 16.2.9.4. Recent Developments
- 16.2.9.5. Financials (Based on Availability)
- 16.2.10 Lutron Electronics Co Inc
- 16.2.10.1. Overview
- 16.2.10.2. Products
- 16.2.10.3. SWOT Analysis
- 16.2.10.4. Recent Developments
- 16.2.10.5. Financials (Based on Availability)
- 16.2.11 Siemens AG
- 16.2.11.1. Overview
- 16.2.11.2. Products
- 16.2.11.3. SWOT Analysis
- 16.2.11.4. Recent Developments
- 16.2.11.5. Financials (Based on Availability)
- 16.2.12 Microsoft Corporation
- 16.2.12.1. Overview
- 16.2.12.2. Products
- 16.2.12.3. SWOT Analysis
- 16.2.12.4. Recent Developments
- 16.2.12.5. Financials (Based on Availability)
- 16.2.13 Schneider Electric SE
- 16.2.13.1. Overview
- 16.2.13.2. Products
- 16.2.13.3. SWOT Analysis
- 16.2.13.4. Recent Developments
- 16.2.13.5. Financials (Based on Availability)
- 16.2.14 Control4 Corporation
- 16.2.14.1. Overview
- 16.2.14.2. Products
- 16.2.14.3. SWOT Analysis
- 16.2.14.4. Recent Developments
- 16.2.14.5. Financials (Based on Availability)
- 16.2.15 ABB Limited
- 16.2.15.1. Overview
- 16.2.15.2. Products
- 16.2.15.3. SWOT Analysis
- 16.2.15.4. Recent Developments
- 16.2.15.5. Financials (Based on Availability)
- 16.2.16 GE Appliances (Haier Group)
- 16.2.16.1. Overview
- 16.2.16.2. Products
- 16.2.16.3. SWOT Analysis
- 16.2.16.4. Recent Developments
- 16.2.16.5. Financials (Based on Availability)
- 16.2.1 Whirlpool Corporation
List of Figures
- Figure 1: Global Smart Home Market in the United States Revenue Breakdown (Million, %) by Region 2024 & 2032
- Figure 2: Global Smart Home Market in the United States Volume Breakdown (K Unit, %) by Region 2024 & 2032
- Figure 3: North America Smart Home Market in the United States Revenue (Million), by Country 2024 & 2032
- Figure 4: North America Smart Home Market in the United States Volume (K Unit), by Country 2024 & 2032
- Figure 5: North America Smart Home Market in the United States Revenue Share (%), by Country 2024 & 2032
- Figure 6: North America Smart Home Market in the United States Volume Share (%), by Country 2024 & 2032
- Figure 7: Europe Smart Home Market in the United States Revenue (Million), by Country 2024 & 2032
- Figure 8: Europe Smart Home Market in the United States Volume (K Unit), by Country 2024 & 2032
- Figure 9: Europe Smart Home Market in the United States Revenue Share (%), by Country 2024 & 2032
- Figure 10: Europe Smart Home Market in the United States Volume Share (%), by Country 2024 & 2032
- Figure 11: Asia Pacific Smart Home Market in the United States Revenue (Million), by Country 2024 & 2032
- Figure 12: Asia Pacific Smart Home Market in the United States Volume (K Unit), by Country 2024 & 2032
- Figure 13: Asia Pacific Smart Home Market in the United States Revenue Share (%), by Country 2024 & 2032
- Figure 14: Asia Pacific Smart Home Market in the United States Volume Share (%), by Country 2024 & 2032
- Figure 15: Rest of the World Smart Home Market in the United States Revenue (Million), by Country 2024 & 2032
- Figure 16: Rest of the World Smart Home Market in the United States Volume (K Unit), by Country 2024 & 2032
- Figure 17: Rest of the World Smart Home Market in the United States Revenue Share (%), by Country 2024 & 2032
- Figure 18: Rest of the World Smart Home Market in the United States Volume Share (%), by Country 2024 & 2032
- Figure 19: United States Smart Home Market in the United States Revenue (Million), by Country 2024 & 2032
- Figure 20: United States Smart Home Market in the United States Volume (K Unit), by Country 2024 & 2032
- Figure 21: United States Smart Home Market in the United States Revenue Share (%), by Country 2024 & 2032
- Figure 22: United States Smart Home Market in the United States Volume Share (%), by Country 2024 & 2032
- Figure 23: North America Smart Home Market in the United States Revenue (Million), by Product Type 2024 & 2032
- Figure 24: North America Smart Home Market in the United States Volume (K Unit), by Product Type 2024 & 2032
- Figure 25: North America Smart Home Market in the United States Revenue Share (%), by Product Type 2024 & 2032
- Figure 26: North America Smart Home Market in the United States Volume Share (%), by Product Type 2024 & 2032
- Figure 27: North America Smart Home Market in the United States Revenue (Million), by Country 2024 & 2032
- Figure 28: North America Smart Home Market in the United States Volume (K Unit), by Country 2024 & 2032
- Figure 29: North America Smart Home Market in the United States Revenue Share (%), by Country 2024 & 2032
- Figure 30: North America Smart Home Market in the United States Volume Share (%), by Country 2024 & 2032
- Figure 31: South America Smart Home Market in the United States Revenue (Million), by Product Type 2024 & 2032
- Figure 32: South America Smart Home Market in the United States Volume (K Unit), by Product Type 2024 & 2032
- Figure 33: South America Smart Home Market in the United States Revenue Share (%), by Product Type 2024 & 2032
- Figure 34: South America Smart Home Market in the United States Volume Share (%), by Product Type 2024 & 2032
- Figure 35: South America Smart Home Market in the United States Revenue (Million), by Country 2024 & 2032
- Figure 36: South America Smart Home Market in the United States Volume (K Unit), by Country 2024 & 2032
- Figure 37: South America Smart Home Market in the United States Revenue Share (%), by Country 2024 & 2032
- Figure 38: South America Smart Home Market in the United States Volume Share (%), by Country 2024 & 2032
- Figure 39: Europe Smart Home Market in the United States Revenue (Million), by Product Type 2024 & 2032
- Figure 40: Europe Smart Home Market in the United States Volume (K Unit), by Product Type 2024 & 2032
- Figure 41: Europe Smart Home Market in the United States Revenue Share (%), by Product Type 2024 & 2032
- Figure 42: Europe Smart Home Market in the United States Volume Share (%), by Product Type 2024 & 2032
- Figure 43: Europe Smart Home Market in the United States Revenue (Million), by Country 2024 & 2032
- Figure 44: Europe Smart Home Market in the United States Volume (K Unit), by Country 2024 & 2032
- Figure 45: Europe Smart Home Market in the United States Revenue Share (%), by Country 2024 & 2032
- Figure 46: Europe Smart Home Market in the United States Volume Share (%), by Country 2024 & 2032
- Figure 47: Middle East & Africa Smart Home Market in the United States Revenue (Million), by Product Type 2024 & 2032
- Figure 48: Middle East & Africa Smart Home Market in the United States Volume (K Unit), by Product Type 2024 & 2032
- Figure 49: Middle East & Africa Smart Home Market in the United States Revenue Share (%), by Product Type 2024 & 2032
- Figure 50: Middle East & Africa Smart Home Market in the United States Volume Share (%), by Product Type 2024 & 2032
- Figure 51: Middle East & Africa Smart Home Market in the United States Revenue (Million), by Country 2024 & 2032
- Figure 52: Middle East & Africa Smart Home Market in the United States Volume (K Unit), by Country 2024 & 2032
- Figure 53: Middle East & Africa Smart Home Market in the United States Revenue Share (%), by Country 2024 & 2032
- Figure 54: Middle East & Africa Smart Home Market in the United States Volume Share (%), by Country 2024 & 2032
- Figure 55: Asia Pacific Smart Home Market in the United States Revenue (Million), by Product Type 2024 & 2032
- Figure 56: Asia Pacific Smart Home Market in the United States Volume (K Unit), by Product Type 2024 & 2032
- Figure 57: Asia Pacific Smart Home Market in the United States Revenue Share (%), by Product Type 2024 & 2032
- Figure 58: Asia Pacific Smart Home Market in the United States Volume Share (%), by Product Type 2024 & 2032
- Figure 59: Asia Pacific Smart Home Market in the United States Revenue (Million), by Country 2024 & 2032
- Figure 60: Asia Pacific Smart Home Market in the United States Volume (K Unit), by Country 2024 & 2032
- Figure 61: Asia Pacific Smart Home Market in the United States Revenue Share (%), by Country 2024 & 2032
- Figure 62: Asia Pacific Smart Home Market in the United States Volume Share (%), by Country 2024 & 2032
List of Tables
- Table 1: Global Smart Home Market in the United States Revenue Million Forecast, by Region 2019 & 2032
- Table 2: Global Smart Home Market in the United States Volume K Unit Forecast, by Region 2019 & 2032
- Table 3: Global Smart Home Market in the United States Revenue Million Forecast, by Product Type 2019 & 2032
- Table 4: Global Smart Home Market in the United States Volume K Unit Forecast, by Product Type 2019 & 2032
- Table 5: Global Smart Home Market in the United States Revenue Million Forecast, by Region 2019 & 2032
- Table 6: Global Smart Home Market in the United States Volume K Unit Forecast, by Region 2019 & 2032
- Table 7: Global Smart Home Market in the United States Revenue Million Forecast, by Country 2019 & 2032
- Table 8: Global Smart Home Market in the United States Volume K Unit Forecast, by Country 2019 & 2032
- Table 9: Global Smart Home Market in the United States Revenue Million Forecast, by Country 2019 & 2032
- Table 10: Global Smart Home Market in the United States Volume K Unit Forecast, by Country 2019 & 2032
- Table 11: Global Smart Home Market in the United States Revenue Million Forecast, by Country 2019 & 2032
- Table 12: Global Smart Home Market in the United States Volume K Unit Forecast, by Country 2019 & 2032
- Table 13: Global Smart Home Market in the United States Revenue Million Forecast, by Country 2019 & 2032
- Table 14: Global Smart Home Market in the United States Volume K Unit Forecast, by Country 2019 & 2032
- Table 15: Global Smart Home Market in the United States Revenue Million Forecast, by Country 2019 & 2032
- Table 16: Global Smart Home Market in the United States Volume K Unit Forecast, by Country 2019 & 2032
- Table 17: Global Smart Home Market in the United States Revenue Million Forecast, by Product Type 2019 & 2032
- Table 18: Global Smart Home Market in the United States Volume K Unit Forecast, by Product Type 2019 & 2032
- Table 19: Global Smart Home Market in the United States Revenue Million Forecast, by Country 2019 & 2032
- Table 20: Global Smart Home Market in the United States Volume K Unit Forecast, by Country 2019 & 2032
- Table 21: United States Smart Home Market in the United States Revenue (Million) Forecast, by Application 2019 & 2032
- Table 22: United States Smart Home Market in the United States Volume (K Unit) Forecast, by Application 2019 & 2032
- Table 23: Canada Smart Home Market in the United States Revenue (Million) Forecast, by Application 2019 & 2032
- Table 24: Canada Smart Home Market in the United States Volume (K Unit) Forecast, by Application 2019 & 2032
- Table 25: Mexico Smart Home Market in the United States Revenue (Million) Forecast, by Application 2019 & 2032
- Table 26: Mexico Smart Home Market in the United States Volume (K Unit) Forecast, by Application 2019 & 2032
- Table 27: Global Smart Home Market in the United States Revenue Million Forecast, by Product Type 2019 & 2032
- Table 28: Global Smart Home Market in the United States Volume K Unit Forecast, by Product Type 2019 & 2032
- Table 29: Global Smart Home Market in the United States Revenue Million Forecast, by Country 2019 & 2032
- Table 30: Global Smart Home Market in the United States Volume K Unit Forecast, by Country 2019 & 2032
- Table 31: Brazil Smart Home Market in the United States Revenue (Million) Forecast, by Application 2019 & 2032
- Table 32: Brazil Smart Home Market in the United States Volume (K Unit) Forecast, by Application 2019 & 2032
- Table 33: Argentina Smart Home Market in the United States Revenue (Million) Forecast, by Application 2019 & 2032
- Table 34: Argentina Smart Home Market in the United States Volume (K Unit) Forecast, by Application 2019 & 2032
- Table 35: Rest of South America Smart Home Market in the United States Revenue (Million) Forecast, by Application 2019 & 2032
- Table 36: Rest of South America Smart Home Market in the United States Volume (K Unit) Forecast, by Application 2019 & 2032
- Table 37: Global Smart Home Market in the United States Revenue Million Forecast, by Product Type 2019 & 2032
- Table 38: Global Smart Home Market in the United States Volume K Unit Forecast, by Product Type 2019 & 2032
- Table 39: Global Smart Home Market in the United States Revenue Million Forecast, by Country 2019 & 2032
- Table 40: Global Smart Home Market in the United States Volume K Unit Forecast, by Country 2019 & 2032
- Table 41: United Kingdom Smart Home Market in the United States Revenue (Million) Forecast, by Application 2019 & 2032
- Table 42: United Kingdom Smart Home Market in the United States Volume (K Unit) Forecast, by Application 2019 & 2032
- Table 43: Germany Smart Home Market in the United States Revenue (Million) Forecast, by Application 2019 & 2032
- Table 44: Germany Smart Home Market in the United States Volume (K Unit) Forecast, by Application 2019 & 2032
- Table 45: France Smart Home Market in the United States Revenue (Million) Forecast, by Application 2019 & 2032
- Table 46: France Smart Home Market in the United States Volume (K Unit) Forecast, by Application 2019 & 2032
- Table 47: Italy Smart Home Market in the United States Revenue (Million) Forecast, by Application 2019 & 2032
- Table 48: Italy Smart Home Market in the United States Volume (K Unit) Forecast, by Application 2019 & 2032
- Table 49: Spain Smart Home Market in the United States Revenue (Million) Forecast, by Application 2019 & 2032
- Table 50: Spain Smart Home Market in the United States Volume (K Unit) Forecast, by Application 2019 & 2032
- Table 51: Russia Smart Home Market in the United States Revenue (Million) Forecast, by Application 2019 & 2032
- Table 52: Russia Smart Home Market in the United States Volume (K Unit) Forecast, by Application 2019 & 2032
- Table 53: Benelux Smart Home Market in the United States Revenue (Million) Forecast, by Application 2019 & 2032
- Table 54: Benelux Smart Home Market in the United States Volume (K Unit) Forecast, by Application 2019 & 2032
- Table 55: Nordics Smart Home Market in the United States Revenue (Million) Forecast, by Application 2019 & 2032
- Table 56: Nordics Smart Home Market in the United States Volume (K Unit) Forecast, by Application 2019 & 2032
- Table 57: Rest of Europe Smart Home Market in the United States Revenue (Million) Forecast, by Application 2019 & 2032
- Table 58: Rest of Europe Smart Home Market in the United States Volume (K Unit) Forecast, by Application 2019 & 2032
- Table 59: Global Smart Home Market in the United States Revenue Million Forecast, by Product Type 2019 & 2032
- Table 60: Global Smart Home Market in the United States Volume K Unit Forecast, by Product Type 2019 & 2032
- Table 61: Global Smart Home Market in the United States Revenue Million Forecast, by Country 2019 & 2032
- Table 62: Global Smart Home Market in the United States Volume K Unit Forecast, by Country 2019 & 2032
- Table 63: Turkey Smart Home Market in the United States Revenue (Million) Forecast, by Application 2019 & 2032
- Table 64: Turkey Smart Home Market in the United States Volume (K Unit) Forecast, by Application 2019 & 2032
- Table 65: Israel Smart Home Market in the United States Revenue (Million) Forecast, by Application 2019 & 2032
- Table 66: Israel Smart Home Market in the United States Volume (K Unit) Forecast, by Application 2019 & 2032
- Table 67: GCC Smart Home Market in the United States Revenue (Million) Forecast, by Application 2019 & 2032
- Table 68: GCC Smart Home Market in the United States Volume (K Unit) Forecast, by Application 2019 & 2032
- Table 69: North Africa Smart Home Market in the United States Revenue (Million) Forecast, by Application 2019 & 2032
- Table 70: North Africa Smart Home Market in the United States Volume (K Unit) Forecast, by Application 2019 & 2032
- Table 71: South Africa Smart Home Market in the United States Revenue (Million) Forecast, by Application 2019 & 2032
- Table 72: South Africa Smart Home Market in the United States Volume (K Unit) Forecast, by Application 2019 & 2032
- Table 73: Rest of Middle East & Africa Smart Home Market in the United States Revenue (Million) Forecast, by Application 2019 & 2032
- Table 74: Rest of Middle East & Africa Smart Home Market in the United States Volume (K Unit) Forecast, by Application 2019 & 2032
- Table 75: Global Smart Home Market in the United States Revenue Million Forecast, by Product Type 2019 & 2032
- Table 76: Global Smart Home Market in the United States Volume K Unit Forecast, by Product Type 2019 & 2032
- Table 77: Global Smart Home Market in the United States Revenue Million Forecast, by Country 2019 & 2032
- Table 78: Global Smart Home Market in the United States Volume K Unit Forecast, by Country 2019 & 2032
- Table 79: China Smart Home Market in the United States Revenue (Million) Forecast, by Application 2019 & 2032
- Table 80: China Smart Home Market in the United States Volume (K Unit) Forecast, by Application 2019 & 2032
- Table 81: India Smart Home Market in the United States Revenue (Million) Forecast, by Application 2019 & 2032
- Table 82: India Smart Home Market in the United States Volume (K Unit) Forecast, by Application 2019 & 2032
- Table 83: Japan Smart Home Market in the United States Revenue (Million) Forecast, by Application 2019 & 2032
- Table 84: Japan Smart Home Market in the United States Volume (K Unit) Forecast, by Application 2019 & 2032
- Table 85: South Korea Smart Home Market in the United States Revenue (Million) Forecast, by Application 2019 & 2032
- Table 86: South Korea Smart Home Market in the United States Volume (K Unit) Forecast, by Application 2019 & 2032
- Table 87: ASEAN Smart Home Market in the United States Revenue (Million) Forecast, by Application 2019 & 2032
- Table 88: ASEAN Smart Home Market in the United States Volume (K Unit) Forecast, by Application 2019 & 2032
- Table 89: Oceania Smart Home Market in the United States Revenue (Million) Forecast, by Application 2019 & 2032
- Table 90: Oceania Smart Home Market in the United States Volume (K Unit) Forecast, by Application 2019 & 2032
- Table 91: Rest of Asia Pacific Smart Home Market in the United States Revenue (Million) Forecast, by Application 2019 & 2032
- Table 92: Rest of Asia Pacific Smart Home Market in the United States Volume (K Unit) Forecast, by Application 2019 & 2032
Frequently Asked Questions
1. What is the projected Compound Annual Growth Rate (CAGR) of the Smart Home Market in the United States?
The projected CAGR is approximately 9.12%.
2. Which companies are prominent players in the Smart Home Market in the United States?
Key companies in the market include Whirlpool Corporation, Honeywell International Inc, Smart Home Inc, Legrand SA, Google Inc (Alphabet Inc ), LG Electronics Inc, Savant Systems Inc (GE Lighting), Emerson Electric Co, Cisco Systems Inc, Lutron Electronics Co Inc, Siemens AG, Microsoft Corporation, Schneider Electric SE, Control4 Corporation, ABB Limited, GE Appliances (Haier Group).
3. What are the main segments of the Smart Home Market in the United States?
The market segments include Product Type.
4. Can you provide details about the market size?
The market size is estimated to be USD 40.40 Million as of 2022.
5. What are some drivers contributing to market growth?
Increasing Demand for Energy-efficient Solutions; Growing Need for Automation of Security Systems.
6. What are the notable trends driving market growth?
Smart Appliances Accounted for the Highest Market Share.
7. Are there any restraints impacting market growth?
High Installation and Replacement Costs. along with Privacy Concerns.
8. Can you provide examples of recent developments in the market?
November 2022: Various products and smart home systems can collaborate according to the Matter standard, which Amazon had stated plans to scale out. New WWA certification standards for Matter devices were introduced by Amazon this year. As they increase the dependability and functionality of linked devices, they will also enable innovation and choice.
9. What pricing options are available for accessing the report?
Pricing options include single-user, multi-user, and enterprise licenses priced at USD 3800, USD 4500, and USD 5800 respectively.
10. Is the market size provided in terms of value or volume?
The market size is provided in terms of value, measured in Million and volume, measured in K Unit.
11. Are there any specific market keywords associated with the report?
Yes, the market keyword associated with the report is "Smart Home Market in the United States," which aids in identifying and referencing the specific market segment covered.
12. How do I determine which pricing option suits my needs best?
The pricing options vary based on user requirements and access needs. Individual users may opt for single-user licenses, while businesses requiring broader access may choose multi-user or enterprise licenses for cost-effective access to the report.
13. Are there any additional resources or data provided in the Smart Home Market in the United States report?
While the report offers comprehensive insights, it's advisable to review the specific contents or supplementary materials provided to ascertain if additional resources or data are available.
14. How can I stay updated on further developments or reports in the Smart Home Market in the United States?
To stay informed about further developments, trends, and reports in the Smart Home Market in the United States, consider subscribing to industry newsletters, following relevant companies and organizations, or regularly checking reputable industry news sources and publications.
Methodology
Step 1 - Identification of Relevant Samples Size from Population Database


Step 2 - Approaches for Defining Global Market Size (Value, Volume* & Price*)

Note*: In applicable scenarios
Step 3 - Data Sources
Primary Research
- Web Analytics
- Survey Reports
- Research Institute
- Latest Research Reports
- Opinion Leaders
Secondary Research
- Annual Reports
- White Paper
- Latest Press Release
- Industry Association
- Paid Database
- Investor Presentations

Step 4 - Data Triangulation
Involves using different sources of information in order to increase the validity of a study
These sources are likely to be stakeholders in a program - participants, other researchers, program staff, other community members, and so on.
Then we put all data in single framework & apply various statistical tools to find out the dynamic on the market.
During the analysis stage, feedback from the stakeholder groups would be compared to determine areas of agreement as well as areas of divergence
