

Key Insights
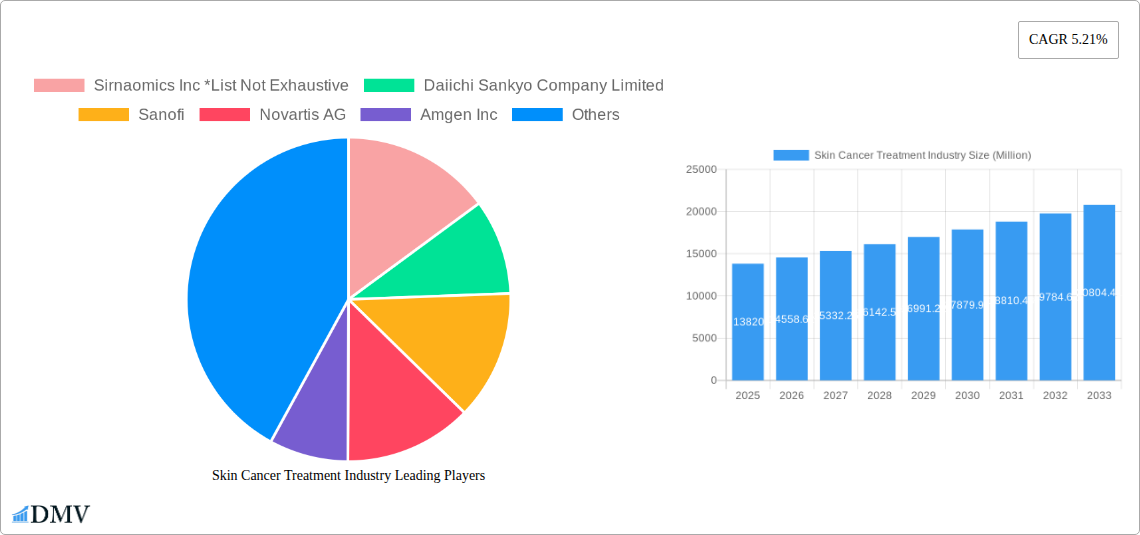
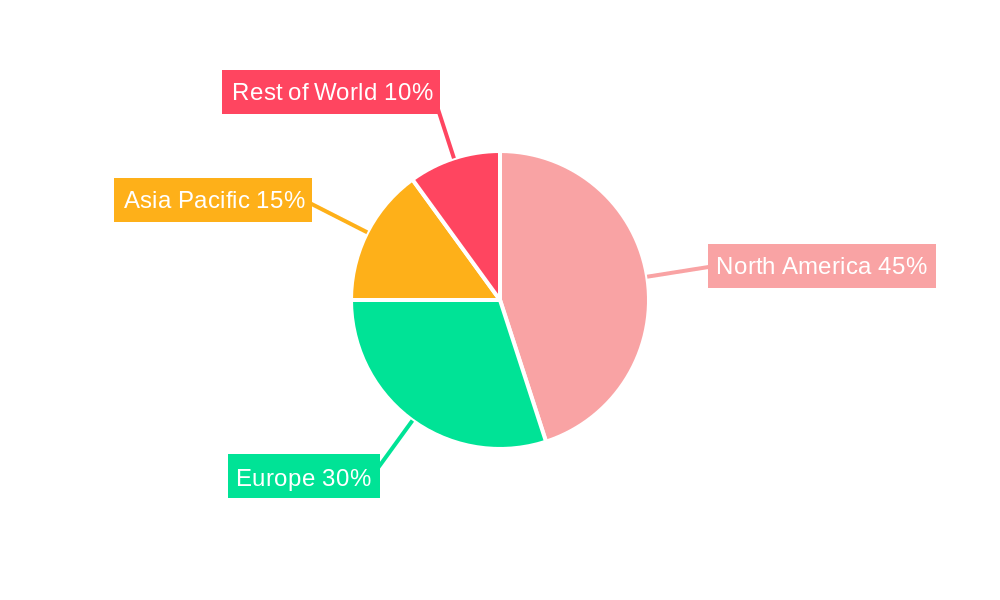
The global skin cancer treatment market, valued at $13.82 billion in 2025, is projected to experience robust growth, driven by rising skin cancer incidence rates globally, an aging population (increasing susceptibility), and advancements in treatment modalities. The Compound Annual Growth Rate (CAGR) of 5.21% from 2025 to 2033 signifies a considerable expansion. Key drivers include the increasing prevalence of melanoma and non-melanoma skin cancers, coupled with growing awareness and early detection initiatives. Furthermore, the market is witnessing significant innovation in targeted therapies, immunotherapies, and minimally invasive procedures, offering improved treatment outcomes and patient experience. Market segmentation reveals substantial contributions from melanoma and non-melanoma skin cancer treatments, along with diagnostic tools and other therapeutics. Leading pharmaceutical companies like Sanofi, Novartis, and Merck & Co., along with specialized biotech firms like Sirnaomics, are actively involved in research and development, contributing to the market's dynamism. Geographic analysis shows North America currently holds a dominant market share, attributable to high healthcare expenditure and advanced infrastructure. However, Asia-Pacific is expected to witness significant growth due to increasing awareness, rising disposable incomes, and expanding healthcare access in developing economies. While the market faces constraints like high treatment costs and potential side effects associated with certain therapies, the overall outlook remains positive due to continuous advancements and unmet medical needs.
The forecast period (2025-2033) suggests a continued expansion, fueled by the ongoing development of novel therapeutic approaches, improved diagnostic technologies, and expanding access to healthcare services in emerging markets. The market's growth trajectory is expected to be influenced by factors like government initiatives promoting cancer awareness and early detection programs, reimbursement policies, and the availability of skilled healthcare professionals specializing in dermatology and oncology. The competitive landscape is characterized by both large multinational pharmaceutical companies and specialized biotechnology firms, fostering innovation and competition. This competitive environment is likely to accelerate the development and availability of more effective and affordable skin cancer treatments in the coming years, benefitting patients worldwide.
Skin Cancer Treatment Industry: A Comprehensive Market Report (2019-2033)
This insightful report provides a detailed analysis of the global skin cancer treatment industry, projecting a market value exceeding $XX Million by 2033. It covers key segments, leading players, and future trends, offering invaluable insights for stakeholders, investors, and industry professionals. The study period spans from 2019 to 2033, with 2025 serving as both the base and estimated year. This report is essential for understanding the dynamic landscape of skin cancer treatment and making informed strategic decisions.
Skin Cancer Treatment Industry Market Composition & Trends
This section delves into the competitive dynamics of the skin cancer treatment market, examining market concentration, innovative drivers, regulatory influences, substitute therapies, end-user profiles, and merger & acquisition (M&A) activities. The global market is characterized by a moderately concentrated landscape, with key players holding significant market share. However, the emergence of innovative therapies and smaller biotech companies is creating a more competitive environment.
- Market Share Distribution: The top five companies (e.g., Merck & Co Inc, Bristol-Myers Squibb Company, Novartis AG, Roche, Amgen Inc) collectively hold approximately XX% of the market share in 2025, while the remaining share is distributed among numerous smaller players and emerging biotech companies.
- M&A Activity: The industry has witnessed significant M&A activity in recent years, with deals valued at over $XX Million annually. These acquisitions often focus on acquiring innovative technologies and expanding product pipelines. Strategic partnerships also play a vital role in accelerating market penetration and expanding global reach.
- Innovation Catalysts: Advances in immunotherapy, targeted therapies, and diagnostic technologies are driving significant innovation. The development of novel treatment modalities, such as personalized medicine approaches, is gaining momentum.
- Regulatory Landscape: Stringent regulatory approvals and evolving reimbursement policies influence market access and product launch timelines. Regulatory approvals such as the Opdualag approval significantly impacts the market.
- Substitute Products: Existing treatment options like surgical excision, radiation therapy and topical treatments compete with novel therapies, influencing market dynamics and treatment choices.
- End-User Profiles: The end-users primarily include dermatologists, oncologists, hospitals, and clinics.

Skin Cancer Treatment Industry Evolution
This section provides a comprehensive analysis of the skin cancer treatment market's evolution, examining growth trajectories, technological advancements, and changing consumer demands throughout the historical period (2019–2024) and into the forecast period (2025–2033). The market has experienced a compound annual growth rate (CAGR) of XX% during the historical period, driven by factors such as increasing skin cancer incidence rates, growing awareness of early detection, advancements in treatment modalities, and increasing healthcare expenditure. Technological advancements in targeted therapies, immunotherapies, and diagnostic tools have significantly altered treatment approaches and improved patient outcomes. Furthermore, shifting consumer preferences towards minimally invasive treatments and personalized medicine approaches are shaping market dynamics. The forecast period projects a continued growth trajectory, fueled by an expanding pipeline of innovative therapies, rising patient populations, and an increase in healthcare investments. The projected CAGR for 2025–2033 is estimated to be XX%. Adoption rates of new therapies are expected to increase steadily over the forecast period, driven by improved efficacy and safety profiles, as well as expanded reimbursement coverage.
Leading Regions, Countries, or Segments in Skin Cancer Treatment Industry
North America holds the largest market share within the skin cancer treatment industry due to several key drivers: high skin cancer prevalence rates, advanced healthcare infrastructure, robust research and development activities, and increased healthcare expenditure. The region boasts a high concentration of leading pharmaceutical and biotechnology companies actively involved in research and development, clinical trials, and market penetration of new and improved treatments. Regulatory support and extensive healthcare insurance coverage facilitate market access for new therapies.
- Key Drivers for North America's Dominance:
- High prevalence of skin cancer
- Advanced healthcare infrastructure
- Significant R&D investment
- Favorable regulatory environment
- High healthcare expenditure
While North America holds a significant position, the market is also witnessing substantial growth in other regions like Europe and Asia Pacific, fuelled by rising awareness and improved access to care. Specific countries within these regions with notable growth potential include [mention specific countries with rationale]. The Melanoma segment is projected to dominate by cancer type, reflecting higher prevalence and treatment complexity. The Therapeutics segment will maintain its dominance within the "Others" category, fueled by advancements in targeted therapies and immunotherapies. Within the "By Type" segment, Diagnosis is expected to witness significant growth, reflecting an increasing focus on early detection and improved diagnostic tools.
Skin Cancer Treatment Industry Product Innovations
Recent years have witnessed a surge in innovative skin cancer treatments, including targeted therapies designed to precisely attack cancer cells, advanced immunotherapies that harness the body's immune system to combat the disease, and improved diagnostic tools to enable early detection. These innovations offer improved efficacy, reduced side effects, and personalized approaches, significantly enhancing patient outcomes and quality of life. The unique selling propositions of these innovative products include improved efficacy, targeted delivery systems minimizing side effects, and minimally invasive procedures.
Propelling Factors for Skin Cancer Treatment Industry Growth
Several factors propel the growth of the skin cancer treatment industry. The rising incidence of skin cancer globally is a primary driver, fueled by increasing exposure to ultraviolet (UV) radiation and lifestyle factors. Advances in treatment technologies, particularly immunotherapies and targeted therapies, have revolutionized treatment approaches, leading to improved patient outcomes and market expansion. Furthermore, supportive government policies and increased healthcare expenditure contribute significantly to market growth.
Obstacles in the Skin Cancer Treatment Industry Market
Despite the considerable growth, challenges remain. High treatment costs and limited access to advanced therapies in many regions remain significant obstacles. Stringent regulatory approval processes can delay market entry for innovative treatments. Additionally, the emergence of biosimilars and generic drugs introduces competitive pressures, impacting profitability for originator companies.
Future Opportunities in Skin Cancer Treatment Industry
Future opportunities lie in expanding access to affordable and effective treatments in underserved markets, developing personalized medicine approaches that cater to individual patient needs, and leveraging artificial intelligence (AI) for improved diagnostics and treatment optimization. The development of novel treatment modalities and improved diagnostic tools will continue to drive market growth and expansion. Furthermore, new markets in emerging economies are expected to offer significant growth potential.
Major Players in the Skin Cancer Treatment Industry Ecosystem
- Sirnaomics Inc
- Daiichi Sankyo Company Limited
- Sanofi
- Novartis AG
- Amgen Inc
- Merck & Co Inc
- F Hoffmann-La Roche Ltd
- Abbott
- Labcorp
- Sun Pharmaceutical Industries Ltd
- QIAGEN
- Bristol-Myers Squibb Company
- Pfizer Inc
Key Developments in Skin Cancer Treatment Industry Industry
- March 2022: The United States Food and Drug Administration approved nivolumab and relatlimab-rmbw (Opdualag, Bristol-Myers Squibb Company) for adult and pediatric patients 12 years of age or older with unresectable or metastatic melanoma. This approval significantly expanded treatment options for melanoma patients.
- January 2022: SkinCure Oncology launched GentleCure.com, a consumer health education platform offering evidence-based treatment options for basal cell (BCC) and squamous cell skin cancers (SCC). This initiative improved patient access to information.
Strategic Skin Cancer Treatment Industry Market Forecast
The skin cancer treatment market is poised for continued robust growth, driven by an expanding pipeline of innovative therapies, increasing awareness of early detection, and rising healthcare expenditure. Future opportunities lie in personalized medicine, advanced diagnostics, and expansion into emerging markets. The market is expected to witness significant advancements in treatment modalities, potentially leading to improved patient outcomes and market expansion in the coming years.
Skin Cancer Treatment Industry Segmentation
-
1. Cancer Type
- 1.1. Melanoma
- 1.2. Non-melanoma
-
2. Type
-
2.1. Diagnosis
- 2.1.1. Dermatoscopy
- 2.1.2. Biopsy
- 2.1.3. Genetic Tests
- 2.1.4. Others
-
2.2. Therapeutics
- 2.2.1. Chemotherapy
- 2.2.2. Immunotherapy
- 2.2.3. Targeted Therapy
-
2.1. Diagnosis
Skin Cancer Treatment Industry Segmentation By Geography
-
1. North America
- 1.1. United States
- 1.2. Canada
- 1.3. Mexico
-
2. Europe
- 2.1. Germany
- 2.2. United Kingdom
- 2.3. France
- 2.4. Italy
- 2.5. Spain
- 2.6. Rest of Europe
-
3. Asia Pacific
- 3.1. China
- 3.2. Japan
- 3.3. India
- 3.4. Australia
- 3.5. South Korea
- 3.6. Rest of Asia Pacific
-
4. Middle East and Africa
- 4.1. GCC
- 4.2. South Africa
- 4.3. Rest of Middle East and Africa
-
5. South America
- 5.1. Brazil
- 5.2. Argentina
- 5.3. Rest of South America
Skin Cancer Treatment Industry REPORT HIGHLIGHTS
| Aspects | Details |
|---|---|
| Study Period | 2019-2033 |
| Base Year | 2024 |
| Estimated Year | 2025 |
| Forecast Period | 2025-2033 |
| Historical Period | 2019-2024 |
| Growth Rate | CAGR of 5.21% from 2019-2033 |
| Segmentation |
|
Table of Contents
- 1. Introduction
- 1.1. Research Scope
- 1.2. Market Segmentation
- 1.3. Research Methodology
- 1.4. Definitions and Assumptions
- 2. Executive Summary
- 2.1. Introduction
- 3. Market Dynamics
- 3.1. Introduction
- 3.2. Market Drivers
- 3.2.1. Increasing Incidence of Skin Cancer; Rising Awareness About Skin Cancer; Extensive Research and Developments
- 3.3. Market Restrains
- 3.3.1. High Cost Associated with Therapy; Stringent Regulatory Framework
- 3.4. Market Trends
- 3.4.1. Non-Melanoma by Cancer Type Segment is Expected to Grow Over the Forecast Period
- 4. Market Factor Analysis
- 4.1. Porters Five Forces
- 4.2. Supply/Value Chain
- 4.3. PESTEL analysis
- 4.4. Market Entropy
- 4.5. Patent/Trademark Analysis
- 5. Global Skin Cancer Treatment Industry Analysis, Insights and Forecast, 2019-2031
- 5.1. Market Analysis, Insights and Forecast - by Cancer Type
- 5.1.1. Melanoma
- 5.1.2. Non-melanoma
- 5.2. Market Analysis, Insights and Forecast - by Type
- 5.2.1. Diagnosis
- 5.2.1.1. Dermatoscopy
- 5.2.1.2. Biopsy
- 5.2.1.3. Genetic Tests
- 5.2.1.4. Others
- 5.2.2. Therapeutics
- 5.2.2.1. Chemotherapy
- 5.2.2.2. Immunotherapy
- 5.2.2.3. Targeted Therapy
- 5.2.1. Diagnosis
- 5.3. Market Analysis, Insights and Forecast - by Region
- 5.3.1. North America
- 5.3.2. Europe
- 5.3.3. Asia Pacific
- 5.3.4. Middle East and Africa
- 5.3.5. South America
- 5.1. Market Analysis, Insights and Forecast - by Cancer Type
- 6. North America Skin Cancer Treatment Industry Analysis, Insights and Forecast, 2019-2031
- 6.1. Market Analysis, Insights and Forecast - by Cancer Type
- 6.1.1. Melanoma
- 6.1.2. Non-melanoma
- 6.2. Market Analysis, Insights and Forecast - by Type
- 6.2.1. Diagnosis
- 6.2.1.1. Dermatoscopy
- 6.2.1.2. Biopsy
- 6.2.1.3. Genetic Tests
- 6.2.1.4. Others
- 6.2.2. Therapeutics
- 6.2.2.1. Chemotherapy
- 6.2.2.2. Immunotherapy
- 6.2.2.3. Targeted Therapy
- 6.2.1. Diagnosis
- 6.1. Market Analysis, Insights and Forecast - by Cancer Type
- 7. Europe Skin Cancer Treatment Industry Analysis, Insights and Forecast, 2019-2031
- 7.1. Market Analysis, Insights and Forecast - by Cancer Type
- 7.1.1. Melanoma
- 7.1.2. Non-melanoma
- 7.2. Market Analysis, Insights and Forecast - by Type
- 7.2.1. Diagnosis
- 7.2.1.1. Dermatoscopy
- 7.2.1.2. Biopsy
- 7.2.1.3. Genetic Tests
- 7.2.1.4. Others
- 7.2.2. Therapeutics
- 7.2.2.1. Chemotherapy
- 7.2.2.2. Immunotherapy
- 7.2.2.3. Targeted Therapy
- 7.2.1. Diagnosis
- 7.1. Market Analysis, Insights and Forecast - by Cancer Type
- 8. Asia Pacific Skin Cancer Treatment Industry Analysis, Insights and Forecast, 2019-2031
- 8.1. Market Analysis, Insights and Forecast - by Cancer Type
- 8.1.1. Melanoma
- 8.1.2. Non-melanoma
- 8.2. Market Analysis, Insights and Forecast - by Type
- 8.2.1. Diagnosis
- 8.2.1.1. Dermatoscopy
- 8.2.1.2. Biopsy
- 8.2.1.3. Genetic Tests
- 8.2.1.4. Others
- 8.2.2. Therapeutics
- 8.2.2.1. Chemotherapy
- 8.2.2.2. Immunotherapy
- 8.2.2.3. Targeted Therapy
- 8.2.1. Diagnosis
- 8.1. Market Analysis, Insights and Forecast - by Cancer Type
- 9. Middle East and Africa Skin Cancer Treatment Industry Analysis, Insights and Forecast, 2019-2031
- 9.1. Market Analysis, Insights and Forecast - by Cancer Type
- 9.1.1. Melanoma
- 9.1.2. Non-melanoma
- 9.2. Market Analysis, Insights and Forecast - by Type
- 9.2.1. Diagnosis
- 9.2.1.1. Dermatoscopy
- 9.2.1.2. Biopsy
- 9.2.1.3. Genetic Tests
- 9.2.1.4. Others
- 9.2.2. Therapeutics
- 9.2.2.1. Chemotherapy
- 9.2.2.2. Immunotherapy
- 9.2.2.3. Targeted Therapy
- 9.2.1. Diagnosis
- 9.1. Market Analysis, Insights and Forecast - by Cancer Type
- 10. South America Skin Cancer Treatment Industry Analysis, Insights and Forecast, 2019-2031
- 10.1. Market Analysis, Insights and Forecast - by Cancer Type
- 10.1.1. Melanoma
- 10.1.2. Non-melanoma
- 10.2. Market Analysis, Insights and Forecast - by Type
- 10.2.1. Diagnosis
- 10.2.1.1. Dermatoscopy
- 10.2.1.2. Biopsy
- 10.2.1.3. Genetic Tests
- 10.2.1.4. Others
- 10.2.2. Therapeutics
- 10.2.2.1. Chemotherapy
- 10.2.2.2. Immunotherapy
- 10.2.2.3. Targeted Therapy
- 10.2.1. Diagnosis
- 10.1. Market Analysis, Insights and Forecast - by Cancer Type
- 11. North Americ Skin Cancer Treatment Industry Analysis, Insights and Forecast, 2019-2031
- 11.1. Market Analysis, Insights and Forecast - By Country/Sub-region
- 11.1.1 United States
- 11.1.2 Canada
- 11.1.3 Mexico
- 12. South America Skin Cancer Treatment Industry Analysis, Insights and Forecast, 2019-2031
- 12.1. Market Analysis, Insights and Forecast - By Country/Sub-region
- 12.1.1 Brazil
- 12.1.2 Mexico
- 12.1.3 Rest of South America
- 13. Europe Skin Cancer Treatment Industry Analysis, Insights and Forecast, 2019-2031
- 13.1. Market Analysis, Insights and Forecast - By Country/Sub-region
- 13.1.1 Germany
- 13.1.2 United Kingdom
- 13.1.3 France
- 13.1.4 Italy
- 13.1.5 Spain
- 13.1.6 Rest of Europe
- 14. Asia Pacific Skin Cancer Treatment Industry Analysis, Insights and Forecast, 2019-2031
- 14.1. Market Analysis, Insights and Forecast - By Country/Sub-region
- 14.1.1 China
- 14.1.2 Japan
- 14.1.3 India
- 14.1.4 South Korea
- 14.1.5 Taiwan
- 14.1.6 Australia
- 14.1.7 Rest of Asia-Pacific
- 15. MEA Skin Cancer Treatment Industry Analysis, Insights and Forecast, 2019-2031
- 15.1. Market Analysis, Insights and Forecast - By Country/Sub-region
- 15.1.1 Middle East
- 15.1.2 Africa
- 16. Competitive Analysis
- 16.1. Global Market Share Analysis 2024
- 16.2. Company Profiles
- 16.2.1 Sirnaomics Inc *List Not Exhaustive
- 16.2.1.1. Overview
- 16.2.1.2. Products
- 16.2.1.3. SWOT Analysis
- 16.2.1.4. Recent Developments
- 16.2.1.5. Financials (Based on Availability)
- 16.2.2 Daiichi Sankyo Company Limited
- 16.2.2.1. Overview
- 16.2.2.2. Products
- 16.2.2.3. SWOT Analysis
- 16.2.2.4. Recent Developments
- 16.2.2.5. Financials (Based on Availability)
- 16.2.3 Sanofi
- 16.2.3.1. Overview
- 16.2.3.2. Products
- 16.2.3.3. SWOT Analysis
- 16.2.3.4. Recent Developments
- 16.2.3.5. Financials (Based on Availability)
- 16.2.4 Novartis AG
- 16.2.4.1. Overview
- 16.2.4.2. Products
- 16.2.4.3. SWOT Analysis
- 16.2.4.4. Recent Developments
- 16.2.4.5. Financials (Based on Availability)
- 16.2.5 Amgen Inc
- 16.2.5.1. Overview
- 16.2.5.2. Products
- 16.2.5.3. SWOT Analysis
- 16.2.5.4. Recent Developments
- 16.2.5.5. Financials (Based on Availability)
- 16.2.6 Merck & Co Inc
- 16.2.6.1. Overview
- 16.2.6.2. Products
- 16.2.6.3. SWOT Analysis
- 16.2.6.4. Recent Developments
- 16.2.6.5. Financials (Based on Availability)
- 16.2.7 F Hoffmann-La Roche Ltd
- 16.2.7.1. Overview
- 16.2.7.2. Products
- 16.2.7.3. SWOT Analysis
- 16.2.7.4. Recent Developments
- 16.2.7.5. Financials (Based on Availability)
- 16.2.8 Abbott
- 16.2.8.1. Overview
- 16.2.8.2. Products
- 16.2.8.3. SWOT Analysis
- 16.2.8.4. Recent Developments
- 16.2.8.5. Financials (Based on Availability)
- 16.2.9 Labcorp
- 16.2.9.1. Overview
- 16.2.9.2. Products
- 16.2.9.3. SWOT Analysis
- 16.2.9.4. Recent Developments
- 16.2.9.5. Financials (Based on Availability)
- 16.2.10 Sun Pharmaceutical Industries Ltd
- 16.2.10.1. Overview
- 16.2.10.2. Products
- 16.2.10.3. SWOT Analysis
- 16.2.10.4. Recent Developments
- 16.2.10.5. Financials (Based on Availability)
- 16.2.11 QIAGEN
- 16.2.11.1. Overview
- 16.2.11.2. Products
- 16.2.11.3. SWOT Analysis
- 16.2.11.4. Recent Developments
- 16.2.11.5. Financials (Based on Availability)
- 16.2.12 Bristol-Myers Squibb Company
- 16.2.12.1. Overview
- 16.2.12.2. Products
- 16.2.12.3. SWOT Analysis
- 16.2.12.4. Recent Developments
- 16.2.12.5. Financials (Based on Availability)
- 16.2.13 Pfizer Inc
- 16.2.13.1. Overview
- 16.2.13.2. Products
- 16.2.13.3. SWOT Analysis
- 16.2.13.4. Recent Developments
- 16.2.13.5. Financials (Based on Availability)
- 16.2.1 Sirnaomics Inc *List Not Exhaustive
List of Figures
- Figure 1: Global Skin Cancer Treatment Industry Revenue Breakdown (Million, %) by Region 2024 & 2032
- Figure 2: North Americ Skin Cancer Treatment Industry Revenue (Million), by Country 2024 & 2032
- Figure 3: North Americ Skin Cancer Treatment Industry Revenue Share (%), by Country 2024 & 2032
- Figure 4: South America Skin Cancer Treatment Industry Revenue (Million), by Country 2024 & 2032
- Figure 5: South America Skin Cancer Treatment Industry Revenue Share (%), by Country 2024 & 2032
- Figure 6: Europe Skin Cancer Treatment Industry Revenue (Million), by Country 2024 & 2032
- Figure 7: Europe Skin Cancer Treatment Industry Revenue Share (%), by Country 2024 & 2032
- Figure 8: Asia Pacific Skin Cancer Treatment Industry Revenue (Million), by Country 2024 & 2032
- Figure 9: Asia Pacific Skin Cancer Treatment Industry Revenue Share (%), by Country 2024 & 2032
- Figure 10: MEA Skin Cancer Treatment Industry Revenue (Million), by Country 2024 & 2032
- Figure 11: MEA Skin Cancer Treatment Industry Revenue Share (%), by Country 2024 & 2032
- Figure 12: North America Skin Cancer Treatment Industry Revenue (Million), by Cancer Type 2024 & 2032
- Figure 13: North America Skin Cancer Treatment Industry Revenue Share (%), by Cancer Type 2024 & 2032
- Figure 14: North America Skin Cancer Treatment Industry Revenue (Million), by Type 2024 & 2032
- Figure 15: North America Skin Cancer Treatment Industry Revenue Share (%), by Type 2024 & 2032
- Figure 16: North America Skin Cancer Treatment Industry Revenue (Million), by Country 2024 & 2032
- Figure 17: North America Skin Cancer Treatment Industry Revenue Share (%), by Country 2024 & 2032
- Figure 18: Europe Skin Cancer Treatment Industry Revenue (Million), by Cancer Type 2024 & 2032
- Figure 19: Europe Skin Cancer Treatment Industry Revenue Share (%), by Cancer Type 2024 & 2032
- Figure 20: Europe Skin Cancer Treatment Industry Revenue (Million), by Type 2024 & 2032
- Figure 21: Europe Skin Cancer Treatment Industry Revenue Share (%), by Type 2024 & 2032
- Figure 22: Europe Skin Cancer Treatment Industry Revenue (Million), by Country 2024 & 2032
- Figure 23: Europe Skin Cancer Treatment Industry Revenue Share (%), by Country 2024 & 2032
- Figure 24: Asia Pacific Skin Cancer Treatment Industry Revenue (Million), by Cancer Type 2024 & 2032
- Figure 25: Asia Pacific Skin Cancer Treatment Industry Revenue Share (%), by Cancer Type 2024 & 2032
- Figure 26: Asia Pacific Skin Cancer Treatment Industry Revenue (Million), by Type 2024 & 2032
- Figure 27: Asia Pacific Skin Cancer Treatment Industry Revenue Share (%), by Type 2024 & 2032
- Figure 28: Asia Pacific Skin Cancer Treatment Industry Revenue (Million), by Country 2024 & 2032
- Figure 29: Asia Pacific Skin Cancer Treatment Industry Revenue Share (%), by Country 2024 & 2032
- Figure 30: Middle East and Africa Skin Cancer Treatment Industry Revenue (Million), by Cancer Type 2024 & 2032
- Figure 31: Middle East and Africa Skin Cancer Treatment Industry Revenue Share (%), by Cancer Type 2024 & 2032
- Figure 32: Middle East and Africa Skin Cancer Treatment Industry Revenue (Million), by Type 2024 & 2032
- Figure 33: Middle East and Africa Skin Cancer Treatment Industry Revenue Share (%), by Type 2024 & 2032
- Figure 34: Middle East and Africa Skin Cancer Treatment Industry Revenue (Million), by Country 2024 & 2032
- Figure 35: Middle East and Africa Skin Cancer Treatment Industry Revenue Share (%), by Country 2024 & 2032
- Figure 36: South America Skin Cancer Treatment Industry Revenue (Million), by Cancer Type 2024 & 2032
- Figure 37: South America Skin Cancer Treatment Industry Revenue Share (%), by Cancer Type 2024 & 2032
- Figure 38: South America Skin Cancer Treatment Industry Revenue (Million), by Type 2024 & 2032
- Figure 39: South America Skin Cancer Treatment Industry Revenue Share (%), by Type 2024 & 2032
- Figure 40: South America Skin Cancer Treatment Industry Revenue (Million), by Country 2024 & 2032
- Figure 41: South America Skin Cancer Treatment Industry Revenue Share (%), by Country 2024 & 2032
List of Tables
- Table 1: Global Skin Cancer Treatment Industry Revenue Million Forecast, by Region 2019 & 2032
- Table 2: Global Skin Cancer Treatment Industry Revenue Million Forecast, by Cancer Type 2019 & 2032
- Table 3: Global Skin Cancer Treatment Industry Revenue Million Forecast, by Type 2019 & 2032
- Table 4: Global Skin Cancer Treatment Industry Revenue Million Forecast, by Region 2019 & 2032
- Table 5: Global Skin Cancer Treatment Industry Revenue Million Forecast, by Country 2019 & 2032
- Table 6: United States Skin Cancer Treatment Industry Revenue (Million) Forecast, by Application 2019 & 2032
- Table 7: Canada Skin Cancer Treatment Industry Revenue (Million) Forecast, by Application 2019 & 2032
- Table 8: Mexico Skin Cancer Treatment Industry Revenue (Million) Forecast, by Application 2019 & 2032
- Table 9: Global Skin Cancer Treatment Industry Revenue Million Forecast, by Country 2019 & 2032
- Table 10: Brazil Skin Cancer Treatment Industry Revenue (Million) Forecast, by Application 2019 & 2032
- Table 11: Mexico Skin Cancer Treatment Industry Revenue (Million) Forecast, by Application 2019 & 2032
- Table 12: Rest of South America Skin Cancer Treatment Industry Revenue (Million) Forecast, by Application 2019 & 2032
- Table 13: Global Skin Cancer Treatment Industry Revenue Million Forecast, by Country 2019 & 2032
- Table 14: Germany Skin Cancer Treatment Industry Revenue (Million) Forecast, by Application 2019 & 2032
- Table 15: United Kingdom Skin Cancer Treatment Industry Revenue (Million) Forecast, by Application 2019 & 2032
- Table 16: France Skin Cancer Treatment Industry Revenue (Million) Forecast, by Application 2019 & 2032
- Table 17: Italy Skin Cancer Treatment Industry Revenue (Million) Forecast, by Application 2019 & 2032
- Table 18: Spain Skin Cancer Treatment Industry Revenue (Million) Forecast, by Application 2019 & 2032
- Table 19: Rest of Europe Skin Cancer Treatment Industry Revenue (Million) Forecast, by Application 2019 & 2032
- Table 20: Global Skin Cancer Treatment Industry Revenue Million Forecast, by Country 2019 & 2032
- Table 21: China Skin Cancer Treatment Industry Revenue (Million) Forecast, by Application 2019 & 2032
- Table 22: Japan Skin Cancer Treatment Industry Revenue (Million) Forecast, by Application 2019 & 2032
- Table 23: India Skin Cancer Treatment Industry Revenue (Million) Forecast, by Application 2019 & 2032
- Table 24: South Korea Skin Cancer Treatment Industry Revenue (Million) Forecast, by Application 2019 & 2032
- Table 25: Taiwan Skin Cancer Treatment Industry Revenue (Million) Forecast, by Application 2019 & 2032
- Table 26: Australia Skin Cancer Treatment Industry Revenue (Million) Forecast, by Application 2019 & 2032
- Table 27: Rest of Asia-Pacific Skin Cancer Treatment Industry Revenue (Million) Forecast, by Application 2019 & 2032
- Table 28: Global Skin Cancer Treatment Industry Revenue Million Forecast, by Country 2019 & 2032
- Table 29: Middle East Skin Cancer Treatment Industry Revenue (Million) Forecast, by Application 2019 & 2032
- Table 30: Africa Skin Cancer Treatment Industry Revenue (Million) Forecast, by Application 2019 & 2032
- Table 31: Global Skin Cancer Treatment Industry Revenue Million Forecast, by Cancer Type 2019 & 2032
- Table 32: Global Skin Cancer Treatment Industry Revenue Million Forecast, by Type 2019 & 2032
- Table 33: Global Skin Cancer Treatment Industry Revenue Million Forecast, by Country 2019 & 2032
- Table 34: United States Skin Cancer Treatment Industry Revenue (Million) Forecast, by Application 2019 & 2032
- Table 35: Canada Skin Cancer Treatment Industry Revenue (Million) Forecast, by Application 2019 & 2032
- Table 36: Mexico Skin Cancer Treatment Industry Revenue (Million) Forecast, by Application 2019 & 2032
- Table 37: Global Skin Cancer Treatment Industry Revenue Million Forecast, by Cancer Type 2019 & 2032
- Table 38: Global Skin Cancer Treatment Industry Revenue Million Forecast, by Type 2019 & 2032
- Table 39: Global Skin Cancer Treatment Industry Revenue Million Forecast, by Country 2019 & 2032
- Table 40: Germany Skin Cancer Treatment Industry Revenue (Million) Forecast, by Application 2019 & 2032
- Table 41: United Kingdom Skin Cancer Treatment Industry Revenue (Million) Forecast, by Application 2019 & 2032
- Table 42: France Skin Cancer Treatment Industry Revenue (Million) Forecast, by Application 2019 & 2032
- Table 43: Italy Skin Cancer Treatment Industry Revenue (Million) Forecast, by Application 2019 & 2032
- Table 44: Spain Skin Cancer Treatment Industry Revenue (Million) Forecast, by Application 2019 & 2032
- Table 45: Rest of Europe Skin Cancer Treatment Industry Revenue (Million) Forecast, by Application 2019 & 2032
- Table 46: Global Skin Cancer Treatment Industry Revenue Million Forecast, by Cancer Type 2019 & 2032
- Table 47: Global Skin Cancer Treatment Industry Revenue Million Forecast, by Type 2019 & 2032
- Table 48: Global Skin Cancer Treatment Industry Revenue Million Forecast, by Country 2019 & 2032
- Table 49: China Skin Cancer Treatment Industry Revenue (Million) Forecast, by Application 2019 & 2032
- Table 50: Japan Skin Cancer Treatment Industry Revenue (Million) Forecast, by Application 2019 & 2032
- Table 51: India Skin Cancer Treatment Industry Revenue (Million) Forecast, by Application 2019 & 2032
- Table 52: Australia Skin Cancer Treatment Industry Revenue (Million) Forecast, by Application 2019 & 2032
- Table 53: South Korea Skin Cancer Treatment Industry Revenue (Million) Forecast, by Application 2019 & 2032
- Table 54: Rest of Asia Pacific Skin Cancer Treatment Industry Revenue (Million) Forecast, by Application 2019 & 2032
- Table 55: Global Skin Cancer Treatment Industry Revenue Million Forecast, by Cancer Type 2019 & 2032
- Table 56: Global Skin Cancer Treatment Industry Revenue Million Forecast, by Type 2019 & 2032
- Table 57: Global Skin Cancer Treatment Industry Revenue Million Forecast, by Country 2019 & 2032
- Table 58: GCC Skin Cancer Treatment Industry Revenue (Million) Forecast, by Application 2019 & 2032
- Table 59: South Africa Skin Cancer Treatment Industry Revenue (Million) Forecast, by Application 2019 & 2032
- Table 60: Rest of Middle East and Africa Skin Cancer Treatment Industry Revenue (Million) Forecast, by Application 2019 & 2032
- Table 61: Global Skin Cancer Treatment Industry Revenue Million Forecast, by Cancer Type 2019 & 2032
- Table 62: Global Skin Cancer Treatment Industry Revenue Million Forecast, by Type 2019 & 2032
- Table 63: Global Skin Cancer Treatment Industry Revenue Million Forecast, by Country 2019 & 2032
- Table 64: Brazil Skin Cancer Treatment Industry Revenue (Million) Forecast, by Application 2019 & 2032
- Table 65: Argentina Skin Cancer Treatment Industry Revenue (Million) Forecast, by Application 2019 & 2032
- Table 66: Rest of South America Skin Cancer Treatment Industry Revenue (Million) Forecast, by Application 2019 & 2032
Frequently Asked Questions
1. What is the projected Compound Annual Growth Rate (CAGR) of the Skin Cancer Treatment Industry?
The projected CAGR is approximately 5.21%.
2. Which companies are prominent players in the Skin Cancer Treatment Industry?
Key companies in the market include Sirnaomics Inc *List Not Exhaustive, Daiichi Sankyo Company Limited, Sanofi, Novartis AG, Amgen Inc, Merck & Co Inc, F Hoffmann-La Roche Ltd, Abbott, Labcorp, Sun Pharmaceutical Industries Ltd, QIAGEN, Bristol-Myers Squibb Company, Pfizer Inc.
3. What are the main segments of the Skin Cancer Treatment Industry?
The market segments include Cancer Type, Type.
4. Can you provide details about the market size?
The market size is estimated to be USD 13.82 Million as of 2022.
5. What are some drivers contributing to market growth?
Increasing Incidence of Skin Cancer; Rising Awareness About Skin Cancer; Extensive Research and Developments.
6. What are the notable trends driving market growth?
Non-Melanoma by Cancer Type Segment is Expected to Grow Over the Forecast Period.
7. Are there any restraints impacting market growth?
High Cost Associated with Therapy; Stringent Regulatory Framework.
8. Can you provide examples of recent developments in the market?
In March 2022, the United States Food and Drug Administration approved nivolumab and relatlimab-rmbw (Opdualag, Bristol-Myers Squibb Company) for adult and pediatric patients 12 years of age or older with unresectable or metastatic melanoma. Opdualag is a fixed-dose combination of the LAG-3-blocking antibody relatlimab and the programmed death receptor-1 blocking antibody nivolumab.
9. What pricing options are available for accessing the report?
Pricing options include single-user, multi-user, and enterprise licenses priced at USD 4750, USD 5250, and USD 8750 respectively.
10. Is the market size provided in terms of value or volume?
The market size is provided in terms of value, measured in Million.
11. Are there any specific market keywords associated with the report?
Yes, the market keyword associated with the report is "Skin Cancer Treatment Industry," which aids in identifying and referencing the specific market segment covered.
12. How do I determine which pricing option suits my needs best?
The pricing options vary based on user requirements and access needs. Individual users may opt for single-user licenses, while businesses requiring broader access may choose multi-user or enterprise licenses for cost-effective access to the report.
13. Are there any additional resources or data provided in the Skin Cancer Treatment Industry report?
While the report offers comprehensive insights, it's advisable to review the specific contents or supplementary materials provided to ascertain if additional resources or data are available.
14. How can I stay updated on further developments or reports in the Skin Cancer Treatment Industry?
To stay informed about further developments, trends, and reports in the Skin Cancer Treatment Industry, consider subscribing to industry newsletters, following relevant companies and organizations, or regularly checking reputable industry news sources and publications.
Methodology
Step 1 - Identification of Relevant Samples Size from Population Database


Step 2 - Approaches for Defining Global Market Size (Value, Volume* & Price*)

Note*: In applicable scenarios
Step 3 - Data Sources
Primary Research
- Web Analytics
- Survey Reports
- Research Institute
- Latest Research Reports
- Opinion Leaders
Secondary Research
- Annual Reports
- White Paper
- Latest Press Release
- Industry Association
- Paid Database
- Investor Presentations

Step 4 - Data Triangulation
Involves using different sources of information in order to increase the validity of a study
These sources are likely to be stakeholders in a program - participants, other researchers, program staff, other community members, and so on.
Then we put all data in single framework & apply various statistical tools to find out the dynamic on the market.
During the analysis stage, feedback from the stakeholder groups would be compared to determine areas of agreement as well as areas of divergence
