

Key Insights
The HPLC (High-Performance Liquid Chromatography) brand industry, valued at $5 billion in 2025, is projected to experience robust growth, driven by increasing demand for advanced analytical techniques in pharmaceutical and biopharmaceutical research and development. The market's 4.45% CAGR indicates a steady expansion through 2033, fueled by several key factors. The rising prevalence of chronic diseases necessitates extensive drug discovery and development, boosting the utilization of HPLC systems for quality control and analysis. Furthermore, the growing adoption of personalized medicine requires sophisticated analytical tools to analyze complex biological samples, further driving market demand. Technological advancements, such as the development of miniaturized HPLC systems and enhanced software for data analysis, are streamlining workflows and improving efficiency, attracting wider adoption across various end-user segments. The strong presence of established players like Thermo Fisher Scientific, Agilent Technologies, and Bio-Rad Laboratories, along with increasing competition from emerging players, promotes innovation and competitive pricing, making HPLC technology more accessible to a larger customer base. The market is segmented by product type (instruments, consumables, accessories), application (protein expression, cloning, others), and end-user (pharmaceutical companies, CROs, academic institutions). North America currently holds a significant market share due to the high concentration of pharmaceutical and biotechnology companies and well-established research infrastructure, while Asia-Pacific is expected to demonstrate significant growth due to increasing healthcare spending and expanding research facilities.
The competitive landscape within the HPLC brand industry is marked by both established industry giants and specialized niche players. Strategic mergers and acquisitions are anticipated, leading to further market consolidation. Potential restraints include the high initial investment cost of HPLC systems, requiring substantial capital expenditure for organizations, particularly smaller companies and academic institutions with limited budgets. However, the long-term benefits of enhanced analytical capabilities and increased efficiency outweigh the initial investment, ensuring continued market growth. Furthermore, stringent regulatory requirements surrounding data integrity and validation within pharmaceutical and biopharmaceutical applications necessitates consistent technological updates and compliance efforts. This further drives the need for advanced and reliable HPLC systems, fueling market growth despite the challenges.
HPLC Brand Industry Market Report: 2019-2033
This comprehensive report provides a detailed analysis of the HPLC brand industry, offering invaluable insights for stakeholders seeking to navigate this dynamic market. The report covers the period 2019-2033, with a focus on the 2025-2033 forecast period, utilizing 2025 as the base year and incorporating historical data from 2019-2024. The global market is projected to reach xx Million by 2033.
HPLC Brand Industry Market Composition & Trends
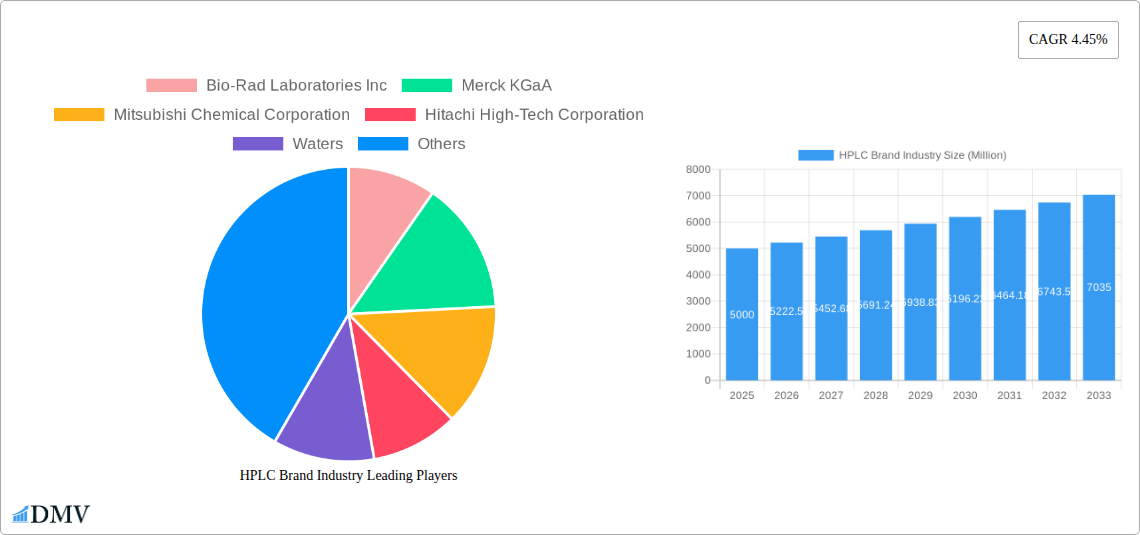
The HPLC brand industry is characterized by a moderately concentrated market structure with key players holding significant market share. Market leadership is fiercely contested, with companies like Waters, Agilent Technologies Inc, and Shimadzu Corporation holding substantial positions. However, smaller, specialized players continue to innovate and carve out niches. The market exhibits strong growth potential driven by advancements in pharmaceutical research, biotechnology, and environmental monitoring.
Market share distribution in 2025 is estimated as follows:
- Waters: 18%
- Agilent Technologies Inc: 15%
- Shimadzu Corporation: 12%
- Thermo Fisher Scientific: 10%
- Others: 45%
Regulatory landscapes vary across geographies, impacting market access and product approvals. The industry faces competitive pressure from alternative analytical techniques, but HPLC's versatility and established reliability ensure its continued relevance. Mergers and acquisitions (M&A) are frequent, driving consolidation and technological integration. Recent M&A deal values have ranged from xx Million to xx Million, indicating significant investment in the sector. End-users, primarily Pharma Bio-pharmaceutical Companies, Contract Research Organizations (CROs), and Academic Institutions, drive demand based on their specific research and analytical needs.
HPLC Brand Industry Industry Evolution
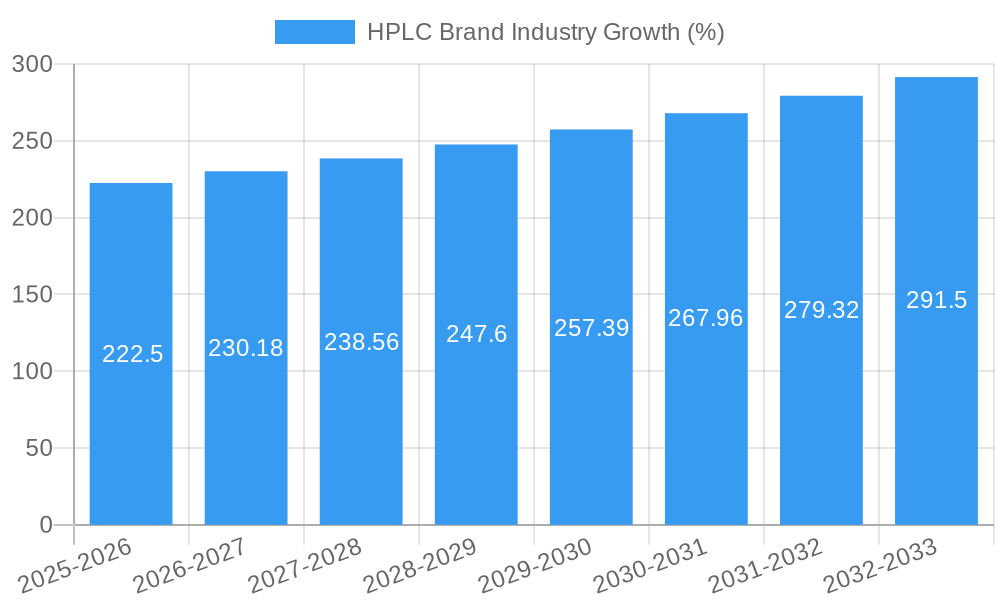
The HPLC brand industry has witnessed substantial evolution since 2019. Market growth has been robust, with a Compound Annual Growth Rate (CAGR) of approximately xx% during the historical period (2019-2024). This growth is projected to continue, albeit at a slightly moderated pace, during the forecast period (2025-2033), with a projected CAGR of xx%. This moderation is partially attributed to market saturation in certain segments and increased competition. Technological advancements, such as the introduction of ultra-high-performance liquid chromatography (UHPLC) systems and advancements in mass spectrometry (MS) coupling, have significantly enhanced the capabilities and efficiency of HPLC systems. The increasing demand for high-throughput screening and automation in drug discovery and development has further fueled the market's growth. Consumer demands are shifting towards more user-friendly, robust, and cost-effective systems, requiring manufacturers to adapt to these evolving preferences. Adoption of UHPLC systems is steadily increasing, with an estimated xx% of new system installations in 2025 utilizing this technology.
Leading Regions, Countries, or Segments in HPLC Brand Industry
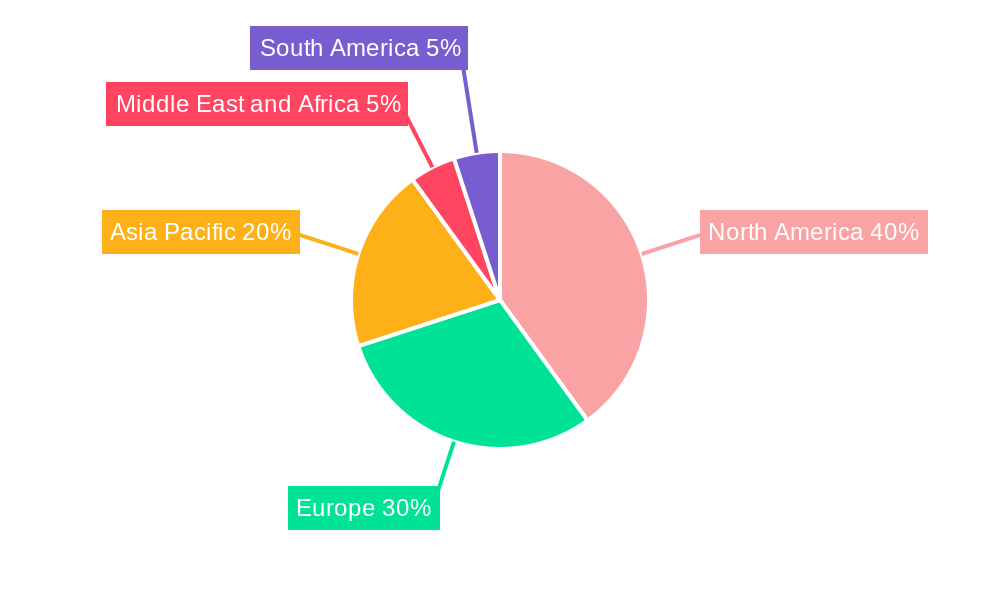
North America currently holds the dominant position in the global HPLC brand industry, followed by Europe and Asia Pacific. This dominance is primarily driven by:
- Strong pharmaceutical and biotechnology sectors: These regions house numerous large pharmaceutical and biotech companies with significant R&D budgets, creating high demand for HPLC systems.
- High levels of research funding: Significant government and private investment in scientific research fuels demand for advanced analytical techniques.
- Stringent regulatory frameworks: These regions have established regulatory frameworks, driving the adoption of high-quality, validated HPLC systems.
Within the segments:
- By Product Type: Instruments segment dominates, followed by consumables and accessories. Instruments account for xx Million (xx%) of the market in 2025.
- By Application: Protein expression and cloning are major applications, driven by the booming biopharmaceutical industry.
- By End User: Pharma Bio-pharmaceutical companies represent the largest end-user segment, accounting for approximately xx% of the market.
These factors significantly contribute to the sustained market growth.
HPLC Brand Industry Product Innovations
Recent innovations in HPLC technology have focused on improving sensitivity, speed, and automation. Manufacturers are introducing systems with improved column technology, advanced detectors (e.g., mass spectrometry), and enhanced software for data analysis. The development of miniaturized systems and microfluidic devices has enabled higher throughput and reduced reagent consumption. Unique selling propositions include improved robustness, ease of use, and reduced maintenance requirements. These advancements address the increasing demand for high-throughput screening and efficient data processing.
Propelling Factors for HPLC Brand Industry Growth
Several factors propel the growth of the HPLC brand industry. Technological advancements, particularly in UHPLC and MS coupling, enhance analytical capabilities and efficiency. The rising demand for advanced analytical techniques in pharmaceutical and biotechnology research fuels substantial growth. Stringent regulatory requirements in various industries (e.g., pharmaceuticals, food safety) necessitate the adoption of reliable and validated HPLC systems. Government funding and initiatives supporting scientific research further stimulate industry growth.
Obstacles in the HPLC Brand Industry Market
The HPLC brand industry faces certain challenges. The high cost of advanced HPLC systems and consumables can be a barrier for some users. Supply chain disruptions caused by global events can impact the availability of components and instruments. Intense competition among established and emerging players creates price pressures. Regulatory hurdles and stringent quality control standards add to the complexity of product development and market access.
Future Opportunities in HPLC Brand Industry
Future opportunities lie in developing environmentally friendly and sustainable HPLC systems. The increasing demand for high-throughput screening and automation presents substantial growth potential. Expansion into emerging markets with growing research and development activities offers significant prospects. The integration of artificial intelligence (AI) and machine learning (ML) for data analysis and predictive maintenance opens new avenues for innovation. Personalized medicine and targeted drug discovery create niche applications for HPLC systems.
Major Players in the HPLC Brand Industry Ecosystem
- Bio-Rad Laboratories Inc
- Merck KGaA
- Mitsubishi Chemical Corporation
- Hitachi High-Tech Corporation
- Waters
- Tosoh Corporation
- Agilent Technologies Inc
- Hamilton Company
- PerkinElmer Inc
- Gilson Inc
- General Electric (Cytiva Life Sciences)
- Thermo Fisher Scientific
- Shimadzu Corporation
Key Developments in HPLC Brand Industry Industry
- Feb 2022: Shimadzu Corporation launched the Nexera XS inert high-performance liquid chromatograph globally, enhancing biopharmaceutical analysis.
- Jan 2022: Bruker Corporation acquired Prolab Instruments GmbH, expanding its low-flow, high-precision liquid chromatography capabilities.
Strategic HPLC Brand Industry Market Forecast
The HPLC brand industry is poised for continued growth, driven by technological innovations and increasing demand from key sectors. Opportunities in emerging markets and novel applications will fuel market expansion. The industry's focus on improving system efficiency, user-friendliness, and sustainability will shape future market dynamics. The increasing integration of AI and advanced data analytics will further enhance the capabilities of HPLC systems, creating new opportunities for market players.
HPLC Brand Industry Segmentation
-
1. Product Type
- 1.1. Instruments
- 1.2. Consumables
- 1.3. Accessories
-
2. Application
- 2.1. Protein Expression
- 2.2. Cloning
- 2.3. Other Applications
-
3. End User
- 3.1. Pharma Bio-pharmaceutical Companies
- 3.2. Contract Research Organizations
- 3.3. Academic Institutions
HPLC Brand Industry Segmentation By Geography
-
1. North America
- 1.1. United States
- 1.2. Canada
- 1.3. Mexico
-
2. Europe
- 2.1. Germany
- 2.2. United Kingdom
- 2.3. France
- 2.4. Italy
- 2.5. Spain
- 2.6. Rest of Europe
-
3. Asia Pacific
- 3.1. China
- 3.2. Japan
- 3.3. India
- 3.4. Australia
- 3.5. South Korea
- 3.6. Rest of Asia Pacific
-
4. Middle East and Africa
- 4.1. GCC
- 4.2. South Africa
- 4.3. Rest of Middle East and Africa
-
5. South America
- 5.1. Brazil
- 5.2. Argentina
- 5.3. Rest of South America
HPLC Brand Industry REPORT HIGHLIGHTS
| Aspects | Details |
|---|---|
| Study Period | 2019-2033 |
| Base Year | 2024 |
| Estimated Year | 2025 |
| Forecast Period | 2025-2033 |
| Historical Period | 2019-2024 |
| Growth Rate | CAGR of 4.45% from 2019-2033 |
| Segmentation |
|
Table of Contents
- 1. Introduction
- 1.1. Research Scope
- 1.2. Market Segmentation
- 1.3. Research Methodology
- 1.4. Definitions and Assumptions
- 2. Executive Summary
- 2.1. Introduction
- 3. Market Dynamics
- 3.1. Introduction
- 3.2. Market Drivers
- 3.2.1. Advancements in HPLC Technologies; The Surge in Usage of HPLC in Pharmaceutical and Biopharmaceutical Companies
- 3.3. Market Restrains
- 3.3.1. High Cost of the HPLC Systems; Lack of Skilled Professionals
- 3.4. Market Trends
- 3.4.1. Consumables Segment is Expected to Hold a Significant Share in the High-Performance Liquid Chromatography (HPLC) Market
- 4. Market Factor Analysis
- 4.1. Porters Five Forces
- 4.2. Supply/Value Chain
- 4.3. PESTEL analysis
- 4.4. Market Entropy
- 4.5. Patent/Trademark Analysis
- 5. Global HPLC Brand Industry Analysis, Insights and Forecast, 2019-2031
- 5.1. Market Analysis, Insights and Forecast - by Product Type
- 5.1.1. Instruments
- 5.1.2. Consumables
- 5.1.3. Accessories
- 5.2. Market Analysis, Insights and Forecast - by Application
- 5.2.1. Protein Expression
- 5.2.2. Cloning
- 5.2.3. Other Applications
- 5.3. Market Analysis, Insights and Forecast - by End User
- 5.3.1. Pharma Bio-pharmaceutical Companies
- 5.3.2. Contract Research Organizations
- 5.3.3. Academic Institutions
- 5.4. Market Analysis, Insights and Forecast - by Region
- 5.4.1. North America
- 5.4.2. Europe
- 5.4.3. Asia Pacific
- 5.4.4. Middle East and Africa
- 5.4.5. South America
- 5.1. Market Analysis, Insights and Forecast - by Product Type
- 6. North America HPLC Brand Industry Analysis, Insights and Forecast, 2019-2031
- 6.1. Market Analysis, Insights and Forecast - by Product Type
- 6.1.1. Instruments
- 6.1.2. Consumables
- 6.1.3. Accessories
- 6.2. Market Analysis, Insights and Forecast - by Application
- 6.2.1. Protein Expression
- 6.2.2. Cloning
- 6.2.3. Other Applications
- 6.3. Market Analysis, Insights and Forecast - by End User
- 6.3.1. Pharma Bio-pharmaceutical Companies
- 6.3.2. Contract Research Organizations
- 6.3.3. Academic Institutions
- 6.1. Market Analysis, Insights and Forecast - by Product Type
- 7. Europe HPLC Brand Industry Analysis, Insights and Forecast, 2019-2031
- 7.1. Market Analysis, Insights and Forecast - by Product Type
- 7.1.1. Instruments
- 7.1.2. Consumables
- 7.1.3. Accessories
- 7.2. Market Analysis, Insights and Forecast - by Application
- 7.2.1. Protein Expression
- 7.2.2. Cloning
- 7.2.3. Other Applications
- 7.3. Market Analysis, Insights and Forecast - by End User
- 7.3.1. Pharma Bio-pharmaceutical Companies
- 7.3.2. Contract Research Organizations
- 7.3.3. Academic Institutions
- 7.1. Market Analysis, Insights and Forecast - by Product Type
- 8. Asia Pacific HPLC Brand Industry Analysis, Insights and Forecast, 2019-2031
- 8.1. Market Analysis, Insights and Forecast - by Product Type
- 8.1.1. Instruments
- 8.1.2. Consumables
- 8.1.3. Accessories
- 8.2. Market Analysis, Insights and Forecast - by Application
- 8.2.1. Protein Expression
- 8.2.2. Cloning
- 8.2.3. Other Applications
- 8.3. Market Analysis, Insights and Forecast - by End User
- 8.3.1. Pharma Bio-pharmaceutical Companies
- 8.3.2. Contract Research Organizations
- 8.3.3. Academic Institutions
- 8.1. Market Analysis, Insights and Forecast - by Product Type
- 9. Middle East and Africa HPLC Brand Industry Analysis, Insights and Forecast, 2019-2031
- 9.1. Market Analysis, Insights and Forecast - by Product Type
- 9.1.1. Instruments
- 9.1.2. Consumables
- 9.1.3. Accessories
- 9.2. Market Analysis, Insights and Forecast - by Application
- 9.2.1. Protein Expression
- 9.2.2. Cloning
- 9.2.3. Other Applications
- 9.3. Market Analysis, Insights and Forecast - by End User
- 9.3.1. Pharma Bio-pharmaceutical Companies
- 9.3.2. Contract Research Organizations
- 9.3.3. Academic Institutions
- 9.1. Market Analysis, Insights and Forecast - by Product Type
- 10. South America HPLC Brand Industry Analysis, Insights and Forecast, 2019-2031
- 10.1. Market Analysis, Insights and Forecast - by Product Type
- 10.1.1. Instruments
- 10.1.2. Consumables
- 10.1.3. Accessories
- 10.2. Market Analysis, Insights and Forecast - by Application
- 10.2.1. Protein Expression
- 10.2.2. Cloning
- 10.2.3. Other Applications
- 10.3. Market Analysis, Insights and Forecast - by End User
- 10.3.1. Pharma Bio-pharmaceutical Companies
- 10.3.2. Contract Research Organizations
- 10.3.3. Academic Institutions
- 10.1. Market Analysis, Insights and Forecast - by Product Type
- 11. North America HPLC Brand Industry Analysis, Insights and Forecast, 2019-2031
- 11.1. Market Analysis, Insights and Forecast - By Country/Sub-region
- 11.1.1 United States
- 11.1.2 Canada
- 11.1.3 Mexico
- 12. Europe HPLC Brand Industry Analysis, Insights and Forecast, 2019-2031
- 12.1. Market Analysis, Insights and Forecast - By Country/Sub-region
- 12.1.1 Germany
- 12.1.2 United Kingdom
- 12.1.3 France
- 12.1.4 Italy
- 12.1.5 Spain
- 12.1.6 Rest of Europe
- 13. Asia Pacific HPLC Brand Industry Analysis, Insights and Forecast, 2019-2031
- 13.1. Market Analysis, Insights and Forecast - By Country/Sub-region
- 13.1.1 China
- 13.1.2 Japan
- 13.1.3 India
- 13.1.4 Australia
- 13.1.5 South Korea
- 13.1.6 Rest of Asia Pacific
- 14. Middle East and Africa HPLC Brand Industry Analysis, Insights and Forecast, 2019-2031
- 14.1. Market Analysis, Insights and Forecast - By Country/Sub-region
- 14.1.1 GCC
- 14.1.2 South Africa
- 14.1.3 Rest of Middle East and Africa
- 15. South America HPLC Brand Industry Analysis, Insights and Forecast, 2019-2031
- 15.1. Market Analysis, Insights and Forecast - By Country/Sub-region
- 15.1.1 Brazil
- 15.1.2 Argentina
- 15.1.3 Rest of South America
- 16. Competitive Analysis
- 16.1. Global Market Share Analysis 2024
- 16.2. Company Profiles
- 16.2.1 Bio-Rad Laboratories Inc
- 16.2.1.1. Overview
- 16.2.1.2. Products
- 16.2.1.3. SWOT Analysis
- 16.2.1.4. Recent Developments
- 16.2.1.5. Financials (Based on Availability)
- 16.2.2 Merck KGaA
- 16.2.2.1. Overview
- 16.2.2.2. Products
- 16.2.2.3. SWOT Analysis
- 16.2.2.4. Recent Developments
- 16.2.2.5. Financials (Based on Availability)
- 16.2.3 Mitsubishi Chemical Corporation
- 16.2.3.1. Overview
- 16.2.3.2. Products
- 16.2.3.3. SWOT Analysis
- 16.2.3.4. Recent Developments
- 16.2.3.5. Financials (Based on Availability)
- 16.2.4 Hitachi High-Tech Corporation
- 16.2.4.1. Overview
- 16.2.4.2. Products
- 16.2.4.3. SWOT Analysis
- 16.2.4.4. Recent Developments
- 16.2.4.5. Financials (Based on Availability)
- 16.2.5 Waters
- 16.2.5.1. Overview
- 16.2.5.2. Products
- 16.2.5.3. SWOT Analysis
- 16.2.5.4. Recent Developments
- 16.2.5.5. Financials (Based on Availability)
- 16.2.6 Tosoh Corporation
- 16.2.6.1. Overview
- 16.2.6.2. Products
- 16.2.6.3. SWOT Analysis
- 16.2.6.4. Recent Developments
- 16.2.6.5. Financials (Based on Availability)
- 16.2.7 Agilent Technologies Inc
- 16.2.7.1. Overview
- 16.2.7.2. Products
- 16.2.7.3. SWOT Analysis
- 16.2.7.4. Recent Developments
- 16.2.7.5. Financials (Based on Availability)
- 16.2.8 Hamilton Company
- 16.2.8.1. Overview
- 16.2.8.2. Products
- 16.2.8.3. SWOT Analysis
- 16.2.8.4. Recent Developments
- 16.2.8.5. Financials (Based on Availability)
- 16.2.9 PerkinElmer Inc
- 16.2.9.1. Overview
- 16.2.9.2. Products
- 16.2.9.3. SWOT Analysis
- 16.2.9.4. Recent Developments
- 16.2.9.5. Financials (Based on Availability)
- 16.2.10 Gilson Inc
- 16.2.10.1. Overview
- 16.2.10.2. Products
- 16.2.10.3. SWOT Analysis
- 16.2.10.4. Recent Developments
- 16.2.10.5. Financials (Based on Availability)
- 16.2.11 General Electric (Cytiva Life Sciences)
- 16.2.11.1. Overview
- 16.2.11.2. Products
- 16.2.11.3. SWOT Analysis
- 16.2.11.4. Recent Developments
- 16.2.11.5. Financials (Based on Availability)
- 16.2.12 Thermo Fisher Scientific
- 16.2.12.1. Overview
- 16.2.12.2. Products
- 16.2.12.3. SWOT Analysis
- 16.2.12.4. Recent Developments
- 16.2.12.5. Financials (Based on Availability)
- 16.2.13 Shimadzu Corporation
- 16.2.13.1. Overview
- 16.2.13.2. Products
- 16.2.13.3. SWOT Analysis
- 16.2.13.4. Recent Developments
- 16.2.13.5. Financials (Based on Availability)
- 16.2.1 Bio-Rad Laboratories Inc
List of Figures
- Figure 1: Global HPLC Brand Industry Revenue Breakdown (Million, %) by Region 2024 & 2032
- Figure 2: Global HPLC Brand Industry Volume Breakdown (K Unit, %) by Region 2024 & 2032
- Figure 3: North America HPLC Brand Industry Revenue (Million), by Country 2024 & 2032
- Figure 4: North America HPLC Brand Industry Volume (K Unit), by Country 2024 & 2032
- Figure 5: North America HPLC Brand Industry Revenue Share (%), by Country 2024 & 2032
- Figure 6: North America HPLC Brand Industry Volume Share (%), by Country 2024 & 2032
- Figure 7: Europe HPLC Brand Industry Revenue (Million), by Country 2024 & 2032
- Figure 8: Europe HPLC Brand Industry Volume (K Unit), by Country 2024 & 2032
- Figure 9: Europe HPLC Brand Industry Revenue Share (%), by Country 2024 & 2032
- Figure 10: Europe HPLC Brand Industry Volume Share (%), by Country 2024 & 2032
- Figure 11: Asia Pacific HPLC Brand Industry Revenue (Million), by Country 2024 & 2032
- Figure 12: Asia Pacific HPLC Brand Industry Volume (K Unit), by Country 2024 & 2032
- Figure 13: Asia Pacific HPLC Brand Industry Revenue Share (%), by Country 2024 & 2032
- Figure 14: Asia Pacific HPLC Brand Industry Volume Share (%), by Country 2024 & 2032
- Figure 15: Middle East and Africa HPLC Brand Industry Revenue (Million), by Country 2024 & 2032
- Figure 16: Middle East and Africa HPLC Brand Industry Volume (K Unit), by Country 2024 & 2032
- Figure 17: Middle East and Africa HPLC Brand Industry Revenue Share (%), by Country 2024 & 2032
- Figure 18: Middle East and Africa HPLC Brand Industry Volume Share (%), by Country 2024 & 2032
- Figure 19: South America HPLC Brand Industry Revenue (Million), by Country 2024 & 2032
- Figure 20: South America HPLC Brand Industry Volume (K Unit), by Country 2024 & 2032
- Figure 21: South America HPLC Brand Industry Revenue Share (%), by Country 2024 & 2032
- Figure 22: South America HPLC Brand Industry Volume Share (%), by Country 2024 & 2032
- Figure 23: North America HPLC Brand Industry Revenue (Million), by Product Type 2024 & 2032
- Figure 24: North America HPLC Brand Industry Volume (K Unit), by Product Type 2024 & 2032
- Figure 25: North America HPLC Brand Industry Revenue Share (%), by Product Type 2024 & 2032
- Figure 26: North America HPLC Brand Industry Volume Share (%), by Product Type 2024 & 2032
- Figure 27: North America HPLC Brand Industry Revenue (Million), by Application 2024 & 2032
- Figure 28: North America HPLC Brand Industry Volume (K Unit), by Application 2024 & 2032
- Figure 29: North America HPLC Brand Industry Revenue Share (%), by Application 2024 & 2032
- Figure 30: North America HPLC Brand Industry Volume Share (%), by Application 2024 & 2032
- Figure 31: North America HPLC Brand Industry Revenue (Million), by End User 2024 & 2032
- Figure 32: North America HPLC Brand Industry Volume (K Unit), by End User 2024 & 2032
- Figure 33: North America HPLC Brand Industry Revenue Share (%), by End User 2024 & 2032
- Figure 34: North America HPLC Brand Industry Volume Share (%), by End User 2024 & 2032
- Figure 35: North America HPLC Brand Industry Revenue (Million), by Country 2024 & 2032
- Figure 36: North America HPLC Brand Industry Volume (K Unit), by Country 2024 & 2032
- Figure 37: North America HPLC Brand Industry Revenue Share (%), by Country 2024 & 2032
- Figure 38: North America HPLC Brand Industry Volume Share (%), by Country 2024 & 2032
- Figure 39: Europe HPLC Brand Industry Revenue (Million), by Product Type 2024 & 2032
- Figure 40: Europe HPLC Brand Industry Volume (K Unit), by Product Type 2024 & 2032
- Figure 41: Europe HPLC Brand Industry Revenue Share (%), by Product Type 2024 & 2032
- Figure 42: Europe HPLC Brand Industry Volume Share (%), by Product Type 2024 & 2032
- Figure 43: Europe HPLC Brand Industry Revenue (Million), by Application 2024 & 2032
- Figure 44: Europe HPLC Brand Industry Volume (K Unit), by Application 2024 & 2032
- Figure 45: Europe HPLC Brand Industry Revenue Share (%), by Application 2024 & 2032
- Figure 46: Europe HPLC Brand Industry Volume Share (%), by Application 2024 & 2032
- Figure 47: Europe HPLC Brand Industry Revenue (Million), by End User 2024 & 2032
- Figure 48: Europe HPLC Brand Industry Volume (K Unit), by End User 2024 & 2032
- Figure 49: Europe HPLC Brand Industry Revenue Share (%), by End User 2024 & 2032
- Figure 50: Europe HPLC Brand Industry Volume Share (%), by End User 2024 & 2032
- Figure 51: Europe HPLC Brand Industry Revenue (Million), by Country 2024 & 2032
- Figure 52: Europe HPLC Brand Industry Volume (K Unit), by Country 2024 & 2032
- Figure 53: Europe HPLC Brand Industry Revenue Share (%), by Country 2024 & 2032
- Figure 54: Europe HPLC Brand Industry Volume Share (%), by Country 2024 & 2032
- Figure 55: Asia Pacific HPLC Brand Industry Revenue (Million), by Product Type 2024 & 2032
- Figure 56: Asia Pacific HPLC Brand Industry Volume (K Unit), by Product Type 2024 & 2032
- Figure 57: Asia Pacific HPLC Brand Industry Revenue Share (%), by Product Type 2024 & 2032
- Figure 58: Asia Pacific HPLC Brand Industry Volume Share (%), by Product Type 2024 & 2032
- Figure 59: Asia Pacific HPLC Brand Industry Revenue (Million), by Application 2024 & 2032
- Figure 60: Asia Pacific HPLC Brand Industry Volume (K Unit), by Application 2024 & 2032
- Figure 61: Asia Pacific HPLC Brand Industry Revenue Share (%), by Application 2024 & 2032
- Figure 62: Asia Pacific HPLC Brand Industry Volume Share (%), by Application 2024 & 2032
- Figure 63: Asia Pacific HPLC Brand Industry Revenue (Million), by End User 2024 & 2032
- Figure 64: Asia Pacific HPLC Brand Industry Volume (K Unit), by End User 2024 & 2032
- Figure 65: Asia Pacific HPLC Brand Industry Revenue Share (%), by End User 2024 & 2032
- Figure 66: Asia Pacific HPLC Brand Industry Volume Share (%), by End User 2024 & 2032
- Figure 67: Asia Pacific HPLC Brand Industry Revenue (Million), by Country 2024 & 2032
- Figure 68: Asia Pacific HPLC Brand Industry Volume (K Unit), by Country 2024 & 2032
- Figure 69: Asia Pacific HPLC Brand Industry Revenue Share (%), by Country 2024 & 2032
- Figure 70: Asia Pacific HPLC Brand Industry Volume Share (%), by Country 2024 & 2032
- Figure 71: Middle East and Africa HPLC Brand Industry Revenue (Million), by Product Type 2024 & 2032
- Figure 72: Middle East and Africa HPLC Brand Industry Volume (K Unit), by Product Type 2024 & 2032
- Figure 73: Middle East and Africa HPLC Brand Industry Revenue Share (%), by Product Type 2024 & 2032
- Figure 74: Middle East and Africa HPLC Brand Industry Volume Share (%), by Product Type 2024 & 2032
- Figure 75: Middle East and Africa HPLC Brand Industry Revenue (Million), by Application 2024 & 2032
- Figure 76: Middle East and Africa HPLC Brand Industry Volume (K Unit), by Application 2024 & 2032
- Figure 77: Middle East and Africa HPLC Brand Industry Revenue Share (%), by Application 2024 & 2032
- Figure 78: Middle East and Africa HPLC Brand Industry Volume Share (%), by Application 2024 & 2032
- Figure 79: Middle East and Africa HPLC Brand Industry Revenue (Million), by End User 2024 & 2032
- Figure 80: Middle East and Africa HPLC Brand Industry Volume (K Unit), by End User 2024 & 2032
- Figure 81: Middle East and Africa HPLC Brand Industry Revenue Share (%), by End User 2024 & 2032
- Figure 82: Middle East and Africa HPLC Brand Industry Volume Share (%), by End User 2024 & 2032
- Figure 83: Middle East and Africa HPLC Brand Industry Revenue (Million), by Country 2024 & 2032
- Figure 84: Middle East and Africa HPLC Brand Industry Volume (K Unit), by Country 2024 & 2032
- Figure 85: Middle East and Africa HPLC Brand Industry Revenue Share (%), by Country 2024 & 2032
- Figure 86: Middle East and Africa HPLC Brand Industry Volume Share (%), by Country 2024 & 2032
- Figure 87: South America HPLC Brand Industry Revenue (Million), by Product Type 2024 & 2032
- Figure 88: South America HPLC Brand Industry Volume (K Unit), by Product Type 2024 & 2032
- Figure 89: South America HPLC Brand Industry Revenue Share (%), by Product Type 2024 & 2032
- Figure 90: South America HPLC Brand Industry Volume Share (%), by Product Type 2024 & 2032
- Figure 91: South America HPLC Brand Industry Revenue (Million), by Application 2024 & 2032
- Figure 92: South America HPLC Brand Industry Volume (K Unit), by Application 2024 & 2032
- Figure 93: South America HPLC Brand Industry Revenue Share (%), by Application 2024 & 2032
- Figure 94: South America HPLC Brand Industry Volume Share (%), by Application 2024 & 2032
- Figure 95: South America HPLC Brand Industry Revenue (Million), by End User 2024 & 2032
- Figure 96: South America HPLC Brand Industry Volume (K Unit), by End User 2024 & 2032
- Figure 97: South America HPLC Brand Industry Revenue Share (%), by End User 2024 & 2032
- Figure 98: South America HPLC Brand Industry Volume Share (%), by End User 2024 & 2032
- Figure 99: South America HPLC Brand Industry Revenue (Million), by Country 2024 & 2032
- Figure 100: South America HPLC Brand Industry Volume (K Unit), by Country 2024 & 2032
- Figure 101: South America HPLC Brand Industry Revenue Share (%), by Country 2024 & 2032
- Figure 102: South America HPLC Brand Industry Volume Share (%), by Country 2024 & 2032
List of Tables
- Table 1: Global HPLC Brand Industry Revenue Million Forecast, by Region 2019 & 2032
- Table 2: Global HPLC Brand Industry Volume K Unit Forecast, by Region 2019 & 2032
- Table 3: Global HPLC Brand Industry Revenue Million Forecast, by Product Type 2019 & 2032
- Table 4: Global HPLC Brand Industry Volume K Unit Forecast, by Product Type 2019 & 2032
- Table 5: Global HPLC Brand Industry Revenue Million Forecast, by Application 2019 & 2032
- Table 6: Global HPLC Brand Industry Volume K Unit Forecast, by Application 2019 & 2032
- Table 7: Global HPLC Brand Industry Revenue Million Forecast, by End User 2019 & 2032
- Table 8: Global HPLC Brand Industry Volume K Unit Forecast, by End User 2019 & 2032
- Table 9: Global HPLC Brand Industry Revenue Million Forecast, by Region 2019 & 2032
- Table 10: Global HPLC Brand Industry Volume K Unit Forecast, by Region 2019 & 2032
- Table 11: Global HPLC Brand Industry Revenue Million Forecast, by Country 2019 & 2032
- Table 12: Global HPLC Brand Industry Volume K Unit Forecast, by Country 2019 & 2032
- Table 13: United States HPLC Brand Industry Revenue (Million) Forecast, by Application 2019 & 2032
- Table 14: United States HPLC Brand Industry Volume (K Unit) Forecast, by Application 2019 & 2032
- Table 15: Canada HPLC Brand Industry Revenue (Million) Forecast, by Application 2019 & 2032
- Table 16: Canada HPLC Brand Industry Volume (K Unit) Forecast, by Application 2019 & 2032
- Table 17: Mexico HPLC Brand Industry Revenue (Million) Forecast, by Application 2019 & 2032
- Table 18: Mexico HPLC Brand Industry Volume (K Unit) Forecast, by Application 2019 & 2032
- Table 19: Global HPLC Brand Industry Revenue Million Forecast, by Country 2019 & 2032
- Table 20: Global HPLC Brand Industry Volume K Unit Forecast, by Country 2019 & 2032
- Table 21: Germany HPLC Brand Industry Revenue (Million) Forecast, by Application 2019 & 2032
- Table 22: Germany HPLC Brand Industry Volume (K Unit) Forecast, by Application 2019 & 2032
- Table 23: United Kingdom HPLC Brand Industry Revenue (Million) Forecast, by Application 2019 & 2032
- Table 24: United Kingdom HPLC Brand Industry Volume (K Unit) Forecast, by Application 2019 & 2032
- Table 25: France HPLC Brand Industry Revenue (Million) Forecast, by Application 2019 & 2032
- Table 26: France HPLC Brand Industry Volume (K Unit) Forecast, by Application 2019 & 2032
- Table 27: Italy HPLC Brand Industry Revenue (Million) Forecast, by Application 2019 & 2032
- Table 28: Italy HPLC Brand Industry Volume (K Unit) Forecast, by Application 2019 & 2032
- Table 29: Spain HPLC Brand Industry Revenue (Million) Forecast, by Application 2019 & 2032
- Table 30: Spain HPLC Brand Industry Volume (K Unit) Forecast, by Application 2019 & 2032
- Table 31: Rest of Europe HPLC Brand Industry Revenue (Million) Forecast, by Application 2019 & 2032
- Table 32: Rest of Europe HPLC Brand Industry Volume (K Unit) Forecast, by Application 2019 & 2032
- Table 33: Global HPLC Brand Industry Revenue Million Forecast, by Country 2019 & 2032
- Table 34: Global HPLC Brand Industry Volume K Unit Forecast, by Country 2019 & 2032
- Table 35: China HPLC Brand Industry Revenue (Million) Forecast, by Application 2019 & 2032
- Table 36: China HPLC Brand Industry Volume (K Unit) Forecast, by Application 2019 & 2032
- Table 37: Japan HPLC Brand Industry Revenue (Million) Forecast, by Application 2019 & 2032
- Table 38: Japan HPLC Brand Industry Volume (K Unit) Forecast, by Application 2019 & 2032
- Table 39: India HPLC Brand Industry Revenue (Million) Forecast, by Application 2019 & 2032
- Table 40: India HPLC Brand Industry Volume (K Unit) Forecast, by Application 2019 & 2032
- Table 41: Australia HPLC Brand Industry Revenue (Million) Forecast, by Application 2019 & 2032
- Table 42: Australia HPLC Brand Industry Volume (K Unit) Forecast, by Application 2019 & 2032
- Table 43: South Korea HPLC Brand Industry Revenue (Million) Forecast, by Application 2019 & 2032
- Table 44: South Korea HPLC Brand Industry Volume (K Unit) Forecast, by Application 2019 & 2032
- Table 45: Rest of Asia Pacific HPLC Brand Industry Revenue (Million) Forecast, by Application 2019 & 2032
- Table 46: Rest of Asia Pacific HPLC Brand Industry Volume (K Unit) Forecast, by Application 2019 & 2032
- Table 47: Global HPLC Brand Industry Revenue Million Forecast, by Country 2019 & 2032
- Table 48: Global HPLC Brand Industry Volume K Unit Forecast, by Country 2019 & 2032
- Table 49: GCC HPLC Brand Industry Revenue (Million) Forecast, by Application 2019 & 2032
- Table 50: GCC HPLC Brand Industry Volume (K Unit) Forecast, by Application 2019 & 2032
- Table 51: South Africa HPLC Brand Industry Revenue (Million) Forecast, by Application 2019 & 2032
- Table 52: South Africa HPLC Brand Industry Volume (K Unit) Forecast, by Application 2019 & 2032
- Table 53: Rest of Middle East and Africa HPLC Brand Industry Revenue (Million) Forecast, by Application 2019 & 2032
- Table 54: Rest of Middle East and Africa HPLC Brand Industry Volume (K Unit) Forecast, by Application 2019 & 2032
- Table 55: Global HPLC Brand Industry Revenue Million Forecast, by Country 2019 & 2032
- Table 56: Global HPLC Brand Industry Volume K Unit Forecast, by Country 2019 & 2032
- Table 57: Brazil HPLC Brand Industry Revenue (Million) Forecast, by Application 2019 & 2032
- Table 58: Brazil HPLC Brand Industry Volume (K Unit) Forecast, by Application 2019 & 2032
- Table 59: Argentina HPLC Brand Industry Revenue (Million) Forecast, by Application 2019 & 2032
- Table 60: Argentina HPLC Brand Industry Volume (K Unit) Forecast, by Application 2019 & 2032
- Table 61: Rest of South America HPLC Brand Industry Revenue (Million) Forecast, by Application 2019 & 2032
- Table 62: Rest of South America HPLC Brand Industry Volume (K Unit) Forecast, by Application 2019 & 2032
- Table 63: Global HPLC Brand Industry Revenue Million Forecast, by Product Type 2019 & 2032
- Table 64: Global HPLC Brand Industry Volume K Unit Forecast, by Product Type 2019 & 2032
- Table 65: Global HPLC Brand Industry Revenue Million Forecast, by Application 2019 & 2032
- Table 66: Global HPLC Brand Industry Volume K Unit Forecast, by Application 2019 & 2032
- Table 67: Global HPLC Brand Industry Revenue Million Forecast, by End User 2019 & 2032
- Table 68: Global HPLC Brand Industry Volume K Unit Forecast, by End User 2019 & 2032
- Table 69: Global HPLC Brand Industry Revenue Million Forecast, by Country 2019 & 2032
- Table 70: Global HPLC Brand Industry Volume K Unit Forecast, by Country 2019 & 2032
- Table 71: United States HPLC Brand Industry Revenue (Million) Forecast, by Application 2019 & 2032
- Table 72: United States HPLC Brand Industry Volume (K Unit) Forecast, by Application 2019 & 2032
- Table 73: Canada HPLC Brand Industry Revenue (Million) Forecast, by Application 2019 & 2032
- Table 74: Canada HPLC Brand Industry Volume (K Unit) Forecast, by Application 2019 & 2032
- Table 75: Mexico HPLC Brand Industry Revenue (Million) Forecast, by Application 2019 & 2032
- Table 76: Mexico HPLC Brand Industry Volume (K Unit) Forecast, by Application 2019 & 2032
- Table 77: Global HPLC Brand Industry Revenue Million Forecast, by Product Type 2019 & 2032
- Table 78: Global HPLC Brand Industry Volume K Unit Forecast, by Product Type 2019 & 2032
- Table 79: Global HPLC Brand Industry Revenue Million Forecast, by Application 2019 & 2032
- Table 80: Global HPLC Brand Industry Volume K Unit Forecast, by Application 2019 & 2032
- Table 81: Global HPLC Brand Industry Revenue Million Forecast, by End User 2019 & 2032
- Table 82: Global HPLC Brand Industry Volume K Unit Forecast, by End User 2019 & 2032
- Table 83: Global HPLC Brand Industry Revenue Million Forecast, by Country 2019 & 2032
- Table 84: Global HPLC Brand Industry Volume K Unit Forecast, by Country 2019 & 2032
- Table 85: Germany HPLC Brand Industry Revenue (Million) Forecast, by Application 2019 & 2032
- Table 86: Germany HPLC Brand Industry Volume (K Unit) Forecast, by Application 2019 & 2032
- Table 87: United Kingdom HPLC Brand Industry Revenue (Million) Forecast, by Application 2019 & 2032
- Table 88: United Kingdom HPLC Brand Industry Volume (K Unit) Forecast, by Application 2019 & 2032
- Table 89: France HPLC Brand Industry Revenue (Million) Forecast, by Application 2019 & 2032
- Table 90: France HPLC Brand Industry Volume (K Unit) Forecast, by Application 2019 & 2032
- Table 91: Italy HPLC Brand Industry Revenue (Million) Forecast, by Application 2019 & 2032
- Table 92: Italy HPLC Brand Industry Volume (K Unit) Forecast, by Application 2019 & 2032
- Table 93: Spain HPLC Brand Industry Revenue (Million) Forecast, by Application 2019 & 2032
- Table 94: Spain HPLC Brand Industry Volume (K Unit) Forecast, by Application 2019 & 2032
- Table 95: Rest of Europe HPLC Brand Industry Revenue (Million) Forecast, by Application 2019 & 2032
- Table 96: Rest of Europe HPLC Brand Industry Volume (K Unit) Forecast, by Application 2019 & 2032
- Table 97: Global HPLC Brand Industry Revenue Million Forecast, by Product Type 2019 & 2032
- Table 98: Global HPLC Brand Industry Volume K Unit Forecast, by Product Type 2019 & 2032
- Table 99: Global HPLC Brand Industry Revenue Million Forecast, by Application 2019 & 2032
- Table 100: Global HPLC Brand Industry Volume K Unit Forecast, by Application 2019 & 2032
- Table 101: Global HPLC Brand Industry Revenue Million Forecast, by End User 2019 & 2032
- Table 102: Global HPLC Brand Industry Volume K Unit Forecast, by End User 2019 & 2032
- Table 103: Global HPLC Brand Industry Revenue Million Forecast, by Country 2019 & 2032
- Table 104: Global HPLC Brand Industry Volume K Unit Forecast, by Country 2019 & 2032
- Table 105: China HPLC Brand Industry Revenue (Million) Forecast, by Application 2019 & 2032
- Table 106: China HPLC Brand Industry Volume (K Unit) Forecast, by Application 2019 & 2032
- Table 107: Japan HPLC Brand Industry Revenue (Million) Forecast, by Application 2019 & 2032
- Table 108: Japan HPLC Brand Industry Volume (K Unit) Forecast, by Application 2019 & 2032
- Table 109: India HPLC Brand Industry Revenue (Million) Forecast, by Application 2019 & 2032
- Table 110: India HPLC Brand Industry Volume (K Unit) Forecast, by Application 2019 & 2032
- Table 111: Australia HPLC Brand Industry Revenue (Million) Forecast, by Application 2019 & 2032
- Table 112: Australia HPLC Brand Industry Volume (K Unit) Forecast, by Application 2019 & 2032
- Table 113: South Korea HPLC Brand Industry Revenue (Million) Forecast, by Application 2019 & 2032
- Table 114: South Korea HPLC Brand Industry Volume (K Unit) Forecast, by Application 2019 & 2032
- Table 115: Rest of Asia Pacific HPLC Brand Industry Revenue (Million) Forecast, by Application 2019 & 2032
- Table 116: Rest of Asia Pacific HPLC Brand Industry Volume (K Unit) Forecast, by Application 2019 & 2032
- Table 117: Global HPLC Brand Industry Revenue Million Forecast, by Product Type 2019 & 2032
- Table 118: Global HPLC Brand Industry Volume K Unit Forecast, by Product Type 2019 & 2032
- Table 119: Global HPLC Brand Industry Revenue Million Forecast, by Application 2019 & 2032
- Table 120: Global HPLC Brand Industry Volume K Unit Forecast, by Application 2019 & 2032
- Table 121: Global HPLC Brand Industry Revenue Million Forecast, by End User 2019 & 2032
- Table 122: Global HPLC Brand Industry Volume K Unit Forecast, by End User 2019 & 2032
- Table 123: Global HPLC Brand Industry Revenue Million Forecast, by Country 2019 & 2032
- Table 124: Global HPLC Brand Industry Volume K Unit Forecast, by Country 2019 & 2032
- Table 125: GCC HPLC Brand Industry Revenue (Million) Forecast, by Application 2019 & 2032
- Table 126: GCC HPLC Brand Industry Volume (K Unit) Forecast, by Application 2019 & 2032
- Table 127: South Africa HPLC Brand Industry Revenue (Million) Forecast, by Application 2019 & 2032
- Table 128: South Africa HPLC Brand Industry Volume (K Unit) Forecast, by Application 2019 & 2032
- Table 129: Rest of Middle East and Africa HPLC Brand Industry Revenue (Million) Forecast, by Application 2019 & 2032
- Table 130: Rest of Middle East and Africa HPLC Brand Industry Volume (K Unit) Forecast, by Application 2019 & 2032
- Table 131: Global HPLC Brand Industry Revenue Million Forecast, by Product Type 2019 & 2032
- Table 132: Global HPLC Brand Industry Volume K Unit Forecast, by Product Type 2019 & 2032
- Table 133: Global HPLC Brand Industry Revenue Million Forecast, by Application 2019 & 2032
- Table 134: Global HPLC Brand Industry Volume K Unit Forecast, by Application 2019 & 2032
- Table 135: Global HPLC Brand Industry Revenue Million Forecast, by End User 2019 & 2032
- Table 136: Global HPLC Brand Industry Volume K Unit Forecast, by End User 2019 & 2032
- Table 137: Global HPLC Brand Industry Revenue Million Forecast, by Country 2019 & 2032
- Table 138: Global HPLC Brand Industry Volume K Unit Forecast, by Country 2019 & 2032
- Table 139: Brazil HPLC Brand Industry Revenue (Million) Forecast, by Application 2019 & 2032
- Table 140: Brazil HPLC Brand Industry Volume (K Unit) Forecast, by Application 2019 & 2032
- Table 141: Argentina HPLC Brand Industry Revenue (Million) Forecast, by Application 2019 & 2032
- Table 142: Argentina HPLC Brand Industry Volume (K Unit) Forecast, by Application 2019 & 2032
- Table 143: Rest of South America HPLC Brand Industry Revenue (Million) Forecast, by Application 2019 & 2032
- Table 144: Rest of South America HPLC Brand Industry Volume (K Unit) Forecast, by Application 2019 & 2032
Frequently Asked Questions
1. What is the projected Compound Annual Growth Rate (CAGR) of the HPLC Brand Industry?
The projected CAGR is approximately 4.45%.
2. Which companies are prominent players in the HPLC Brand Industry?
Key companies in the market include Bio-Rad Laboratories Inc, Merck KGaA, Mitsubishi Chemical Corporation, Hitachi High-Tech Corporation, Waters, Tosoh Corporation, Agilent Technologies Inc, Hamilton Company, PerkinElmer Inc, Gilson Inc, General Electric (Cytiva Life Sciences), Thermo Fisher Scientific, Shimadzu Corporation.
3. What are the main segments of the HPLC Brand Industry?
The market segments include Product Type, Application, End User.
4. Can you provide details about the market size?
The market size is estimated to be USD 5 Million as of 2022.
5. What are some drivers contributing to market growth?
Advancements in HPLC Technologies; The Surge in Usage of HPLC in Pharmaceutical and Biopharmaceutical Companies.
6. What are the notable trends driving market growth?
Consumables Segment is Expected to Hold a Significant Share in the High-Performance Liquid Chromatography (HPLC) Market.
7. Are there any restraints impacting market growth?
High Cost of the HPLC Systems; Lack of Skilled Professionals.
8. Can you provide examples of recent developments in the market?
Feb 2022: Shimadzu Corporation launched the Nexera XS inert high-performance liquid chromatograph globally. The Nexera XS inert incorporates rust-resistant materials and nonmetallic materials that limit the adsorption of molecules to provide stable measurements of biopharmaceuticals and medium molecule pharmaceuticals.
9. What pricing options are available for accessing the report?
Pricing options include single-user, multi-user, and enterprise licenses priced at USD 4750, USD 5250, and USD 8750 respectively.
10. Is the market size provided in terms of value or volume?
The market size is provided in terms of value, measured in Million and volume, measured in K Unit.
11. Are there any specific market keywords associated with the report?
Yes, the market keyword associated with the report is "HPLC Brand Industry," which aids in identifying and referencing the specific market segment covered.
12. How do I determine which pricing option suits my needs best?
The pricing options vary based on user requirements and access needs. Individual users may opt for single-user licenses, while businesses requiring broader access may choose multi-user or enterprise licenses for cost-effective access to the report.
13. Are there any additional resources or data provided in the HPLC Brand Industry report?
While the report offers comprehensive insights, it's advisable to review the specific contents or supplementary materials provided to ascertain if additional resources or data are available.
14. How can I stay updated on further developments or reports in the HPLC Brand Industry?
To stay informed about further developments, trends, and reports in the HPLC Brand Industry, consider subscribing to industry newsletters, following relevant companies and organizations, or regularly checking reputable industry news sources and publications.
Methodology
Step 1 - Identification of Relevant Samples Size from Population Database


Step 2 - Approaches for Defining Global Market Size (Value, Volume* & Price*)

Note*: In applicable scenarios
Step 3 - Data Sources
Primary Research
- Web Analytics
- Survey Reports
- Research Institute
- Latest Research Reports
- Opinion Leaders
Secondary Research
- Annual Reports
- White Paper
- Latest Press Release
- Industry Association
- Paid Database
- Investor Presentations

Step 4 - Data Triangulation
Involves using different sources of information in order to increase the validity of a study
These sources are likely to be stakeholders in a program - participants, other researchers, program staff, other community members, and so on.
Then we put all data in single framework & apply various statistical tools to find out the dynamic on the market.
During the analysis stage, feedback from the stakeholder groups would be compared to determine areas of agreement as well as areas of divergence
