

Key Insights
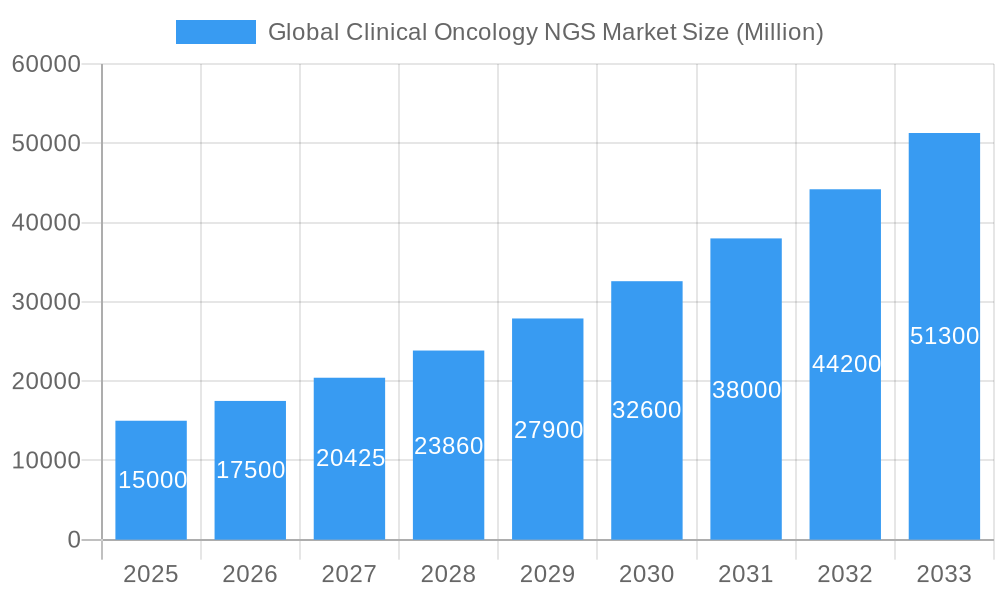
The global clinical oncology next-generation sequencing (NGS) market is poised for substantial expansion, propelled by the escalating incidence of cancer, continuous advancements in NGS technology, and the growing demand for personalized medicine. With a projected Compound Annual Growth Rate (CAGR) of 17.3%, the market is anticipated to reach 744.4 million by 2025. Key growth drivers include the increasing integration of NGS in cancer diagnostics for earlier and more precise detection, leading to enhanced patient outcomes and cost efficiencies. Technological innovations, such as improved sequencing accuracy, reduced costs, and accelerated turnaround times, are enhancing NGS accessibility for healthcare providers. The proliferation of companion diagnostics, leveraging NGS to guide targeted therapy selection, is another significant market stimulant. The market is segmented by technology (Whole Genome Sequencing, Whole Exome Sequencing, Targeted Sequencing & Resequencing), workflow (Pre-Sequencing, Sequencing, Data Analysis), application (Screening, Inherited Cancer, Companion Diagnostics, Other Diagnostics), and end-use (Hospitals, Clinics, Laboratories). North America currently leads the market share, attributed to its advanced healthcare infrastructure, high NGS adoption rates, and substantial R&D investments. However, the Asia Pacific region is expected to experience robust growth, driven by rising healthcare expenditures and increasing cancer prevalence in emerging economies.
Global Clinical Oncology NGS Market Market Size (In Million)
Market restraints, including the high cost of NGS testing, the requirement for specialized data analysis expertise, and regulatory challenges for diagnostic test approvals and reimbursements, are being addressed. Industry leaders such as Illumina, Thermo Fisher Scientific, and Roche are at the forefront of innovation, expanding market reach through strategic alliances. Continued development of more efficient and cost-effective NGS solutions, coupled with increased awareness of personalized cancer treatment benefits, will further fuel market growth. The integration of NGS into routine clinical practice is expected to become increasingly widespread, significantly contributing to market expansion.
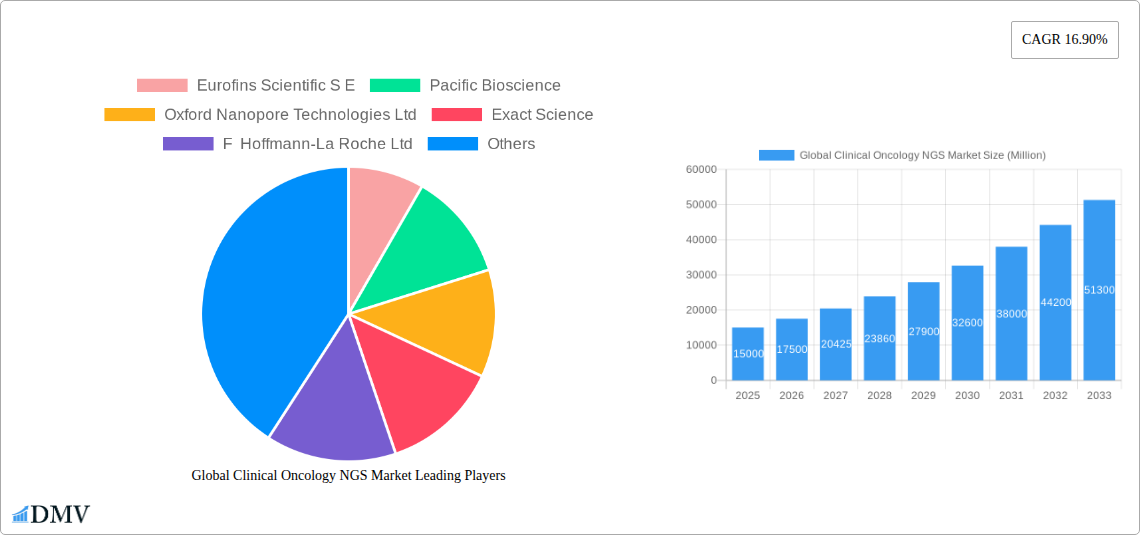
Global Clinical Oncology NGS Market Company Market Share
This report offers a detailed analysis of the global clinical oncology NGS market, providing critical insights for industry stakeholders. Covering the period from 2019 to 2033, with a specific focus on 2025, this study examines market dynamics, technological progress, and competitive landscapes to project future growth and opportunities. The market size is expected to reach approximately 744.4 million by 2025, underscoring significant growth potential.
Global Clinical Oncology NGS Market Composition & Trends
The global clinical oncology NGS market is characterized by a moderately concentrated landscape, with key players holding significant market share. Illumina Inc, Thermo Fisher Scientific, and Roche dominate, collectively accounting for an estimated 55% of the market in 2025. However, smaller, specialized companies are rapidly innovating, driving competition. Market share distribution is dynamic, influenced by technological advancements, regulatory approvals, and strategic mergers and acquisitions (M&A).
- Market Concentration: High, with top 5 players holding ~55% market share (2025).
- Innovation Catalysts: Advancements in sequencing technologies (e.g., long-read sequencing), bioinformatics, and AI-driven data analysis.
- Regulatory Landscape: Stringent regulatory pathways influence market entry and adoption, impacting growth trajectories.
- Substitute Products: Traditional methods like PCR and microarrays, though being gradually replaced, still exert some competitive pressure.
- End-User Profiles: Primarily hospitals, clinics, and specialized laboratories, with increasing adoption by research institutions.
- M&A Activities: Significant M&A activity observed in the past five years, with deal values exceeding xx Million, primarily focusing on expanding technological capabilities and market reach. Examples include (but are not exhaustive): [Insert specific examples of M&A deals with deal values if available, otherwise state "Specific deal values are not publicly available for all transactions."]
Global Clinical Oncology NGS Market Industry Evolution
The clinical oncology NGS market has experienced robust growth since 2019, driven by several factors. The increasing prevalence of cancer globally, coupled with the rising adoption of personalized medicine, has fueled demand for NGS-based diagnostics and companion diagnostics. Technological advancements, such as improved sequencing accuracy, faster turnaround times, and reduced costs, have also significantly contributed to market expansion. The market witnessed a Compound Annual Growth Rate (CAGR) of xx% between 2019 and 2024, and is projected to maintain a CAGR of xx% from 2025 to 2033. This growth is further propelled by the increasing integration of NGS into routine clinical workflows, facilitated by improvements in data analysis and interpretation. The shift in consumer demands towards more precise and personalized cancer treatment fuels the adoption of NGS-based solutions. The incorporation of artificial intelligence (AI) and machine learning (ML) in NGS data analysis is expected to further accelerate market growth in the forecast period.
Leading Regions, Countries, or Segments in Global Clinical Oncology NGS Market
North America currently dominates the global clinical oncology NGS market, driven by robust healthcare infrastructure, high adoption rates, and significant investments in research and development. Within the technology segments, Targeted Sequencing and Resequencing hold the largest market share, followed by Whole Exome Sequencing and Whole Genome Sequencing. The Sequencing workflow segment dominates due to the high volume of samples processed. In the application segment, Companion Diagnostics is the fastest-growing segment, fueled by the increased focus on personalized oncology treatments.
Key Drivers for North America's Dominance:
- High healthcare expenditure
- Early adoption of advanced technologies
- Strong regulatory support for innovative diagnostic tools
- Robust research ecosystem
Other Key Regional Trends:
- Europe showing steady growth driven by increasing cancer prevalence and healthcare infrastructure development.
- Asia-Pacific exhibiting strong potential, fueled by expanding healthcare infrastructure and rising disposable income.
Dominant Segments:
- Technology: Targeted Sequencing & Resequencing (largest market share)
- Workflow: Sequencing (highest volume)
- Application: Companion Diagnostics (highest growth)
Global Clinical Oncology NGS Market Product Innovations
Recent innovations focus on improving sequencing speed, accuracy, and affordability. Miniaturized sequencing platforms, improved library preparation methods, and cloud-based data analysis tools are enhancing workflow efficiency. The integration of AI and machine learning algorithms is revolutionizing data interpretation, improving diagnostic accuracy and enabling the identification of novel biomarkers for cancer diagnosis and treatment. Furthermore, advancements in long-read sequencing technologies enable the detection of complex structural variations, enhancing the comprehensive analysis of cancerous genomes.
Propelling Factors for Global Clinical Oncology NGS Market Growth
Several factors are driving the market's expansion, including:
- Technological Advancements: Improved sequencing technologies, reduced costs, and faster turnaround times are making NGS more accessible and cost-effective.
- Rising Cancer Prevalence: The global burden of cancer is increasing, driving demand for advanced diagnostic tools.
- Personalized Medicine: NGS plays a crucial role in enabling targeted therapies and personalized cancer treatment.
- Favorable Regulatory Environment: Increased regulatory support for NGS-based diagnostics in several countries is fostering market growth.
Obstacles in the Global Clinical Oncology NGS Market Market
The market faces several challenges:
- High Costs: The initial investment in NGS equipment and the cost of consumables can be substantial.
- Data Analysis Complexity: Analyzing NGS data requires specialized expertise, which can be a barrier for smaller laboratories.
- Regulatory Hurdles: Strict regulatory requirements for clinical diagnostics can slow down market entry.
- Competition: The market is highly competitive, with both large and small players vying for market share.
Future Opportunities in Global Clinical Oncology NGS Market
Future opportunities lie in:
- Liquid Biopsy: The adoption of liquid biopsy techniques using NGS is poised for significant growth.
- Early Cancer Detection: NGS has the potential to revolutionize early cancer detection through screening programs.
- Development of Novel Biomarkers: NGS facilitates the identification of novel biomarkers for cancer diagnosis and prognosis.
- Expansion into Emerging Markets: Growing healthcare infrastructure in developing countries presents significant opportunities.
Major Players in the Global Clinical Oncology NGS Market Ecosystem
- Eurofins Scientific S.E.
- Pacific Biosciences
- Oxford Nanopore Technologies Ltd
- Exact Sciences
- F. Hoffmann-La Roche Ltd
- Qiagen N.V.
- Foundation Medicine
- Myriad Genetics
- Illumina Inc
- Caris Life Sciences
- Thermo Fisher Scientific
- Agilent Technologies
- PerkinElmer
- Beijing Genomics Institute (BGI)
Key Developments in Global Clinical Oncology NGS Market Industry
- [Month, Year]: Illumina launches a new high-throughput sequencing platform, increasing market capacity.
- [Month, Year]: Roche receives FDA approval for a new NGS-based companion diagnostic.
- [Month, Year]: A major M&A event occurs in the industry involving two prominent NGS companies. (Insert details of specific M&A deals if available)
Strategic Global Clinical Oncology NGS Market Market Forecast
The global clinical oncology NGS market is poised for continued strong growth, driven by technological advancements, increasing cancer prevalence, and the growing adoption of personalized medicine. The emergence of new applications, such as liquid biopsies and early cancer detection, will create significant opportunities for market expansion. The integration of artificial intelligence and big data analytics will enhance diagnostic capabilities, leading to improved patient outcomes and further fueling market growth throughout the forecast period.
Global Clinical Oncology NGS Market Segmentation
-
1. Technology
- 1.1. Whole Genome Sequencing
- 1.2. Whole Exome Sequencing
- 1.3. Targeted Sequencing & Resequencing Centrifuges
-
2. Workflow
- 2.1. Pre-Sequencing
- 2.2. Data Analysis
-
3. Application
-
3.1. Screening
- 3.1.1. Sporadic Cancer
- 3.1.2. Inherited Cancer
- 3.2. Companion Diagnostics
- 3.3. Other Diagnostics
-
3.1. Screening
-
4. End-use
- 4.1. Hospitals
- 4.2. Clinics
- 4.3. Laboratories
Global Clinical Oncology NGS Market Segmentation By Geography
-
1. North America
- 1.1. United States
- 1.2. Canada
- 1.3. Mexico
-
2. Europe
- 2.1. Germany
- 2.2. United Kingdom
- 2.3. France
- 2.4. Italy
- 2.5. Spain
- 2.6. Rest of Europe
-
3. Asia Pacific
- 3.1. China
- 3.2. Japan
- 3.3. India
- 3.4. Australia
- 3.5. South Korea
- 3.6. Rest of Asia Pacific
-
4. Middle East and Africa
- 4.1. GCC
- 4.2. South Africa
- 4.3. Rest of Middle East and Africa
-
5. South America
- 5.1. Brazil
- 5.2. Argentina
- 5.3. Rest of South America
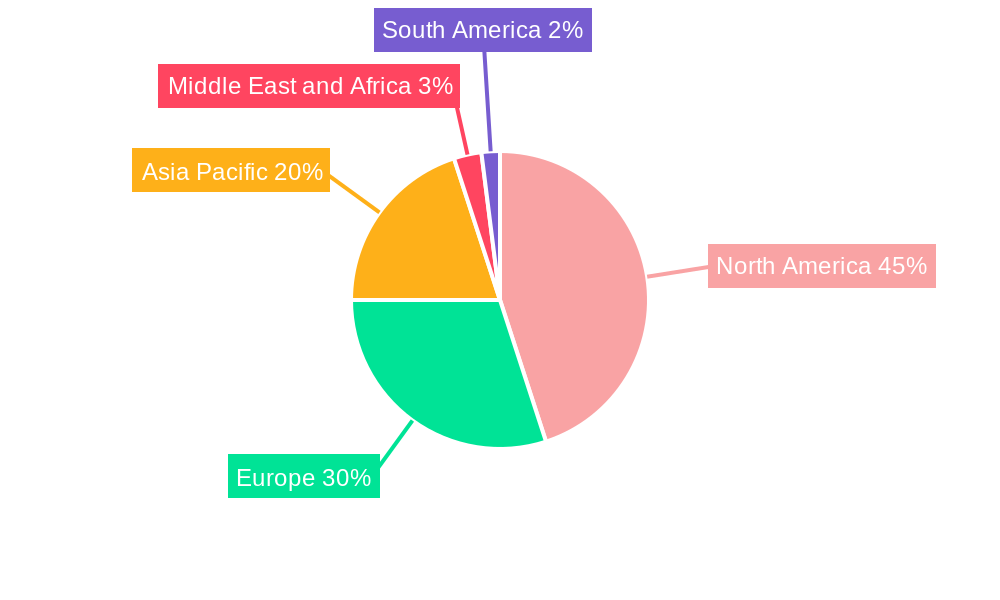
Global Clinical Oncology NGS Market Regional Market Share
Geographic Coverage of Global Clinical Oncology NGS Market
Global Clinical Oncology NGS Market REPORT HIGHLIGHTS
| Aspects | Details |
|---|---|
| Study Period | 2020-2034 |
| Base Year | 2025 |
| Estimated Year | 2026 |
| Forecast Period | 2026-2034 |
| Historical Period | 2020-2025 |
| Growth Rate | CAGR of 17.3% from 2020-2034 |
| Segmentation |
|
Table of Contents
- 1. Introduction
- 1.1. Research Scope
- 1.2. Market Segmentation
- 1.3. Research Objective
- 1.4. Definitions and Assumptions
- 2. Executive Summary
- 2.1. Market Snapshot
- 3. Market Dynamics
- 3.1. Market Drivers
- 3.2. Market Restrains
- 3.3. Market Trends
- 3.4. Market Opportunities
- 4. Market Factor Analysis
- 4.1. Porters Five Forces
- 4.1.1. Bargaining Power of Suppliers
- 4.1.2. Bargaining Power of Buyers
- 4.1.3. Threat of New Entrants
- 4.1.4. Threat of Substitutes
- 4.1.5. Competitive Rivalry
- 4.2. PESTEL analysis
- 4.3. BCG Analysis
- 4.3.1. Stars (High Growth, High Market Share)
- 4.3.2. Cash Cows (Low Growth, High Market Share)
- 4.3.3. Question Mark (High Growth, Low Market Share)
- 4.3.4. Dogs (Low Growth, Low Market Share)
- 4.4. Ansoff Matrix Analysis
- 4.5. Supply Chain Analysis
- 4.6. Regulatory Landscape
- 4.7. Current Market Potential and Opportunity Assessment (TAM–SAM–SOM Framework)
- 4.8. DMV Analyst Note
- 4.1. Porters Five Forces
- 5. Market Analysis, Insights and Forecast 2021-2033
- 5.1. Market Analysis, Insights and Forecast - by Technology
- 5.1.1. Whole Genome Sequencing
- 5.1.2. Whole Exome Sequencing
- 5.1.3. Targeted Sequencing & Resequencing Centrifuges
- 5.2. Market Analysis, Insights and Forecast - by Workflow
- 5.2.1. Pre-Sequencing
- 5.2.2. Data Analysis
- 5.3. Market Analysis, Insights and Forecast - by Application
- 5.3.1. Screening
- 5.3.1.1. Sporadic Cancer
- 5.3.1.2. Inherited Cancer
- 5.3.2. Companion Diagnostics
- 5.3.3. Other Diagnostics
- 5.3.1. Screening
- 5.4. Market Analysis, Insights and Forecast - by End-use
- 5.4.1. Hospitals
- 5.4.2. Clinics
- 5.4.3. Laboratories
- 5.5. Market Analysis, Insights and Forecast - by Region
- 5.5.1. North America
- 5.5.2. Europe
- 5.5.3. Asia Pacific
- 5.5.4. Middle East and Africa
- 5.5.5. South America
- 5.1. Market Analysis, Insights and Forecast - by Technology
- 6. Global Clinical Oncology NGS Market Analysis, Insights and Forecast, 2021-2033
- 6.1. Market Analysis, Insights and Forecast - by Technology
- 6.1.1. Whole Genome Sequencing
- 6.1.2. Whole Exome Sequencing
- 6.1.3. Targeted Sequencing & Resequencing Centrifuges
- 6.2. Market Analysis, Insights and Forecast - by Workflow
- 6.2.1. Pre-Sequencing
- 6.2.2. Data Analysis
- 6.3. Market Analysis, Insights and Forecast - by Application
- 6.3.1. Screening
- 6.3.1.1. Sporadic Cancer
- 6.3.1.2. Inherited Cancer
- 6.3.2. Companion Diagnostics
- 6.3.3. Other Diagnostics
- 6.3.1. Screening
- 6.4. Market Analysis, Insights and Forecast - by End-use
- 6.4.1. Hospitals
- 6.4.2. Clinics
- 6.4.3. Laboratories
- 6.1. Market Analysis, Insights and Forecast - by Technology
- 7. North America Global Clinical Oncology NGS Market Analysis, Insights and Forecast, 2020-2032
- 7.1. Market Analysis, Insights and Forecast - by Technology
- 7.1.1. Whole Genome Sequencing
- 7.1.2. Whole Exome Sequencing
- 7.1.3. Targeted Sequencing & Resequencing Centrifuges
- 7.2. Market Analysis, Insights and Forecast - by Workflow
- 7.2.1. Pre-Sequencing
- 7.2.2. Data Analysis
- 7.3. Market Analysis, Insights and Forecast - by Application
- 7.3.1. Screening
- 7.3.1.1. Sporadic Cancer
- 7.3.1.2. Inherited Cancer
- 7.3.2. Companion Diagnostics
- 7.3.3. Other Diagnostics
- 7.3.1. Screening
- 7.4. Market Analysis, Insights and Forecast - by End-use
- 7.4.1. Hospitals
- 7.4.2. Clinics
- 7.4.3. Laboratories
- 7.1. Market Analysis, Insights and Forecast - by Technology
- 8. Europe Global Clinical Oncology NGS Market Analysis, Insights and Forecast, 2020-2032
- 8.1. Market Analysis, Insights and Forecast - by Technology
- 8.1.1. Whole Genome Sequencing
- 8.1.2. Whole Exome Sequencing
- 8.1.3. Targeted Sequencing & Resequencing Centrifuges
- 8.2. Market Analysis, Insights and Forecast - by Workflow
- 8.2.1. Pre-Sequencing
- 8.2.2. Data Analysis
- 8.3. Market Analysis, Insights and Forecast - by Application
- 8.3.1. Screening
- 8.3.1.1. Sporadic Cancer
- 8.3.1.2. Inherited Cancer
- 8.3.2. Companion Diagnostics
- 8.3.3. Other Diagnostics
- 8.3.1. Screening
- 8.4. Market Analysis, Insights and Forecast - by End-use
- 8.4.1. Hospitals
- 8.4.2. Clinics
- 8.4.3. Laboratories
- 8.1. Market Analysis, Insights and Forecast - by Technology
- 9. Asia Pacific Global Clinical Oncology NGS Market Analysis, Insights and Forecast, 2020-2032
- 9.1. Market Analysis, Insights and Forecast - by Technology
- 9.1.1. Whole Genome Sequencing
- 9.1.2. Whole Exome Sequencing
- 9.1.3. Targeted Sequencing & Resequencing Centrifuges
- 9.2. Market Analysis, Insights and Forecast - by Workflow
- 9.2.1. Pre-Sequencing
- 9.2.2. Data Analysis
- 9.3. Market Analysis, Insights and Forecast - by Application
- 9.3.1. Screening
- 9.3.1.1. Sporadic Cancer
- 9.3.1.2. Inherited Cancer
- 9.3.2. Companion Diagnostics
- 9.3.3. Other Diagnostics
- 9.3.1. Screening
- 9.4. Market Analysis, Insights and Forecast - by End-use
- 9.4.1. Hospitals
- 9.4.2. Clinics
- 9.4.3. Laboratories
- 9.1. Market Analysis, Insights and Forecast - by Technology
- 10. Middle East and Africa Global Clinical Oncology NGS Market Analysis, Insights and Forecast, 2020-2032
- 10.1. Market Analysis, Insights and Forecast - by Technology
- 10.1.1. Whole Genome Sequencing
- 10.1.2. Whole Exome Sequencing
- 10.1.3. Targeted Sequencing & Resequencing Centrifuges
- 10.2. Market Analysis, Insights and Forecast - by Workflow
- 10.2.1. Pre-Sequencing
- 10.2.2. Data Analysis
- 10.3. Market Analysis, Insights and Forecast - by Application
- 10.3.1. Screening
- 10.3.1.1. Sporadic Cancer
- 10.3.1.2. Inherited Cancer
- 10.3.2. Companion Diagnostics
- 10.3.3. Other Diagnostics
- 10.3.1. Screening
- 10.4. Market Analysis, Insights and Forecast - by End-use
- 10.4.1. Hospitals
- 10.4.2. Clinics
- 10.4.3. Laboratories
- 10.1. Market Analysis, Insights and Forecast - by Technology
- 11. South America Global Clinical Oncology NGS Market Analysis, Insights and Forecast, 2020-2032
- 11.1. Market Analysis, Insights and Forecast - by Technology
- 11.1.1. Whole Genome Sequencing
- 11.1.2. Whole Exome Sequencing
- 11.1.3. Targeted Sequencing & Resequencing Centrifuges
- 11.2. Market Analysis, Insights and Forecast - by Workflow
- 11.2.1. Pre-Sequencing
- 11.2.2. Data Analysis
- 11.3. Market Analysis, Insights and Forecast - by Application
- 11.3.1. Screening
- 11.3.1.1. Sporadic Cancer
- 11.3.1.2. Inherited Cancer
- 11.3.2. Companion Diagnostics
- 11.3.3. Other Diagnostics
- 11.3.1. Screening
- 11.4. Market Analysis, Insights and Forecast - by End-use
- 11.4.1. Hospitals
- 11.4.2. Clinics
- 11.4.3. Laboratories
- 11.1. Market Analysis, Insights and Forecast - by Technology
- 12. Competitive Analysis
- 12.1. Company Profiles
- 12.1.1 Eurofins Scientific S E
- 12.1.1.1. Company Overview
- 12.1.1.2. Products
- 12.1.1.3. Company Financials
- 12.1.1.4. SWOT Analysis
- 12.1.2 Pacific Bioscience
- 12.1.2.1. Company Overview
- 12.1.2.2. Products
- 12.1.2.3. Company Financials
- 12.1.2.4. SWOT Analysis
- 12.1.3 Oxford Nanopore Technologies Ltd
- 12.1.3.1. Company Overview
- 12.1.3.2. Products
- 12.1.3.3. Company Financials
- 12.1.3.4. SWOT Analysis
- 12.1.4 Exact Science
- 12.1.4.1. Company Overview
- 12.1.4.2. Products
- 12.1.4.3. Company Financials
- 12.1.4.4. SWOT Analysis
- 12.1.5 F Hoffmann-La Roche Ltd
- 12.1.5.1. Company Overview
- 12.1.5.2. Products
- 12.1.5.3. Company Financials
- 12.1.5.4. SWOT Analysis
- 12.1.6 Partek Inc
- 12.1.6.1. Company Overview
- 12.1.6.2. Products
- 12.1.6.3. Company Financials
- 12.1.6.4. SWOT Analysis
- 12.1.7 Qiagen N V *List Not Exhaustive
- 12.1.7.1. Company Overview
- 12.1.7.2. Products
- 12.1.7.3. Company Financials
- 12.1.7.4. SWOT Analysis
- 12.1.8 Foundation Medicine
- 12.1.8.1. Company Overview
- 12.1.8.2. Products
- 12.1.8.3. Company Financials
- 12.1.8.4. SWOT Analysis
- 12.1.9 Myriad Genetics
- 12.1.9.1. Company Overview
- 12.1.9.2. Products
- 12.1.9.3. Company Financials
- 12.1.9.4. SWOT Analysis
- 12.1.10 Illumina Inc
- 12.1.10.1. Company Overview
- 12.1.10.2. Products
- 12.1.10.3. Company Financials
- 12.1.10.4. SWOT Analysis
- 12.1.11 Caris Life Sciences
- 12.1.11.1. Company Overview
- 12.1.11.2. Products
- 12.1.11.3. Company Financials
- 12.1.11.4. SWOT Analysis
- 12.1.12 Thermo Fisher Scientific
- 12.1.12.1. Company Overview
- 12.1.12.2. Products
- 12.1.12.3. Company Financials
- 12.1.12.4. SWOT Analysis
- 12.1.13 Agilent Technologies
- 12.1.13.1. Company Overview
- 12.1.13.2. Products
- 12.1.13.3. Company Financials
- 12.1.13.4. SWOT Analysis
- 12.1.14 Perkin Elmer
- 12.1.14.1. Company Overview
- 12.1.14.2. Products
- 12.1.14.3. Company Financials
- 12.1.14.4. SWOT Analysis
- 12.1.15 Beijing Genomics Institute (BGI)
- 12.1.15.1. Company Overview
- 12.1.15.2. Products
- 12.1.15.3. Company Financials
- 12.1.15.4. SWOT Analysis
- 12.1.1 Eurofins Scientific S E
- 12.2. Market Entropy
- 12.2.1 Company's Key Areas Served
- 12.2.2 Recent Developments
- 12.3. Company Market Share Analysis 2025
- 12.3.1 Top 5 Companies Market Share Analysis
- 12.3.2 Top 3 Companies Market Share Analysis
- 12.4. List of Potential Customers
- 13. Research Methodology
List of Figures
- Figure 1: Global Global Clinical Oncology NGS Market Revenue Breakdown (million, %) by Region 2025 & 2033
- Figure 2: North America Global Clinical Oncology NGS Market Revenue (million), by Technology 2025 & 2033
- Figure 3: North America Global Clinical Oncology NGS Market Revenue Share (%), by Technology 2025 & 2033
- Figure 4: North America Global Clinical Oncology NGS Market Revenue (million), by Workflow 2025 & 2033
- Figure 5: North America Global Clinical Oncology NGS Market Revenue Share (%), by Workflow 2025 & 2033
- Figure 6: North America Global Clinical Oncology NGS Market Revenue (million), by Application 2025 & 2033
- Figure 7: North America Global Clinical Oncology NGS Market Revenue Share (%), by Application 2025 & 2033
- Figure 8: North America Global Clinical Oncology NGS Market Revenue (million), by End-use 2025 & 2033
- Figure 9: North America Global Clinical Oncology NGS Market Revenue Share (%), by End-use 2025 & 2033
- Figure 10: North America Global Clinical Oncology NGS Market Revenue (million), by Country 2025 & 2033
- Figure 11: North America Global Clinical Oncology NGS Market Revenue Share (%), by Country 2025 & 2033
- Figure 12: Europe Global Clinical Oncology NGS Market Revenue (million), by Technology 2025 & 2033
- Figure 13: Europe Global Clinical Oncology NGS Market Revenue Share (%), by Technology 2025 & 2033
- Figure 14: Europe Global Clinical Oncology NGS Market Revenue (million), by Workflow 2025 & 2033
- Figure 15: Europe Global Clinical Oncology NGS Market Revenue Share (%), by Workflow 2025 & 2033
- Figure 16: Europe Global Clinical Oncology NGS Market Revenue (million), by Application 2025 & 2033
- Figure 17: Europe Global Clinical Oncology NGS Market Revenue Share (%), by Application 2025 & 2033
- Figure 18: Europe Global Clinical Oncology NGS Market Revenue (million), by End-use 2025 & 2033
- Figure 19: Europe Global Clinical Oncology NGS Market Revenue Share (%), by End-use 2025 & 2033
- Figure 20: Europe Global Clinical Oncology NGS Market Revenue (million), by Country 2025 & 2033
- Figure 21: Europe Global Clinical Oncology NGS Market Revenue Share (%), by Country 2025 & 2033
- Figure 22: Asia Pacific Global Clinical Oncology NGS Market Revenue (million), by Technology 2025 & 2033
- Figure 23: Asia Pacific Global Clinical Oncology NGS Market Revenue Share (%), by Technology 2025 & 2033
- Figure 24: Asia Pacific Global Clinical Oncology NGS Market Revenue (million), by Workflow 2025 & 2033
- Figure 25: Asia Pacific Global Clinical Oncology NGS Market Revenue Share (%), by Workflow 2025 & 2033
- Figure 26: Asia Pacific Global Clinical Oncology NGS Market Revenue (million), by Application 2025 & 2033
- Figure 27: Asia Pacific Global Clinical Oncology NGS Market Revenue Share (%), by Application 2025 & 2033
- Figure 28: Asia Pacific Global Clinical Oncology NGS Market Revenue (million), by End-use 2025 & 2033
- Figure 29: Asia Pacific Global Clinical Oncology NGS Market Revenue Share (%), by End-use 2025 & 2033
- Figure 30: Asia Pacific Global Clinical Oncology NGS Market Revenue (million), by Country 2025 & 2033
- Figure 31: Asia Pacific Global Clinical Oncology NGS Market Revenue Share (%), by Country 2025 & 2033
- Figure 32: Middle East and Africa Global Clinical Oncology NGS Market Revenue (million), by Technology 2025 & 2033
- Figure 33: Middle East and Africa Global Clinical Oncology NGS Market Revenue Share (%), by Technology 2025 & 2033
- Figure 34: Middle East and Africa Global Clinical Oncology NGS Market Revenue (million), by Workflow 2025 & 2033
- Figure 35: Middle East and Africa Global Clinical Oncology NGS Market Revenue Share (%), by Workflow 2025 & 2033
- Figure 36: Middle East and Africa Global Clinical Oncology NGS Market Revenue (million), by Application 2025 & 2033
- Figure 37: Middle East and Africa Global Clinical Oncology NGS Market Revenue Share (%), by Application 2025 & 2033
- Figure 38: Middle East and Africa Global Clinical Oncology NGS Market Revenue (million), by End-use 2025 & 2033
- Figure 39: Middle East and Africa Global Clinical Oncology NGS Market Revenue Share (%), by End-use 2025 & 2033
- Figure 40: Middle East and Africa Global Clinical Oncology NGS Market Revenue (million), by Country 2025 & 2033
- Figure 41: Middle East and Africa Global Clinical Oncology NGS Market Revenue Share (%), by Country 2025 & 2033
- Figure 42: South America Global Clinical Oncology NGS Market Revenue (million), by Technology 2025 & 2033
- Figure 43: South America Global Clinical Oncology NGS Market Revenue Share (%), by Technology 2025 & 2033
- Figure 44: South America Global Clinical Oncology NGS Market Revenue (million), by Workflow 2025 & 2033
- Figure 45: South America Global Clinical Oncology NGS Market Revenue Share (%), by Workflow 2025 & 2033
- Figure 46: South America Global Clinical Oncology NGS Market Revenue (million), by Application 2025 & 2033
- Figure 47: South America Global Clinical Oncology NGS Market Revenue Share (%), by Application 2025 & 2033
- Figure 48: South America Global Clinical Oncology NGS Market Revenue (million), by End-use 2025 & 2033
- Figure 49: South America Global Clinical Oncology NGS Market Revenue Share (%), by End-use 2025 & 2033
- Figure 50: South America Global Clinical Oncology NGS Market Revenue (million), by Country 2025 & 2033
- Figure 51: South America Global Clinical Oncology NGS Market Revenue Share (%), by Country 2025 & 2033
List of Tables
- Table 1: Global Clinical Oncology NGS Market Revenue million Forecast, by Technology 2020 & 2033
- Table 2: Global Clinical Oncology NGS Market Revenue million Forecast, by Workflow 2020 & 2033
- Table 3: Global Clinical Oncology NGS Market Revenue million Forecast, by Application 2020 & 2033
- Table 4: Global Clinical Oncology NGS Market Revenue million Forecast, by End-use 2020 & 2033
- Table 5: Global Clinical Oncology NGS Market Revenue million Forecast, by Region 2020 & 2033
- Table 6: Global Clinical Oncology NGS Market Revenue million Forecast, by Technology 2020 & 2033
- Table 7: Global Clinical Oncology NGS Market Revenue million Forecast, by Workflow 2020 & 2033
- Table 8: Global Clinical Oncology NGS Market Revenue million Forecast, by Application 2020 & 2033
- Table 9: Global Clinical Oncology NGS Market Revenue million Forecast, by End-use 2020 & 2033
- Table 10: Global Clinical Oncology NGS Market Revenue million Forecast, by Country 2020 & 2033
- Table 11: United States Global Clinical Oncology NGS Market Revenue (million) Forecast, by Application 2020 & 2033
- Table 12: Canada Global Clinical Oncology NGS Market Revenue (million) Forecast, by Application 2020 & 2033
- Table 13: Mexico Global Clinical Oncology NGS Market Revenue (million) Forecast, by Application 2020 & 2033
- Table 14: Global Clinical Oncology NGS Market Revenue million Forecast, by Technology 2020 & 2033
- Table 15: Global Clinical Oncology NGS Market Revenue million Forecast, by Workflow 2020 & 2033
- Table 16: Global Clinical Oncology NGS Market Revenue million Forecast, by Application 2020 & 2033
- Table 17: Global Clinical Oncology NGS Market Revenue million Forecast, by End-use 2020 & 2033
- Table 18: Global Clinical Oncology NGS Market Revenue million Forecast, by Country 2020 & 2033
- Table 19: Germany Global Clinical Oncology NGS Market Revenue (million) Forecast, by Application 2020 & 2033
- Table 20: United Kingdom Global Clinical Oncology NGS Market Revenue (million) Forecast, by Application 2020 & 2033
- Table 21: France Global Clinical Oncology NGS Market Revenue (million) Forecast, by Application 2020 & 2033
- Table 22: Italy Global Clinical Oncology NGS Market Revenue (million) Forecast, by Application 2020 & 2033
- Table 23: Spain Global Clinical Oncology NGS Market Revenue (million) Forecast, by Application 2020 & 2033
- Table 24: Rest of Europe Global Clinical Oncology NGS Market Revenue (million) Forecast, by Application 2020 & 2033
- Table 25: Global Clinical Oncology NGS Market Revenue million Forecast, by Technology 2020 & 2033
- Table 26: Global Clinical Oncology NGS Market Revenue million Forecast, by Workflow 2020 & 2033
- Table 27: Global Clinical Oncology NGS Market Revenue million Forecast, by Application 2020 & 2033
- Table 28: Global Clinical Oncology NGS Market Revenue million Forecast, by End-use 2020 & 2033
- Table 29: Global Clinical Oncology NGS Market Revenue million Forecast, by Country 2020 & 2033
- Table 30: China Global Clinical Oncology NGS Market Revenue (million) Forecast, by Application 2020 & 2033
- Table 31: Japan Global Clinical Oncology NGS Market Revenue (million) Forecast, by Application 2020 & 2033
- Table 32: India Global Clinical Oncology NGS Market Revenue (million) Forecast, by Application 2020 & 2033
- Table 33: Australia Global Clinical Oncology NGS Market Revenue (million) Forecast, by Application 2020 & 2033
- Table 34: South Korea Global Clinical Oncology NGS Market Revenue (million) Forecast, by Application 2020 & 2033
- Table 35: Rest of Asia Pacific Global Clinical Oncology NGS Market Revenue (million) Forecast, by Application 2020 & 2033
- Table 36: Global Clinical Oncology NGS Market Revenue million Forecast, by Technology 2020 & 2033
- Table 37: Global Clinical Oncology NGS Market Revenue million Forecast, by Workflow 2020 & 2033
- Table 38: Global Clinical Oncology NGS Market Revenue million Forecast, by Application 2020 & 2033
- Table 39: Global Clinical Oncology NGS Market Revenue million Forecast, by End-use 2020 & 2033
- Table 40: Global Clinical Oncology NGS Market Revenue million Forecast, by Country 2020 & 2033
- Table 41: GCC Global Clinical Oncology NGS Market Revenue (million) Forecast, by Application 2020 & 2033
- Table 42: South Africa Global Clinical Oncology NGS Market Revenue (million) Forecast, by Application 2020 & 2033
- Table 43: Rest of Middle East and Africa Global Clinical Oncology NGS Market Revenue (million) Forecast, by Application 2020 & 2033
- Table 44: Global Clinical Oncology NGS Market Revenue million Forecast, by Technology 2020 & 2033
- Table 45: Global Clinical Oncology NGS Market Revenue million Forecast, by Workflow 2020 & 2033
- Table 46: Global Clinical Oncology NGS Market Revenue million Forecast, by Application 2020 & 2033
- Table 47: Global Clinical Oncology NGS Market Revenue million Forecast, by End-use 2020 & 2033
- Table 48: Global Clinical Oncology NGS Market Revenue million Forecast, by Country 2020 & 2033
- Table 49: Brazil Global Clinical Oncology NGS Market Revenue (million) Forecast, by Application 2020 & 2033
- Table 50: Argentina Global Clinical Oncology NGS Market Revenue (million) Forecast, by Application 2020 & 2033
- Table 51: Rest of South America Global Clinical Oncology NGS Market Revenue (million) Forecast, by Application 2020 & 2033
Frequently Asked Questions
1. What is the projected Compound Annual Growth Rate (CAGR) of the Global Clinical Oncology NGS Market?
The projected CAGR is approximately 17.3%.
2. Which companies are prominent players in the Global Clinical Oncology NGS Market?
Key companies in the market include Eurofins Scientific S E, Pacific Bioscience, Oxford Nanopore Technologies Ltd, Exact Science, F Hoffmann-La Roche Ltd, Partek Inc, Qiagen N V *List Not Exhaustive, Foundation Medicine, Myriad Genetics, Illumina Inc, Caris Life Sciences, Thermo Fisher Scientific, Agilent Technologies, Perkin Elmer, Beijing Genomics Institute (BGI).
3. What are the main segments of the Global Clinical Oncology NGS Market?
The market segments include Technology, Workflow, Application, End-use.
4. Can you provide details about the market size?
The market size is estimated to be USD 744.4 million as of 2022.
5. What are some drivers contributing to market growth?
Advancements in the Field of Personalized Medicine; Rising Burden of Cancer; Decrease in Costs for Genetic Sequencing.
6. What are the notable trends driving market growth?
Whole Genome Sequencing is Expected to Projected Significant Growth Over the Forecast Period..
7. Are there any restraints impacting market growth?
Lack of computational efficiency for data management; Inadequate Reimbursement Policy.
8. Can you provide examples of recent developments in the market?
N/A
9. What pricing options are available for accessing the report?
Pricing options include single-user, multi-user, and enterprise licenses priced at USD 4750, USD 5250, and USD 8750 respectively.
10. Is the market size provided in terms of value or volume?
The market size is provided in terms of value, measured in million.
11. Are there any specific market keywords associated with the report?
Yes, the market keyword associated with the report is "Global Clinical Oncology NGS Market," which aids in identifying and referencing the specific market segment covered.
12. How do I determine which pricing option suits my needs best?
The pricing options vary based on user requirements and access needs. Individual users may opt for single-user licenses, while businesses requiring broader access may choose multi-user or enterprise licenses for cost-effective access to the report.
13. Are there any additional resources or data provided in the Global Clinical Oncology NGS Market report?
While the report offers comprehensive insights, it's advisable to review the specific contents or supplementary materials provided to ascertain if additional resources or data are available.
14. How can I stay updated on further developments or reports in the Global Clinical Oncology NGS Market?
To stay informed about further developments, trends, and reports in the Global Clinical Oncology NGS Market, consider subscribing to industry newsletters, following relevant companies and organizations, or regularly checking reputable industry news sources and publications.
Methodology
Step 1 - Identification of Relevant Samples Size from Population Database


Step 2 - Approaches for Defining Global Market Size (Value, Volume* & Price*)

Note*: In applicable scenarios
Step 3 - Data Sources
Primary Research
- Web Analytics
- Survey Reports
- Research Institute
- Latest Research Reports
- Opinion Leaders
Secondary Research
- Annual Reports
- White Paper
- Latest Press Release
- Industry Association
- Paid Database
- Investor Presentations

Step 4 - Data Triangulation
Involves using different sources of information in order to increase the validity of a study
These sources are likely to be stakeholders in a program - participants, other researchers, program staff, other community members, and so on.
Then we put all data in single framework & apply various statistical tools to find out the dynamic on the market.
During the analysis stage, feedback from the stakeholder groups would be compared to determine areas of agreement as well as areas of divergence