

Key Insights
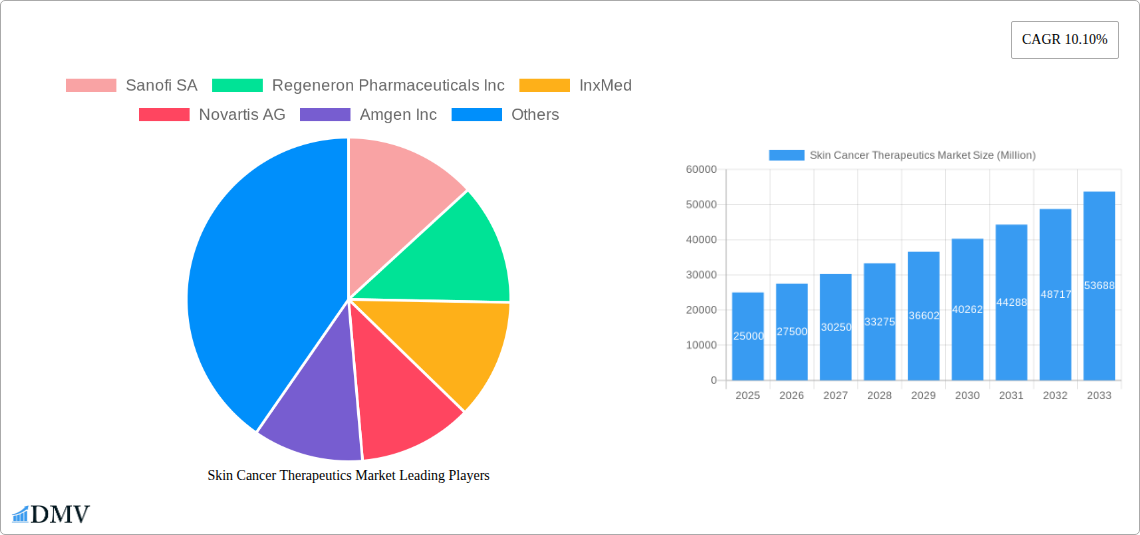
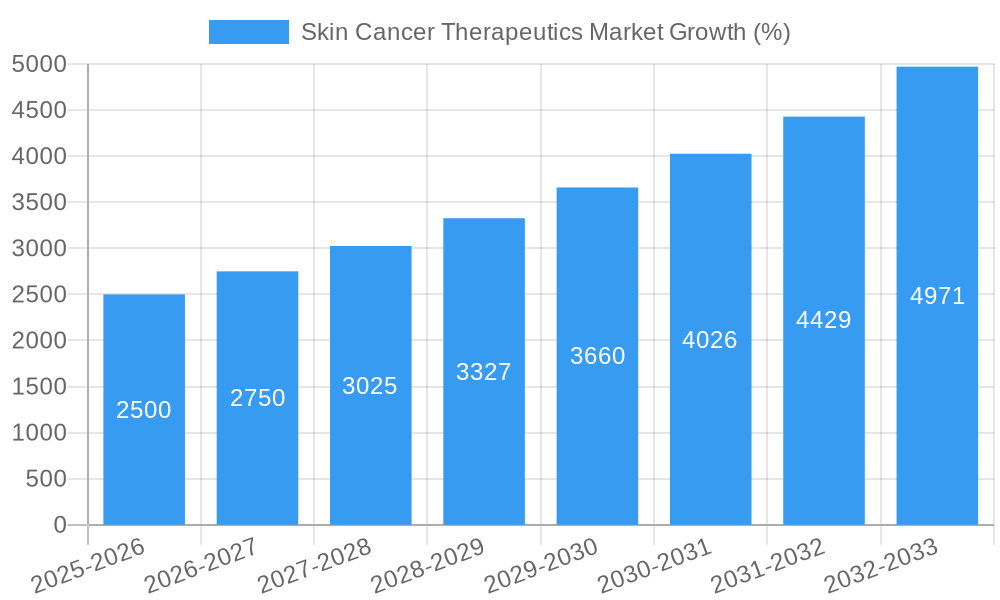
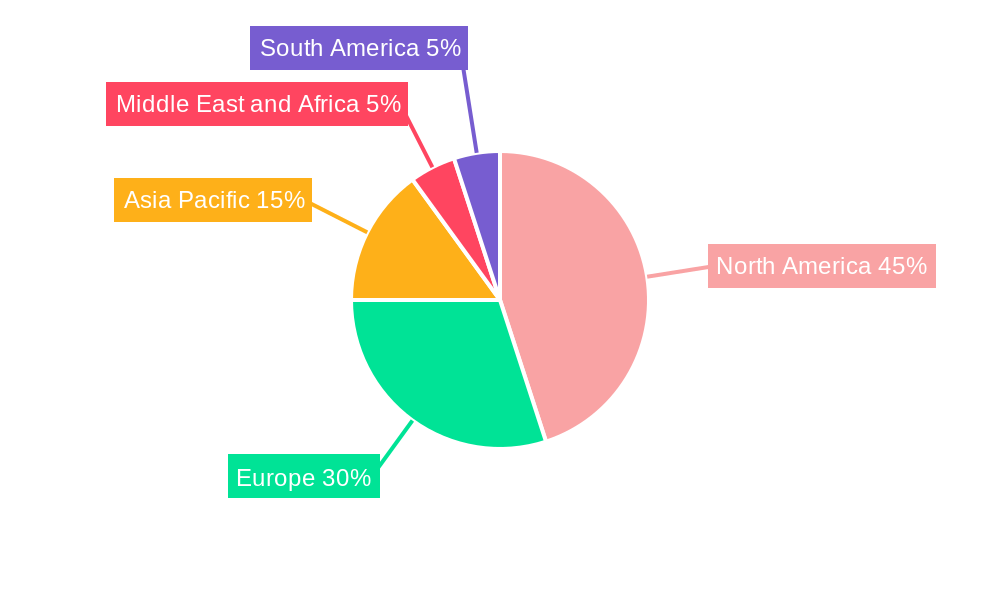
The global skin cancer therapeutics market, exhibiting a robust CAGR of 10.1% from 2019 to 2024, is poised for continued expansion throughout the forecast period (2025-2033). Driven by rising skin cancer incidence rates worldwide, advancements in targeted therapies and immunotherapies, and an aging global population increasingly susceptible to the disease, the market is projected to reach significant value. The increasing prevalence of melanoma and non-melanoma skin cancers, particularly in regions with high UV radiation exposure, fuels market growth. Treatment modalities such as chemotherapy, immunotherapy, and targeted therapy continue to dominate the market, with immunotherapy showing particularly strong growth due to its effectiveness in treating advanced-stage skin cancers. However, high treatment costs, potential side effects associated with some therapies, and the complexities of developing effective treatments for drug-resistant cancers represent key restraints. The market is segmented by treatment type (chemotherapy, immunotherapy, targeted therapy, and others) and disease type (melanoma and non-melanoma), providing a detailed understanding of market dynamics across various segments. Regional analysis reveals significant market contributions from North America and Europe, driven by advanced healthcare infrastructure and higher per capita healthcare expenditure. However, Asia Pacific is expected to show robust growth in the coming years, fueled by rising awareness, improving healthcare access, and a growing population. Pharmaceutical giants like Sanofi, Regeneron, Novartis, and Merck, alongside emerging biotech companies, are actively involved in research, development, and commercialization within this competitive market.
The future of the skin cancer therapeutics market hinges on several key factors. Continued innovation in treatment approaches, including the development of personalized medicine and novel drug delivery systems, will be crucial. Additionally, efforts to improve patient access to affordable and effective therapies, particularly in developing regions, are essential for sustained market growth. Regulatory approvals, reimbursement policies, and ongoing clinical trials also play a significant role in shaping the market landscape. The growing emphasis on early detection and prevention strategies can also positively impact market trends by reducing the burden of advanced-stage skin cancers. This dynamic interplay of factors necessitates a comprehensive approach to understanding and navigating the skin cancer therapeutics market.
Skin Cancer Therapeutics Market: A Comprehensive Report (2019-2033)
This insightful report provides a detailed analysis of the global Skin Cancer Therapeutics Market, offering a comprehensive overview of market dynamics, growth drivers, and future opportunities. Spanning the period 2019-2033, with a focus on the base year 2025 and forecast period 2025-2033, this report is an invaluable resource for stakeholders seeking to understand and capitalize on this rapidly evolving market. The market size is projected to reach xx Million by 2033, demonstrating substantial growth potential.
Skin Cancer Therapeutics Market Market Composition & Trends
This section delves into the intricate landscape of the skin cancer therapeutics market, examining market concentration, innovation drivers, regulatory influences, and competitive dynamics. We analyze the market share distribution among key players, including Sanofi SA, Regeneron Pharmaceuticals Inc, InxMed, Novartis AG, Amgen Inc, Merck & Co Inc, EVAXION BIOTECH A/S, Sun Pharmaceutical Industries Ltd, MediWound Ltd, Bristol-Myers Squibb Company, IOVANCE Biotherapeutics Inc, and Pfizer Inc. The report also explores the impact of mergers and acquisitions (M&A) activities, providing insights into deal values and their influence on market consolidation. The analysis covers various treatment modalities (chemotherapy, immunotherapy, targeted therapy, others) and disease types (melanoma, non-melanoma).
- Market Concentration: Analysis of market share held by top players, revealing the level of competition and potential for disruption.
- Innovation Catalysts: Identification of key technological advancements and research initiatives driving market innovation.
- Regulatory Landscape: Assessment of the regulatory environment and its impact on product approvals and market access.
- Substitute Products: Evaluation of alternative treatment options and their influence on market dynamics.
- End-User Profiles: Characterization of key end-users (hospitals, clinics, research institutions) and their treatment preferences.
- M&A Activities: Detailed analysis of recent M&A deals, including deal values and strategic implications (e.g., the April 2022 acquisition of Checkmate Pharmaceuticals by Regeneron Pharmaceuticals). Estimated total M&A deal value in the period 2019-2024: xx Million.
Skin Cancer Therapeutics Market Industry Evolution
This section provides a detailed analysis of the skin cancer therapeutics market's historical and projected growth trajectories. We examine the evolution of treatment approaches, technological advancements (e.g., the rise of immunotherapies and targeted therapies), and shifting consumer preferences towards personalized medicine. The analysis incorporates quantitative data points such as compound annual growth rates (CAGRs) and adoption rates for different treatment modalities. The impact of evolving healthcare infrastructure and increasing awareness of skin cancer prevention and early detection is also assessed. The report highlights the significant increase in the number of melanoma and non-melanoma skin cancer diagnoses globally, driving market growth. For example, the CAGR for the market between 2019 and 2024 was xx%, indicating substantial growth. Further, the adoption rate of immunotherapy is projected to increase by xx% between 2025 and 2033.
Leading Regions, Countries, or Segments in Skin Cancer Therapeutics Market
This section identifies the dominant regions, countries, and segments within the skin cancer therapeutics market. We analyze the factors driving their dominance, including investment trends, regulatory support, and healthcare infrastructure.
Dominant Regions/Countries: (Analysis will pinpoint specific regions and countries based on data and provide reasons for their dominance)
- Key Drivers:
- High prevalence of skin cancer.
- Robust healthcare infrastructure and investment in research and development.
- Favorable regulatory environment for drug approvals.
- Growing awareness and early detection programs.
Dominant Segments (Treatment & Disease Type): (Analysis will determine the leading segment based on data and provide reasons)
- Key Drivers:
- Higher efficacy and lower side effects compared to other treatment options.
- Increasing prevalence of specific skin cancer types.
- Growing adoption of personalized medicine.
Skin Cancer Therapeutics Market Product Innovations
Recent innovations in skin cancer therapeutics include the development of novel targeted therapies, immunotherapies with improved efficacy and safety profiles, and advancements in drug delivery systems for enhanced treatment outcomes. These innovations are characterized by improved targeting mechanisms, reduced toxicity, and personalized treatment approaches based on genetic and molecular profiling of tumors. The unique selling propositions often focus on improved patient outcomes, reduced side effects, and targeted treatment approaches leading to a better quality of life.
Propelling Factors for Skin Cancer Therapeutics Market Growth
Several factors are driving the growth of the skin cancer therapeutics market. These include the rising prevalence of skin cancer globally due to increasing exposure to ultraviolet (UV) radiation and lifestyle factors, advancements in treatment modalities like immunotherapy and targeted therapy offering improved efficacy and safety profiles, increasing healthcare expenditure, and growing awareness among patients and healthcare professionals. Government initiatives supporting skin cancer research and development and favorable regulatory landscapes further accelerate market expansion.
Obstacles in the Skin Cancer Therapeutics Market Market
The skin cancer therapeutics market faces several challenges. These include high drug development costs and long timelines for regulatory approvals, potential for drug resistance development, limited access to advanced therapies in many regions, high treatment costs affecting patient affordability and accessibility, and the intense competition among established and emerging players. Supply chain disruptions related to raw materials and manufacturing can also impact market dynamics.
Future Opportunities in Skin Cancer Therapeutics Market
Future opportunities lie in the development of novel therapies targeting specific mutations, personalized medicine approaches based on genomic and proteomic profiling of tumors, and the application of artificial intelligence (AI) and machine learning to improve diagnosis, treatment selection, and patient monitoring. Expanding access to advanced therapies in underserved markets, focusing on prevention and early detection strategies, and developing innovative drug delivery systems present significant market potential.
Major Players in the Skin Cancer Therapeutics Market Ecosystem
- Sanofi SA
- Regeneron Pharmaceuticals Inc
- InxMed
- Novartis AG
- Amgen Inc
- Merck & Co Inc
- EVAXION BIOTECH A/S
- Sun Pharmaceutical Industries Ltd
- MediWound Ltd
- Bristol-Myers Squibb Company
- IOVANCE Biotherapeutics Inc
- Pfizer Inc
Key Developments in Skin Cancer Therapeutics Market Industry
- December 2022: Sirnaomics Ltd. released positive interim results from a Phase IIb clinical trial of STP705 for Cutaneous Squamous Cell Carcinoma In Situ (isSCC).
- April 2022: Regeneron Pharmaceuticals acquired Checkmate Pharmaceuticals, gaining access to Vidutolimod, a promising drug candidate for melanoma and other skin cancers.
Strategic Skin Cancer Therapeutics Market Market Forecast
The skin cancer therapeutics market is poised for significant growth driven by technological advancements, increasing prevalence of skin cancer, and rising healthcare expenditure. The market's future is bright, with opportunities in personalized medicine, innovative drug delivery, and expansion into new markets. Continued innovation and strategic partnerships will shape the market landscape in the coming years, leading to improved treatment outcomes and broader access to effective therapies.
Skin Cancer Therapeutics Market Segmentation
-
1. Disease Type
- 1.1. Melanoma
- 1.2. Non-melanoma
-
2. Treatment
- 2.1. Chemotherapy
- 2.2. Immunotherapy
- 2.3. Targeted Therapy
- 2.4. Others
Skin Cancer Therapeutics Market Segmentation By Geography
-
1. North America
- 1.1. United States
- 1.2. Canada
- 1.3. Mexico
-
2. Europe
- 2.1. Germany
- 2.2. United Kingdom
- 2.3. France
- 2.4. Italy
- 2.5. Spain
- 2.6. Rest of Europe
-
3. Asia Pacific
- 3.1. China
- 3.2. Japan
- 3.3. India
- 3.4. Australia
- 3.5. South Korea
- 3.6. Rest of Asia Pacific
-
4. Middle East and Africa
- 4.1. GCC
- 4.2. South Africa
- 4.3. Rest of Middle East and Africa
-
5. South America
- 5.1. Brazil
- 5.2. Argentina
- 5.3. Rest of South America
Skin Cancer Therapeutics Market REPORT HIGHLIGHTS
| Aspects | Details |
|---|---|
| Study Period | 2019-2033 |
| Base Year | 2024 |
| Estimated Year | 2025 |
| Forecast Period | 2025-2033 |
| Historical Period | 2019-2024 |
| Growth Rate | CAGR of 10.10% from 2019-2033 |
| Segmentation |
|
Table of Contents
- 1. Introduction
- 1.1. Research Scope
- 1.2. Market Segmentation
- 1.3. Research Methodology
- 1.4. Definitions and Assumptions
- 2. Executive Summary
- 2.1. Introduction
- 3. Market Dynamics
- 3.1. Introduction
- 3.2. Market Drivers
- 3.2.1. Increasing Incidence of Skin Cancer; Rising Awareness about Skin Cancer; Extensive R&D Pipelines
- 3.3. Market Restrains
- 3.3.1. High Cost Associated with Therapy
- 3.4. Market Trends
- 3.4.1. Non-melanoma Skin Cancer Segment is Expected to Witness Healthy Growth in the Future
- 4. Market Factor Analysis
- 4.1. Porters Five Forces
- 4.2. Supply/Value Chain
- 4.3. PESTEL analysis
- 4.4. Market Entropy
- 4.5. Patent/Trademark Analysis
- 5. Global Skin Cancer Therapeutics Market Analysis, Insights and Forecast, 2019-2031
- 5.1. Market Analysis, Insights and Forecast - by Disease Type
- 5.1.1. Melanoma
- 5.1.2. Non-melanoma
- 5.2. Market Analysis, Insights and Forecast - by Treatment
- 5.2.1. Chemotherapy
- 5.2.2. Immunotherapy
- 5.2.3. Targeted Therapy
- 5.2.4. Others
- 5.3. Market Analysis, Insights and Forecast - by Region
- 5.3.1. North America
- 5.3.2. Europe
- 5.3.3. Asia Pacific
- 5.3.4. Middle East and Africa
- 5.3.5. South America
- 5.1. Market Analysis, Insights and Forecast - by Disease Type
- 6. North America Skin Cancer Therapeutics Market Analysis, Insights and Forecast, 2019-2031
- 6.1. Market Analysis, Insights and Forecast - by Disease Type
- 6.1.1. Melanoma
- 6.1.2. Non-melanoma
- 6.2. Market Analysis, Insights and Forecast - by Treatment
- 6.2.1. Chemotherapy
- 6.2.2. Immunotherapy
- 6.2.3. Targeted Therapy
- 6.2.4. Others
- 6.1. Market Analysis, Insights and Forecast - by Disease Type
- 7. Europe Skin Cancer Therapeutics Market Analysis, Insights and Forecast, 2019-2031
- 7.1. Market Analysis, Insights and Forecast - by Disease Type
- 7.1.1. Melanoma
- 7.1.2. Non-melanoma
- 7.2. Market Analysis, Insights and Forecast - by Treatment
- 7.2.1. Chemotherapy
- 7.2.2. Immunotherapy
- 7.2.3. Targeted Therapy
- 7.2.4. Others
- 7.1. Market Analysis, Insights and Forecast - by Disease Type
- 8. Asia Pacific Skin Cancer Therapeutics Market Analysis, Insights and Forecast, 2019-2031
- 8.1. Market Analysis, Insights and Forecast - by Disease Type
- 8.1.1. Melanoma
- 8.1.2. Non-melanoma
- 8.2. Market Analysis, Insights and Forecast - by Treatment
- 8.2.1. Chemotherapy
- 8.2.2. Immunotherapy
- 8.2.3. Targeted Therapy
- 8.2.4. Others
- 8.1. Market Analysis, Insights and Forecast - by Disease Type
- 9. Middle East and Africa Skin Cancer Therapeutics Market Analysis, Insights and Forecast, 2019-2031
- 9.1. Market Analysis, Insights and Forecast - by Disease Type
- 9.1.1. Melanoma
- 9.1.2. Non-melanoma
- 9.2. Market Analysis, Insights and Forecast - by Treatment
- 9.2.1. Chemotherapy
- 9.2.2. Immunotherapy
- 9.2.3. Targeted Therapy
- 9.2.4. Others
- 9.1. Market Analysis, Insights and Forecast - by Disease Type
- 10. South America Skin Cancer Therapeutics Market Analysis, Insights and Forecast, 2019-2031
- 10.1. Market Analysis, Insights and Forecast - by Disease Type
- 10.1.1. Melanoma
- 10.1.2. Non-melanoma
- 10.2. Market Analysis, Insights and Forecast - by Treatment
- 10.2.1. Chemotherapy
- 10.2.2. Immunotherapy
- 10.2.3. Targeted Therapy
- 10.2.4. Others
- 10.1. Market Analysis, Insights and Forecast - by Disease Type
- 11. North America Skin Cancer Therapeutics Market Analysis, Insights and Forecast, 2019-2031
- 11.1. Market Analysis, Insights and Forecast - By Country/Sub-region
- 11.1.1 United States
- 11.1.2 Canada
- 11.1.3 Mexico
- 12. Europe Skin Cancer Therapeutics Market Analysis, Insights and Forecast, 2019-2031
- 12.1. Market Analysis, Insights and Forecast - By Country/Sub-region
- 12.1.1 Germany
- 12.1.2 United Kingdom
- 12.1.3 France
- 12.1.4 Italy
- 12.1.5 Spain
- 12.1.6 Rest of Europe
- 13. Asia Pacific Skin Cancer Therapeutics Market Analysis, Insights and Forecast, 2019-2031
- 13.1. Market Analysis, Insights and Forecast - By Country/Sub-region
- 13.1.1 China
- 13.1.2 Japan
- 13.1.3 India
- 13.1.4 Australia
- 13.1.5 South Korea
- 13.1.6 Rest of Asia Pacific
- 14. Middle East and Africa Skin Cancer Therapeutics Market Analysis, Insights and Forecast, 2019-2031
- 14.1. Market Analysis, Insights and Forecast - By Country/Sub-region
- 14.1.1 GCC
- 14.1.2 South Africa
- 14.1.3 Rest of Middle East and Africa
- 15. South America Skin Cancer Therapeutics Market Analysis, Insights and Forecast, 2019-2031
- 15.1. Market Analysis, Insights and Forecast - By Country/Sub-region
- 15.1.1 Brazil
- 15.1.2 Argentina
- 15.1.3 Rest of South America
- 16. Competitive Analysis
- 16.1. Global Market Share Analysis 2024
- 16.2. Company Profiles
- 16.2.1 Sanofi SA
- 16.2.1.1. Overview
- 16.2.1.2. Products
- 16.2.1.3. SWOT Analysis
- 16.2.1.4. Recent Developments
- 16.2.1.5. Financials (Based on Availability)
- 16.2.2 Regeneron Pharmaceuticals Inc
- 16.2.2.1. Overview
- 16.2.2.2. Products
- 16.2.2.3. SWOT Analysis
- 16.2.2.4. Recent Developments
- 16.2.2.5. Financials (Based on Availability)
- 16.2.3 InxMed
- 16.2.3.1. Overview
- 16.2.3.2. Products
- 16.2.3.3. SWOT Analysis
- 16.2.3.4. Recent Developments
- 16.2.3.5. Financials (Based on Availability)
- 16.2.4 Novartis AG
- 16.2.4.1. Overview
- 16.2.4.2. Products
- 16.2.4.3. SWOT Analysis
- 16.2.4.4. Recent Developments
- 16.2.4.5. Financials (Based on Availability)
- 16.2.5 Amgen Inc
- 16.2.5.1. Overview
- 16.2.5.2. Products
- 16.2.5.3. SWOT Analysis
- 16.2.5.4. Recent Developments
- 16.2.5.5. Financials (Based on Availability)
- 16.2.6 Merck & Co Inc
- 16.2.6.1. Overview
- 16.2.6.2. Products
- 16.2.6.3. SWOT Analysis
- 16.2.6.4. Recent Developments
- 16.2.6.5. Financials (Based on Availability)
- 16.2.7 EVAXION BIOTECH A/S
- 16.2.7.1. Overview
- 16.2.7.2. Products
- 16.2.7.3. SWOT Analysis
- 16.2.7.4. Recent Developments
- 16.2.7.5. Financials (Based on Availability)
- 16.2.8 Sun Pharmaceutical Industries Ltd
- 16.2.8.1. Overview
- 16.2.8.2. Products
- 16.2.8.3. SWOT Analysis
- 16.2.8.4. Recent Developments
- 16.2.8.5. Financials (Based on Availability)
- 16.2.9 MediWound Ltd
- 16.2.9.1. Overview
- 16.2.9.2. Products
- 16.2.9.3. SWOT Analysis
- 16.2.9.4. Recent Developments
- 16.2.9.5. Financials (Based on Availability)
- 16.2.10 Bristol-Myers Squibb Company
- 16.2.10.1. Overview
- 16.2.10.2. Products
- 16.2.10.3. SWOT Analysis
- 16.2.10.4. Recent Developments
- 16.2.10.5. Financials (Based on Availability)
- 16.2.11 IOVANCE Biotherapeutics Inc
- 16.2.11.1. Overview
- 16.2.11.2. Products
- 16.2.11.3. SWOT Analysis
- 16.2.11.4. Recent Developments
- 16.2.11.5. Financials (Based on Availability)
- 16.2.12 Pfizer Inc
- 16.2.12.1. Overview
- 16.2.12.2. Products
- 16.2.12.3. SWOT Analysis
- 16.2.12.4. Recent Developments
- 16.2.12.5. Financials (Based on Availability)
- 16.2.1 Sanofi SA
List of Figures
- Figure 1: Global Skin Cancer Therapeutics Market Revenue Breakdown (Million, %) by Region 2024 & 2032
- Figure 2: Global Skin Cancer Therapeutics Market Volume Breakdown (K Unit, %) by Region 2024 & 2032
- Figure 3: North America Skin Cancer Therapeutics Market Revenue (Million), by Country 2024 & 2032
- Figure 4: North America Skin Cancer Therapeutics Market Volume (K Unit), by Country 2024 & 2032
- Figure 5: North America Skin Cancer Therapeutics Market Revenue Share (%), by Country 2024 & 2032
- Figure 6: North America Skin Cancer Therapeutics Market Volume Share (%), by Country 2024 & 2032
- Figure 7: Europe Skin Cancer Therapeutics Market Revenue (Million), by Country 2024 & 2032
- Figure 8: Europe Skin Cancer Therapeutics Market Volume (K Unit), by Country 2024 & 2032
- Figure 9: Europe Skin Cancer Therapeutics Market Revenue Share (%), by Country 2024 & 2032
- Figure 10: Europe Skin Cancer Therapeutics Market Volume Share (%), by Country 2024 & 2032
- Figure 11: Asia Pacific Skin Cancer Therapeutics Market Revenue (Million), by Country 2024 & 2032
- Figure 12: Asia Pacific Skin Cancer Therapeutics Market Volume (K Unit), by Country 2024 & 2032
- Figure 13: Asia Pacific Skin Cancer Therapeutics Market Revenue Share (%), by Country 2024 & 2032
- Figure 14: Asia Pacific Skin Cancer Therapeutics Market Volume Share (%), by Country 2024 & 2032
- Figure 15: Middle East and Africa Skin Cancer Therapeutics Market Revenue (Million), by Country 2024 & 2032
- Figure 16: Middle East and Africa Skin Cancer Therapeutics Market Volume (K Unit), by Country 2024 & 2032
- Figure 17: Middle East and Africa Skin Cancer Therapeutics Market Revenue Share (%), by Country 2024 & 2032
- Figure 18: Middle East and Africa Skin Cancer Therapeutics Market Volume Share (%), by Country 2024 & 2032
- Figure 19: South America Skin Cancer Therapeutics Market Revenue (Million), by Country 2024 & 2032
- Figure 20: South America Skin Cancer Therapeutics Market Volume (K Unit), by Country 2024 & 2032
- Figure 21: South America Skin Cancer Therapeutics Market Revenue Share (%), by Country 2024 & 2032
- Figure 22: South America Skin Cancer Therapeutics Market Volume Share (%), by Country 2024 & 2032
- Figure 23: North America Skin Cancer Therapeutics Market Revenue (Million), by Disease Type 2024 & 2032
- Figure 24: North America Skin Cancer Therapeutics Market Volume (K Unit), by Disease Type 2024 & 2032
- Figure 25: North America Skin Cancer Therapeutics Market Revenue Share (%), by Disease Type 2024 & 2032
- Figure 26: North America Skin Cancer Therapeutics Market Volume Share (%), by Disease Type 2024 & 2032
- Figure 27: North America Skin Cancer Therapeutics Market Revenue (Million), by Treatment 2024 & 2032
- Figure 28: North America Skin Cancer Therapeutics Market Volume (K Unit), by Treatment 2024 & 2032
- Figure 29: North America Skin Cancer Therapeutics Market Revenue Share (%), by Treatment 2024 & 2032
- Figure 30: North America Skin Cancer Therapeutics Market Volume Share (%), by Treatment 2024 & 2032
- Figure 31: North America Skin Cancer Therapeutics Market Revenue (Million), by Country 2024 & 2032
- Figure 32: North America Skin Cancer Therapeutics Market Volume (K Unit), by Country 2024 & 2032
- Figure 33: North America Skin Cancer Therapeutics Market Revenue Share (%), by Country 2024 & 2032
- Figure 34: North America Skin Cancer Therapeutics Market Volume Share (%), by Country 2024 & 2032
- Figure 35: Europe Skin Cancer Therapeutics Market Revenue (Million), by Disease Type 2024 & 2032
- Figure 36: Europe Skin Cancer Therapeutics Market Volume (K Unit), by Disease Type 2024 & 2032
- Figure 37: Europe Skin Cancer Therapeutics Market Revenue Share (%), by Disease Type 2024 & 2032
- Figure 38: Europe Skin Cancer Therapeutics Market Volume Share (%), by Disease Type 2024 & 2032
- Figure 39: Europe Skin Cancer Therapeutics Market Revenue (Million), by Treatment 2024 & 2032
- Figure 40: Europe Skin Cancer Therapeutics Market Volume (K Unit), by Treatment 2024 & 2032
- Figure 41: Europe Skin Cancer Therapeutics Market Revenue Share (%), by Treatment 2024 & 2032
- Figure 42: Europe Skin Cancer Therapeutics Market Volume Share (%), by Treatment 2024 & 2032
- Figure 43: Europe Skin Cancer Therapeutics Market Revenue (Million), by Country 2024 & 2032
- Figure 44: Europe Skin Cancer Therapeutics Market Volume (K Unit), by Country 2024 & 2032
- Figure 45: Europe Skin Cancer Therapeutics Market Revenue Share (%), by Country 2024 & 2032
- Figure 46: Europe Skin Cancer Therapeutics Market Volume Share (%), by Country 2024 & 2032
- Figure 47: Asia Pacific Skin Cancer Therapeutics Market Revenue (Million), by Disease Type 2024 & 2032
- Figure 48: Asia Pacific Skin Cancer Therapeutics Market Volume (K Unit), by Disease Type 2024 & 2032
- Figure 49: Asia Pacific Skin Cancer Therapeutics Market Revenue Share (%), by Disease Type 2024 & 2032
- Figure 50: Asia Pacific Skin Cancer Therapeutics Market Volume Share (%), by Disease Type 2024 & 2032
- Figure 51: Asia Pacific Skin Cancer Therapeutics Market Revenue (Million), by Treatment 2024 & 2032
- Figure 52: Asia Pacific Skin Cancer Therapeutics Market Volume (K Unit), by Treatment 2024 & 2032
- Figure 53: Asia Pacific Skin Cancer Therapeutics Market Revenue Share (%), by Treatment 2024 & 2032
- Figure 54: Asia Pacific Skin Cancer Therapeutics Market Volume Share (%), by Treatment 2024 & 2032
- Figure 55: Asia Pacific Skin Cancer Therapeutics Market Revenue (Million), by Country 2024 & 2032
- Figure 56: Asia Pacific Skin Cancer Therapeutics Market Volume (K Unit), by Country 2024 & 2032
- Figure 57: Asia Pacific Skin Cancer Therapeutics Market Revenue Share (%), by Country 2024 & 2032
- Figure 58: Asia Pacific Skin Cancer Therapeutics Market Volume Share (%), by Country 2024 & 2032
- Figure 59: Middle East and Africa Skin Cancer Therapeutics Market Revenue (Million), by Disease Type 2024 & 2032
- Figure 60: Middle East and Africa Skin Cancer Therapeutics Market Volume (K Unit), by Disease Type 2024 & 2032
- Figure 61: Middle East and Africa Skin Cancer Therapeutics Market Revenue Share (%), by Disease Type 2024 & 2032
- Figure 62: Middle East and Africa Skin Cancer Therapeutics Market Volume Share (%), by Disease Type 2024 & 2032
- Figure 63: Middle East and Africa Skin Cancer Therapeutics Market Revenue (Million), by Treatment 2024 & 2032
- Figure 64: Middle East and Africa Skin Cancer Therapeutics Market Volume (K Unit), by Treatment 2024 & 2032
- Figure 65: Middle East and Africa Skin Cancer Therapeutics Market Revenue Share (%), by Treatment 2024 & 2032
- Figure 66: Middle East and Africa Skin Cancer Therapeutics Market Volume Share (%), by Treatment 2024 & 2032
- Figure 67: Middle East and Africa Skin Cancer Therapeutics Market Revenue (Million), by Country 2024 & 2032
- Figure 68: Middle East and Africa Skin Cancer Therapeutics Market Volume (K Unit), by Country 2024 & 2032
- Figure 69: Middle East and Africa Skin Cancer Therapeutics Market Revenue Share (%), by Country 2024 & 2032
- Figure 70: Middle East and Africa Skin Cancer Therapeutics Market Volume Share (%), by Country 2024 & 2032
- Figure 71: South America Skin Cancer Therapeutics Market Revenue (Million), by Disease Type 2024 & 2032
- Figure 72: South America Skin Cancer Therapeutics Market Volume (K Unit), by Disease Type 2024 & 2032
- Figure 73: South America Skin Cancer Therapeutics Market Revenue Share (%), by Disease Type 2024 & 2032
- Figure 74: South America Skin Cancer Therapeutics Market Volume Share (%), by Disease Type 2024 & 2032
- Figure 75: South America Skin Cancer Therapeutics Market Revenue (Million), by Treatment 2024 & 2032
- Figure 76: South America Skin Cancer Therapeutics Market Volume (K Unit), by Treatment 2024 & 2032
- Figure 77: South America Skin Cancer Therapeutics Market Revenue Share (%), by Treatment 2024 & 2032
- Figure 78: South America Skin Cancer Therapeutics Market Volume Share (%), by Treatment 2024 & 2032
- Figure 79: South America Skin Cancer Therapeutics Market Revenue (Million), by Country 2024 & 2032
- Figure 80: South America Skin Cancer Therapeutics Market Volume (K Unit), by Country 2024 & 2032
- Figure 81: South America Skin Cancer Therapeutics Market Revenue Share (%), by Country 2024 & 2032
- Figure 82: South America Skin Cancer Therapeutics Market Volume Share (%), by Country 2024 & 2032
List of Tables
- Table 1: Global Skin Cancer Therapeutics Market Revenue Million Forecast, by Region 2019 & 2032
- Table 2: Global Skin Cancer Therapeutics Market Volume K Unit Forecast, by Region 2019 & 2032
- Table 3: Global Skin Cancer Therapeutics Market Revenue Million Forecast, by Disease Type 2019 & 2032
- Table 4: Global Skin Cancer Therapeutics Market Volume K Unit Forecast, by Disease Type 2019 & 2032
- Table 5: Global Skin Cancer Therapeutics Market Revenue Million Forecast, by Treatment 2019 & 2032
- Table 6: Global Skin Cancer Therapeutics Market Volume K Unit Forecast, by Treatment 2019 & 2032
- Table 7: Global Skin Cancer Therapeutics Market Revenue Million Forecast, by Region 2019 & 2032
- Table 8: Global Skin Cancer Therapeutics Market Volume K Unit Forecast, by Region 2019 & 2032
- Table 9: Global Skin Cancer Therapeutics Market Revenue Million Forecast, by Country 2019 & 2032
- Table 10: Global Skin Cancer Therapeutics Market Volume K Unit Forecast, by Country 2019 & 2032
- Table 11: United States Skin Cancer Therapeutics Market Revenue (Million) Forecast, by Application 2019 & 2032
- Table 12: United States Skin Cancer Therapeutics Market Volume (K Unit) Forecast, by Application 2019 & 2032
- Table 13: Canada Skin Cancer Therapeutics Market Revenue (Million) Forecast, by Application 2019 & 2032
- Table 14: Canada Skin Cancer Therapeutics Market Volume (K Unit) Forecast, by Application 2019 & 2032
- Table 15: Mexico Skin Cancer Therapeutics Market Revenue (Million) Forecast, by Application 2019 & 2032
- Table 16: Mexico Skin Cancer Therapeutics Market Volume (K Unit) Forecast, by Application 2019 & 2032
- Table 17: Global Skin Cancer Therapeutics Market Revenue Million Forecast, by Country 2019 & 2032
- Table 18: Global Skin Cancer Therapeutics Market Volume K Unit Forecast, by Country 2019 & 2032
- Table 19: Germany Skin Cancer Therapeutics Market Revenue (Million) Forecast, by Application 2019 & 2032
- Table 20: Germany Skin Cancer Therapeutics Market Volume (K Unit) Forecast, by Application 2019 & 2032
- Table 21: United Kingdom Skin Cancer Therapeutics Market Revenue (Million) Forecast, by Application 2019 & 2032
- Table 22: United Kingdom Skin Cancer Therapeutics Market Volume (K Unit) Forecast, by Application 2019 & 2032
- Table 23: France Skin Cancer Therapeutics Market Revenue (Million) Forecast, by Application 2019 & 2032
- Table 24: France Skin Cancer Therapeutics Market Volume (K Unit) Forecast, by Application 2019 & 2032
- Table 25: Italy Skin Cancer Therapeutics Market Revenue (Million) Forecast, by Application 2019 & 2032
- Table 26: Italy Skin Cancer Therapeutics Market Volume (K Unit) Forecast, by Application 2019 & 2032
- Table 27: Spain Skin Cancer Therapeutics Market Revenue (Million) Forecast, by Application 2019 & 2032
- Table 28: Spain Skin Cancer Therapeutics Market Volume (K Unit) Forecast, by Application 2019 & 2032
- Table 29: Rest of Europe Skin Cancer Therapeutics Market Revenue (Million) Forecast, by Application 2019 & 2032
- Table 30: Rest of Europe Skin Cancer Therapeutics Market Volume (K Unit) Forecast, by Application 2019 & 2032
- Table 31: Global Skin Cancer Therapeutics Market Revenue Million Forecast, by Country 2019 & 2032
- Table 32: Global Skin Cancer Therapeutics Market Volume K Unit Forecast, by Country 2019 & 2032
- Table 33: China Skin Cancer Therapeutics Market Revenue (Million) Forecast, by Application 2019 & 2032
- Table 34: China Skin Cancer Therapeutics Market Volume (K Unit) Forecast, by Application 2019 & 2032
- Table 35: Japan Skin Cancer Therapeutics Market Revenue (Million) Forecast, by Application 2019 & 2032
- Table 36: Japan Skin Cancer Therapeutics Market Volume (K Unit) Forecast, by Application 2019 & 2032
- Table 37: India Skin Cancer Therapeutics Market Revenue (Million) Forecast, by Application 2019 & 2032
- Table 38: India Skin Cancer Therapeutics Market Volume (K Unit) Forecast, by Application 2019 & 2032
- Table 39: Australia Skin Cancer Therapeutics Market Revenue (Million) Forecast, by Application 2019 & 2032
- Table 40: Australia Skin Cancer Therapeutics Market Volume (K Unit) Forecast, by Application 2019 & 2032
- Table 41: South Korea Skin Cancer Therapeutics Market Revenue (Million) Forecast, by Application 2019 & 2032
- Table 42: South Korea Skin Cancer Therapeutics Market Volume (K Unit) Forecast, by Application 2019 & 2032
- Table 43: Rest of Asia Pacific Skin Cancer Therapeutics Market Revenue (Million) Forecast, by Application 2019 & 2032
- Table 44: Rest of Asia Pacific Skin Cancer Therapeutics Market Volume (K Unit) Forecast, by Application 2019 & 2032
- Table 45: Global Skin Cancer Therapeutics Market Revenue Million Forecast, by Country 2019 & 2032
- Table 46: Global Skin Cancer Therapeutics Market Volume K Unit Forecast, by Country 2019 & 2032
- Table 47: GCC Skin Cancer Therapeutics Market Revenue (Million) Forecast, by Application 2019 & 2032
- Table 48: GCC Skin Cancer Therapeutics Market Volume (K Unit) Forecast, by Application 2019 & 2032
- Table 49: South Africa Skin Cancer Therapeutics Market Revenue (Million) Forecast, by Application 2019 & 2032
- Table 50: South Africa Skin Cancer Therapeutics Market Volume (K Unit) Forecast, by Application 2019 & 2032
- Table 51: Rest of Middle East and Africa Skin Cancer Therapeutics Market Revenue (Million) Forecast, by Application 2019 & 2032
- Table 52: Rest of Middle East and Africa Skin Cancer Therapeutics Market Volume (K Unit) Forecast, by Application 2019 & 2032
- Table 53: Global Skin Cancer Therapeutics Market Revenue Million Forecast, by Country 2019 & 2032
- Table 54: Global Skin Cancer Therapeutics Market Volume K Unit Forecast, by Country 2019 & 2032
- Table 55: Brazil Skin Cancer Therapeutics Market Revenue (Million) Forecast, by Application 2019 & 2032
- Table 56: Brazil Skin Cancer Therapeutics Market Volume (K Unit) Forecast, by Application 2019 & 2032
- Table 57: Argentina Skin Cancer Therapeutics Market Revenue (Million) Forecast, by Application 2019 & 2032
- Table 58: Argentina Skin Cancer Therapeutics Market Volume (K Unit) Forecast, by Application 2019 & 2032
- Table 59: Rest of South America Skin Cancer Therapeutics Market Revenue (Million) Forecast, by Application 2019 & 2032
- Table 60: Rest of South America Skin Cancer Therapeutics Market Volume (K Unit) Forecast, by Application 2019 & 2032
- Table 61: Global Skin Cancer Therapeutics Market Revenue Million Forecast, by Disease Type 2019 & 2032
- Table 62: Global Skin Cancer Therapeutics Market Volume K Unit Forecast, by Disease Type 2019 & 2032
- Table 63: Global Skin Cancer Therapeutics Market Revenue Million Forecast, by Treatment 2019 & 2032
- Table 64: Global Skin Cancer Therapeutics Market Volume K Unit Forecast, by Treatment 2019 & 2032
- Table 65: Global Skin Cancer Therapeutics Market Revenue Million Forecast, by Country 2019 & 2032
- Table 66: Global Skin Cancer Therapeutics Market Volume K Unit Forecast, by Country 2019 & 2032
- Table 67: United States Skin Cancer Therapeutics Market Revenue (Million) Forecast, by Application 2019 & 2032
- Table 68: United States Skin Cancer Therapeutics Market Volume (K Unit) Forecast, by Application 2019 & 2032
- Table 69: Canada Skin Cancer Therapeutics Market Revenue (Million) Forecast, by Application 2019 & 2032
- Table 70: Canada Skin Cancer Therapeutics Market Volume (K Unit) Forecast, by Application 2019 & 2032
- Table 71: Mexico Skin Cancer Therapeutics Market Revenue (Million) Forecast, by Application 2019 & 2032
- Table 72: Mexico Skin Cancer Therapeutics Market Volume (K Unit) Forecast, by Application 2019 & 2032
- Table 73: Global Skin Cancer Therapeutics Market Revenue Million Forecast, by Disease Type 2019 & 2032
- Table 74: Global Skin Cancer Therapeutics Market Volume K Unit Forecast, by Disease Type 2019 & 2032
- Table 75: Global Skin Cancer Therapeutics Market Revenue Million Forecast, by Treatment 2019 & 2032
- Table 76: Global Skin Cancer Therapeutics Market Volume K Unit Forecast, by Treatment 2019 & 2032
- Table 77: Global Skin Cancer Therapeutics Market Revenue Million Forecast, by Country 2019 & 2032
- Table 78: Global Skin Cancer Therapeutics Market Volume K Unit Forecast, by Country 2019 & 2032
- Table 79: Germany Skin Cancer Therapeutics Market Revenue (Million) Forecast, by Application 2019 & 2032
- Table 80: Germany Skin Cancer Therapeutics Market Volume (K Unit) Forecast, by Application 2019 & 2032
- Table 81: United Kingdom Skin Cancer Therapeutics Market Revenue (Million) Forecast, by Application 2019 & 2032
- Table 82: United Kingdom Skin Cancer Therapeutics Market Volume (K Unit) Forecast, by Application 2019 & 2032
- Table 83: France Skin Cancer Therapeutics Market Revenue (Million) Forecast, by Application 2019 & 2032
- Table 84: France Skin Cancer Therapeutics Market Volume (K Unit) Forecast, by Application 2019 & 2032
- Table 85: Italy Skin Cancer Therapeutics Market Revenue (Million) Forecast, by Application 2019 & 2032
- Table 86: Italy Skin Cancer Therapeutics Market Volume (K Unit) Forecast, by Application 2019 & 2032
- Table 87: Spain Skin Cancer Therapeutics Market Revenue (Million) Forecast, by Application 2019 & 2032
- Table 88: Spain Skin Cancer Therapeutics Market Volume (K Unit) Forecast, by Application 2019 & 2032
- Table 89: Rest of Europe Skin Cancer Therapeutics Market Revenue (Million) Forecast, by Application 2019 & 2032
- Table 90: Rest of Europe Skin Cancer Therapeutics Market Volume (K Unit) Forecast, by Application 2019 & 2032
- Table 91: Global Skin Cancer Therapeutics Market Revenue Million Forecast, by Disease Type 2019 & 2032
- Table 92: Global Skin Cancer Therapeutics Market Volume K Unit Forecast, by Disease Type 2019 & 2032
- Table 93: Global Skin Cancer Therapeutics Market Revenue Million Forecast, by Treatment 2019 & 2032
- Table 94: Global Skin Cancer Therapeutics Market Volume K Unit Forecast, by Treatment 2019 & 2032
- Table 95: Global Skin Cancer Therapeutics Market Revenue Million Forecast, by Country 2019 & 2032
- Table 96: Global Skin Cancer Therapeutics Market Volume K Unit Forecast, by Country 2019 & 2032
- Table 97: China Skin Cancer Therapeutics Market Revenue (Million) Forecast, by Application 2019 & 2032
- Table 98: China Skin Cancer Therapeutics Market Volume (K Unit) Forecast, by Application 2019 & 2032
- Table 99: Japan Skin Cancer Therapeutics Market Revenue (Million) Forecast, by Application 2019 & 2032
- Table 100: Japan Skin Cancer Therapeutics Market Volume (K Unit) Forecast, by Application 2019 & 2032
- Table 101: India Skin Cancer Therapeutics Market Revenue (Million) Forecast, by Application 2019 & 2032
- Table 102: India Skin Cancer Therapeutics Market Volume (K Unit) Forecast, by Application 2019 & 2032
- Table 103: Australia Skin Cancer Therapeutics Market Revenue (Million) Forecast, by Application 2019 & 2032
- Table 104: Australia Skin Cancer Therapeutics Market Volume (K Unit) Forecast, by Application 2019 & 2032
- Table 105: South Korea Skin Cancer Therapeutics Market Revenue (Million) Forecast, by Application 2019 & 2032
- Table 106: South Korea Skin Cancer Therapeutics Market Volume (K Unit) Forecast, by Application 2019 & 2032
- Table 107: Rest of Asia Pacific Skin Cancer Therapeutics Market Revenue (Million) Forecast, by Application 2019 & 2032
- Table 108: Rest of Asia Pacific Skin Cancer Therapeutics Market Volume (K Unit) Forecast, by Application 2019 & 2032
- Table 109: Global Skin Cancer Therapeutics Market Revenue Million Forecast, by Disease Type 2019 & 2032
- Table 110: Global Skin Cancer Therapeutics Market Volume K Unit Forecast, by Disease Type 2019 & 2032
- Table 111: Global Skin Cancer Therapeutics Market Revenue Million Forecast, by Treatment 2019 & 2032
- Table 112: Global Skin Cancer Therapeutics Market Volume K Unit Forecast, by Treatment 2019 & 2032
- Table 113: Global Skin Cancer Therapeutics Market Revenue Million Forecast, by Country 2019 & 2032
- Table 114: Global Skin Cancer Therapeutics Market Volume K Unit Forecast, by Country 2019 & 2032
- Table 115: GCC Skin Cancer Therapeutics Market Revenue (Million) Forecast, by Application 2019 & 2032
- Table 116: GCC Skin Cancer Therapeutics Market Volume (K Unit) Forecast, by Application 2019 & 2032
- Table 117: South Africa Skin Cancer Therapeutics Market Revenue (Million) Forecast, by Application 2019 & 2032
- Table 118: South Africa Skin Cancer Therapeutics Market Volume (K Unit) Forecast, by Application 2019 & 2032
- Table 119: Rest of Middle East and Africa Skin Cancer Therapeutics Market Revenue (Million) Forecast, by Application 2019 & 2032
- Table 120: Rest of Middle East and Africa Skin Cancer Therapeutics Market Volume (K Unit) Forecast, by Application 2019 & 2032
- Table 121: Global Skin Cancer Therapeutics Market Revenue Million Forecast, by Disease Type 2019 & 2032
- Table 122: Global Skin Cancer Therapeutics Market Volume K Unit Forecast, by Disease Type 2019 & 2032
- Table 123: Global Skin Cancer Therapeutics Market Revenue Million Forecast, by Treatment 2019 & 2032
- Table 124: Global Skin Cancer Therapeutics Market Volume K Unit Forecast, by Treatment 2019 & 2032
- Table 125: Global Skin Cancer Therapeutics Market Revenue Million Forecast, by Country 2019 & 2032
- Table 126: Global Skin Cancer Therapeutics Market Volume K Unit Forecast, by Country 2019 & 2032
- Table 127: Brazil Skin Cancer Therapeutics Market Revenue (Million) Forecast, by Application 2019 & 2032
- Table 128: Brazil Skin Cancer Therapeutics Market Volume (K Unit) Forecast, by Application 2019 & 2032
- Table 129: Argentina Skin Cancer Therapeutics Market Revenue (Million) Forecast, by Application 2019 & 2032
- Table 130: Argentina Skin Cancer Therapeutics Market Volume (K Unit) Forecast, by Application 2019 & 2032
- Table 131: Rest of South America Skin Cancer Therapeutics Market Revenue (Million) Forecast, by Application 2019 & 2032
- Table 132: Rest of South America Skin Cancer Therapeutics Market Volume (K Unit) Forecast, by Application 2019 & 2032
Frequently Asked Questions
1. What is the projected Compound Annual Growth Rate (CAGR) of the Skin Cancer Therapeutics Market?
The projected CAGR is approximately 10.10%.
2. Which companies are prominent players in the Skin Cancer Therapeutics Market?
Key companies in the market include Sanofi SA, Regeneron Pharmaceuticals Inc, InxMed, Novartis AG, Amgen Inc, Merck & Co Inc, EVAXION BIOTECH A/S, Sun Pharmaceutical Industries Ltd, MediWound Ltd, Bristol-Myers Squibb Company, IOVANCE Biotherapeutics Inc, Pfizer Inc.
3. What are the main segments of the Skin Cancer Therapeutics Market?
The market segments include Disease Type, Treatment.
4. Can you provide details about the market size?
The market size is estimated to be USD XX Million as of 2022.
5. What are some drivers contributing to market growth?
Increasing Incidence of Skin Cancer; Rising Awareness about Skin Cancer; Extensive R&D Pipelines.
6. What are the notable trends driving market growth?
Non-melanoma Skin Cancer Segment is Expected to Witness Healthy Growth in the Future.
7. Are there any restraints impacting market growth?
High Cost Associated with Therapy.
8. Can you provide examples of recent developments in the market?
In December 2022, Sirnaomics Ltd. released the interim results of part one of an ongoing Phase IIb clinical trial of STP705 for the treatment of Cutaneous Squamous Cell Carcinoma In Situ (isSCC). The compound showed positive clinical readouts of the part-one study of this Phase IIb trial.
9. What pricing options are available for accessing the report?
Pricing options include single-user, multi-user, and enterprise licenses priced at USD 4750, USD 5250, and USD 8750 respectively.
10. Is the market size provided in terms of value or volume?
The market size is provided in terms of value, measured in Million and volume, measured in K Unit.
11. Are there any specific market keywords associated with the report?
Yes, the market keyword associated with the report is "Skin Cancer Therapeutics Market," which aids in identifying and referencing the specific market segment covered.
12. How do I determine which pricing option suits my needs best?
The pricing options vary based on user requirements and access needs. Individual users may opt for single-user licenses, while businesses requiring broader access may choose multi-user or enterprise licenses for cost-effective access to the report.
13. Are there any additional resources or data provided in the Skin Cancer Therapeutics Market report?
While the report offers comprehensive insights, it's advisable to review the specific contents or supplementary materials provided to ascertain if additional resources or data are available.
14. How can I stay updated on further developments or reports in the Skin Cancer Therapeutics Market?
To stay informed about further developments, trends, and reports in the Skin Cancer Therapeutics Market, consider subscribing to industry newsletters, following relevant companies and organizations, or regularly checking reputable industry news sources and publications.
Methodology
Step 1 - Identification of Relevant Samples Size from Population Database


Step 2 - Approaches for Defining Global Market Size (Value, Volume* & Price*)

Note*: In applicable scenarios
Step 3 - Data Sources
Primary Research
- Web Analytics
- Survey Reports
- Research Institute
- Latest Research Reports
- Opinion Leaders
Secondary Research
- Annual Reports
- White Paper
- Latest Press Release
- Industry Association
- Paid Database
- Investor Presentations

Step 4 - Data Triangulation
Involves using different sources of information in order to increase the validity of a study
These sources are likely to be stakeholders in a program - participants, other researchers, program staff, other community members, and so on.
Then we put all data in single framework & apply various statistical tools to find out the dynamic on the market.
During the analysis stage, feedback from the stakeholder groups would be compared to determine areas of agreement as well as areas of divergence
