

Key Insights
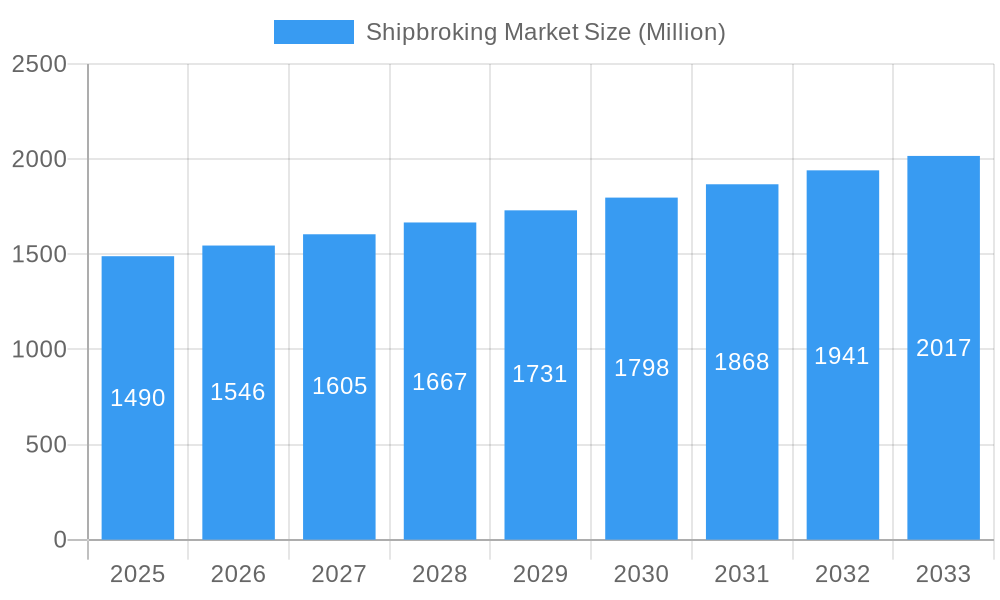
The global shipbroking market, valued at $1.49 billion in 2025, is projected to experience steady growth, driven by increasing global trade volumes and the need for efficient vessel chartering and operations. The Compound Annual Growth Rate (CAGR) of 3.65% from 2025 to 2033 indicates a consistent expansion, although this growth may be subject to fluctuations influenced by global economic conditions and shipping industry cycles. Key drivers include the rise of e-commerce, necessitating increased shipping capacity and sophisticated logistical solutions that shipbrokers provide. Furthermore, the ongoing consolidation within the shipping industry and increasing demand for specialized vessels, like LNG carriers and container ships, fuels the need for experienced brokers to navigate complex charter arrangements. While regulatory changes and potential economic downturns could pose restraints, the long-term outlook for the shipbroking market remains positive, fueled by the intrinsic reliance of the shipping sector on skilled intermediaries for securing profitable vessel charters. The market is segmented based on vessel type (dry bulk, tanker, container, etc.), service type (chartering, sale & purchase, etc.), and geographic region. Major players, such as Aries Shipbroking, BRS Group, and Clarkson PLC, compete intensely, leading to continuous innovation in services and technological advancements to optimize efficiency and transparency in transactions.
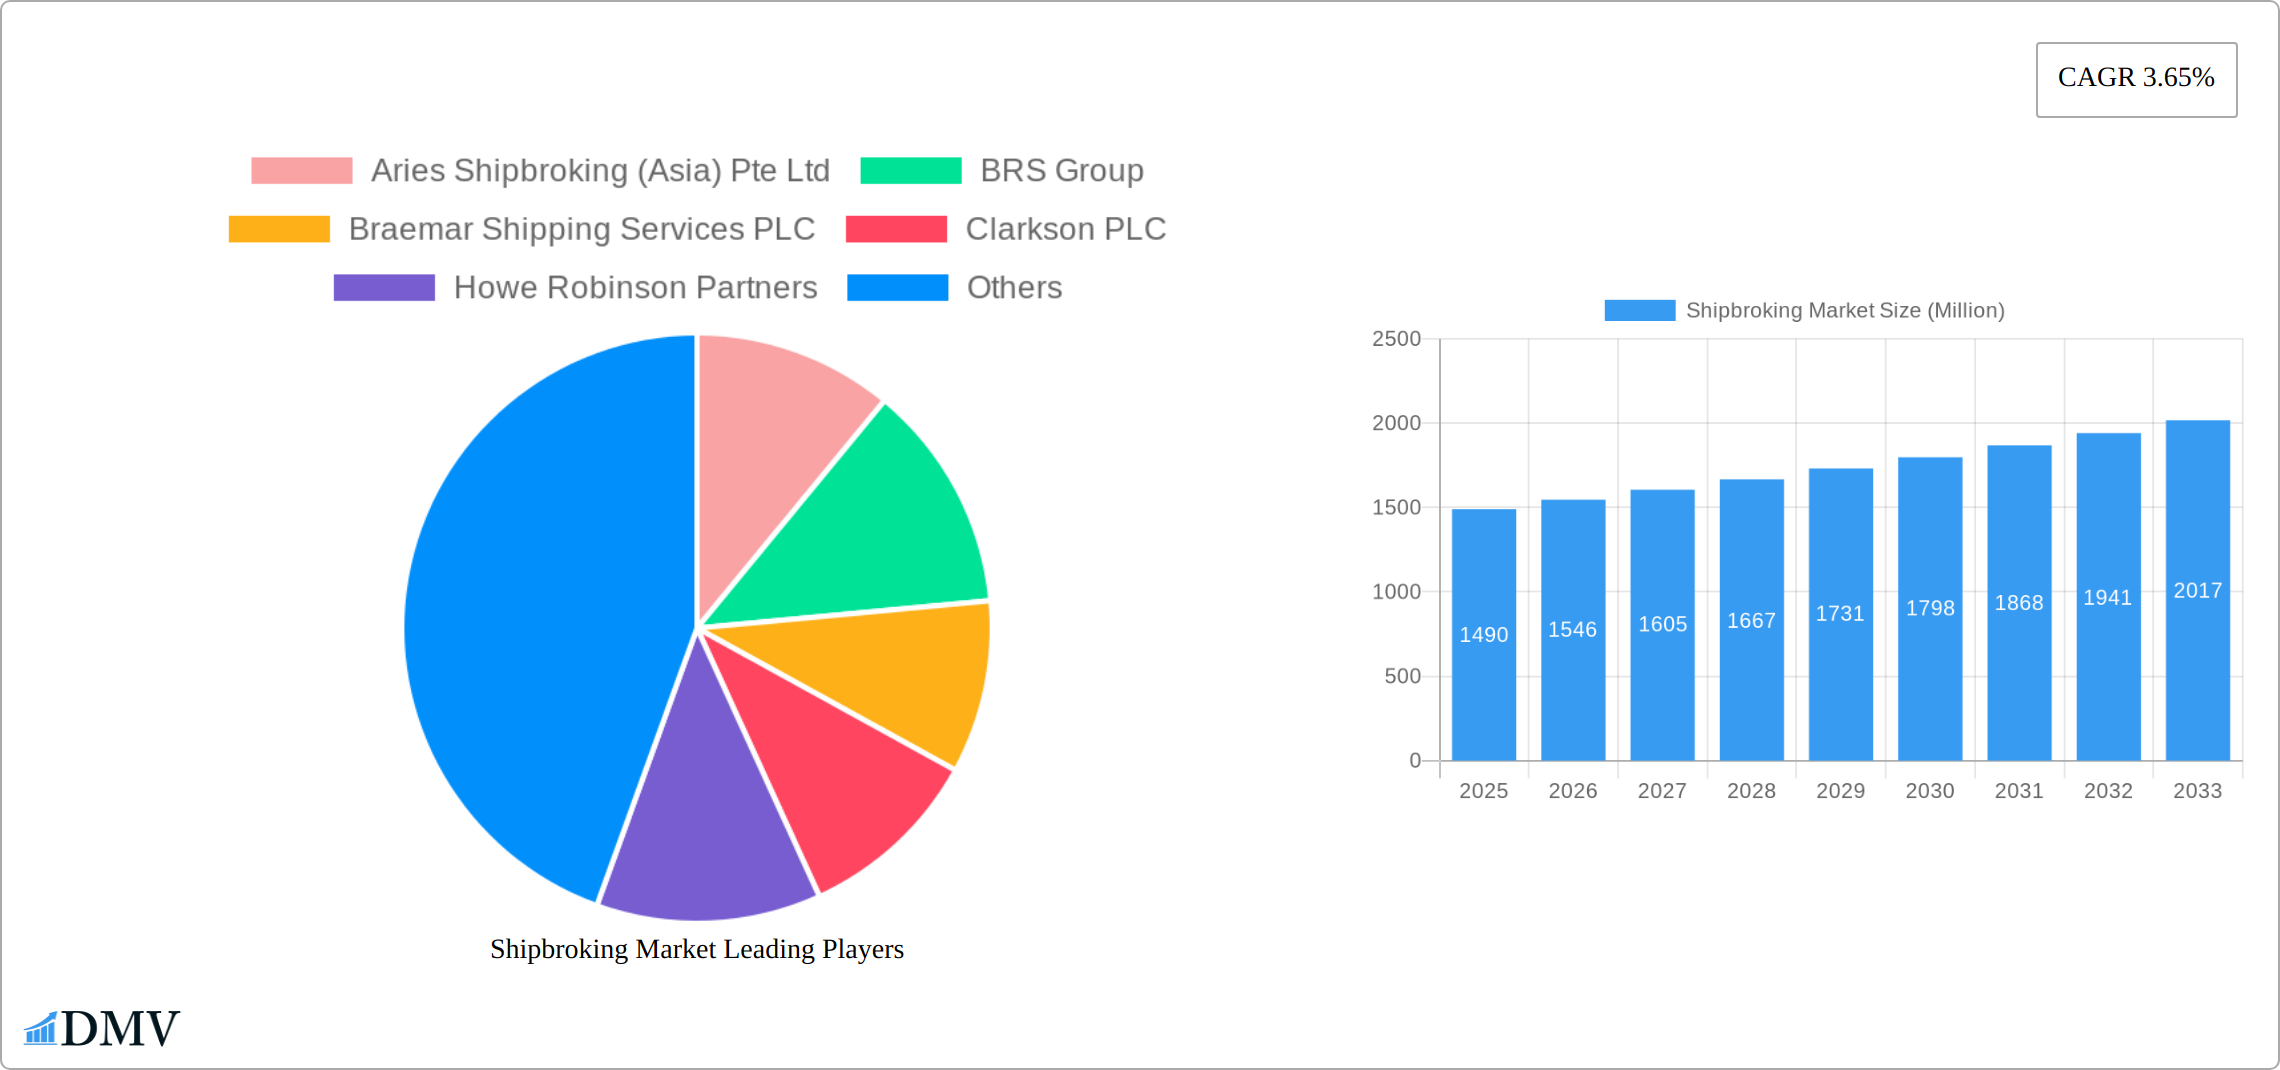
Shipbroking Market Market Size (In Billion)
The market's growth trajectory will likely be influenced by factors including fluctuating fuel prices, geopolitical events affecting trade routes, and technological advancements such as digitalization and blockchain applications in shipbroking processes. The competitive landscape is expected to remain dynamic, with existing players focusing on mergers and acquisitions, expansion into new markets, and enhancement of their digital platforms. Emerging players are also likely to enter the market, driven by innovative technologies and business models. This necessitates a proactive approach for shipbroking firms to adapt to industry changes and leverage technology to enhance their competitive edge. The forecast period of 2025-2033 presents significant opportunities for expansion, particularly in regions with growing maritime trade and emerging economies.
Shipbroking Market Company Market Share
Shipbroking Market Market Composition & Trends
The Shipbroking Market has evolved significantly over the study period from 2019 to 2033, with a base year set for 2025. This market is characterized by a high concentration of key players, with companies like Clarkson PLC and Braemar Shipping Services PLC holding significant market shares, estimated at around 20% and 15% respectively. Innovation within the sector is driven by the need for more efficient and transparent brokerage services, spurred by technological advancements such as blockchain and AI. The regulatory landscape is complex, with varying international maritime laws affecting operations. Substitute products, such as online freight marketplaces, pose a threat, yet the expertise and network of traditional shipbrokers remain unmatched. End-users in this market range from large shipping conglomerates to smaller shipping firms, all seeking to optimize their logistics and chartering operations. Mergers and acquisitions have been pivotal, with deal values in the past year reaching upwards of $500 Million, reflecting a trend towards consolidation to enhance market reach and service capabilities.
- Market Concentration: Dominated by top players like Clarkson PLC (20%) and Braemar Shipping Services PLC (15%).
- Innovation Catalysts: Adoption of blockchain and AI to enhance efficiency and transparency.
- Regulatory Landscapes: Navigating complex international maritime laws.
- Substitute Products: Competition from online freight marketplaces.
- End-User Profiles: Diverse, from large shipping conglomerates to smaller firms.
- M&A Activities: Recent deals valued at over $500 Million, indicating a trend towards consolidation.
Shipbroking Market Industry Evolution
The Shipbroking Market has demonstrated a dynamic and upward growth trajectory, experiencing a robust expansion from 2019 to 2024, with an impressive annual growth rate of approximately 5%. This evolution has been significantly shaped by the relentless pace of technological advancements. Digital platforms and sophisticated data analytics have emerged as pivotal forces, fundamentally transforming traditional brokerage practices. The adoption rate of these cutting-edge technologies has surged by over 30% within the last five years, a direct response to the escalating demand for real-time data and enhanced decision-making capabilities. Furthermore, evolving consumer demands, increasingly prioritizing sustainable and efficient shipping solutions, are acting as powerful catalysts for industry-wide innovation. The integration of the Internet of Things (IoT) and big data analytics into shipbroking operations has not only yielded substantial improvements in operational efficiency but has also facilitated proactive predictive maintenance and optimized route planning, collectively leading to an estimated 10% reduction in operational costs. Looking ahead to the forecast period from 2025 to 2033, the continued integration of advanced technologies and a steadfast commitment to sustainability are projected to be the primary drivers of further market growth, with anticipated Compound Annual Growth Rate (CAGR) of around 6%.
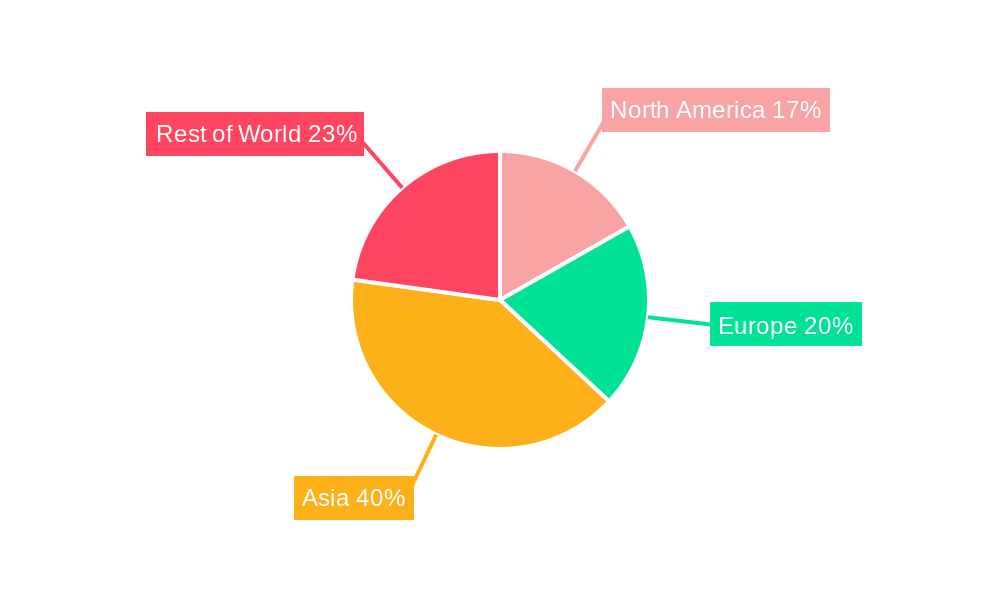
Leading Regions, Countries, or Segments in Shipbroking Market
The Asia-Pacific region has firmly established itself as the dominant force within the Shipbroking Market. This ascendancy is underpinned by substantial investments channeled into maritime infrastructure development and a consistently burgeoning demand for comprehensive shipping services. Within this dynamic landscape, countries like China and Singapore are at the vanguard. China's shipbroking sector, in particular, is witnessing remarkable expansion, with an annual growth rate of 7%, primarily propelled by its vast and ever-growing shipping industry. Singapore, leveraging its strategically advantageous geographical location and a well-established, robust regulatory framework, provides an exceptionally conducive environment that actively supports and fosters the growth of sophisticated shipbroking services.
- Investment Trends: Significant and ongoing investments are being directed towards enhancing maritime infrastructure, with a pronounced focus on key hubs like China and Singapore.
- Regulatory Support: Singapore's proactive and supportive regulatory environment plays a crucial role in facilitating and accelerating the growth of its shipbroking services sector.
- Demand Surge: The Asia-Pacific region is experiencing a pronounced surge in the demand for shipping services, a direct consequence of its robust economic expansion and increasing global trade engagement.
The preeminent position of the Asia-Pacific region is attributable to a confluence of influential factors. Primarily, the region's sustained economic growth has directly translated into a heightened demand for shipping services, thereby providing a strong impetus to the shipbroking market. Secondly, substantial investments poured into port infrastructure and the adoption of advanced technologies have significantly augmented the efficiency and capacity of shipping operations, solidifying the region's status as a premier hub for shipbroking activities. Finally, the presence of prominent and influential shipbroking firms within the region, such as Aries Shipbroking (Asia) Pte Ltd, further cements its leadership role in the global shipbroking arena.
Shipbroking Market Product Innovations
Innovations within the Shipbroking Market have been strategically centered on the enhancement of digital platforms and the seamless integration of advanced analytical tools to optimize and streamline operational workflows. The introduction of blockchain technology has marked a significant turning point, enabling transparent and highly secure transaction processes, thereby offering clients unparalleled levels of security and operational efficiency. Furthermore, the adept utilization of Artificial Intelligence (AI) and machine learning algorithms for predictive analytics has empowered the market with enhanced capabilities for forecasting market trends with greater accuracy and optimizing shipping routes, ultimately leading to improved overall performance and elevated client satisfaction.
Propelling Factors for Shipbroking Market Growth
The Shipbroking Market is propelled forward by a potent combination of several key growth drivers. Technological advancements, including the strategic integration of AI and blockchain technology, have demonstrably improved operational efficiencies across the board. From an economic perspective, the sustained global increase in trade volumes necessitates and drives the demand for more effective and responsive shipbroking services. Furthermore, the evolution and implementation of favorable regulatory frameworks, particularly those that champion digitalization and sustainability, provide significant impetus for market expansion. For instance, the International Maritime Organization's (IMO) ambitious initiatives aimed at reducing emissions are actively encouraging the industry to embrace greener shipping solutions, which in turn fosters a climate ripe for innovation within the shipbroking sector.
Obstacles in the Shipbroking Market Market
Despite its growth, the Shipbroking Market faces several obstacles. Regulatory challenges, such as varying international maritime laws, can complicate operations and increase costs. Supply chain disruptions, exacerbated by global events like pandemics, have impacted the timely delivery of services. Additionally, intense competitive pressures, with new entrants leveraging technology to disrupt traditional models, pose significant threats. These barriers have led to a reduction in market growth by an estimated 2% over the past year.
Future Opportunities in Shipbroking Market
The Shipbroking Market presents numerous future opportunities. The expansion into emerging markets, particularly in Africa and Latin America, offers untapped potential due to increasing trade activities. Technological advancements, such as autonomous ships and further integration of IoT, promise to revolutionize the industry. Moreover, shifting consumer trends towards sustainability and efficiency are driving demand for innovative shipbroking solutions that prioritize environmental impact.
Major Players in the Shipbroking Market Ecosystem
- Aries Shipbroking (Asia) Pte Ltd
- BRS Group
- Braemar Shipping Services PLC
- Clarkson PLC
- Howe Robinson Partners
- Simpson Spence Young
- Fearnleys A/S
- ACM Shipping Group PLC
- Chowgule Brothers Pvt Ltd
- Affinity (Shipping) LLP
List Not Exhaustive
Key Developments in Shipbroking Market Industry
- January 2024: The Danish shipping giant Maersk announced a significant long-term collaboration with its German counterpart, Hapag-Lloyd, consolidating hundreds of vessels under this partnership. This move is expected to enhance market dynamics by increasing operational efficiency and service quality.
- September 2023: Global container liner shipping business ZIM Integrated Shipping Services Ltd signed a new operational collaboration agreement spanning many trades with MSC, the industry leader. This partnership aims to improve service standards for ZIM's esteemed clientele and greatly increase operating efficiencies, thereby impacting market dynamics positively.
Strategic Shipbroking Market Market Forecast
The Shipbroking Market is poised for substantial growth over the forecast period from 2025 to 2033, driven by several catalysts. Technological innovations, such as the integration of AI and blockchain, will continue to enhance operational efficiencies and client satisfaction. The expansion into new markets, particularly in regions with burgeoning trade activities, presents significant growth opportunities. Additionally, the ongoing shift towards sustainability and efficiency in shipping practices is expected to drive demand for innovative shipbroking solutions, positioning the market for a promising future with a projected CAGR of around 6%.
Shipbroking Market Segmentation
-
1. Type
- 1.1. Dry Cargo Broking
- 1.2. Tanker Broking
- 1.3. Container Vessel Broking
- 1.4. Other Types
-
2. Service
- 2.1. Charting
- 2.2. Sales and Purchases
- 2.3. Offshore Services
- 2.4. Newbuilding Services
- 2.5. Salvage &Towage Services
-
3. Industry
- 3.1. Oil and Gas
- 3.2. Manufacturing
- 3.3. Aerospace and Defense
- 3.4. Government
- 3.5. Other Industries
Shipbroking Market Segmentation By Geography
-
1. North America
- 1.1. United States
- 1.2. Canada
- 1.3. Rest of North America
-
2. Europe
- 2.1. Germany
- 2.2. United Kingdom
- 2.3. France
- 2.4. Russia
- 2.5. Spain
- 2.6. Rest of Europe
-
3. Asia Pacific
- 3.1. India
- 3.2. China
- 3.3. Japan
- 3.4. Rest of Asia Pacific
-
4. South America
- 4.1. Brazil
- 4.2. Argentina
- 4.3. Rest of South America
-
5. Middle East and Africa
- 5.1. United Arab Emirates
- 5.2. Saudi Arabia
- 5.3. Rest of Middle East and Africa
Shipbroking Market Regional Market Share
Geographic Coverage of Shipbroking Market
Shipbroking Market REPORT HIGHLIGHTS
| Aspects | Details |
|---|---|
| Study Period | 2020-2034 |
| Base Year | 2025 |
| Estimated Year | 2026 |
| Forecast Period | 2026-2034 |
| Historical Period | 2020-2025 |
| Growth Rate | CAGR of 3.65% from 2020-2034 |
| Segmentation |
|
Table of Contents
- 1. Introduction
- 1.1. Research Scope
- 1.2. Market Segmentation
- 1.3. Research Objective
- 1.4. Definitions and Assumptions
- 2. Executive Summary
- 2.1. Market Snapshot
- 3. Market Dynamics
- 3.1. Market Drivers
- 3.2. Market Restrains
- 3.3. Market Trends
- 3.4. Market Opportunities
- 4. Market Factor Analysis
- 4.1. Porters Five Forces
- 4.1.1. Bargaining Power of Suppliers
- 4.1.2. Bargaining Power of Buyers
- 4.1.3. Threat of New Entrants
- 4.1.4. Threat of Substitutes
- 4.1.5. Competitive Rivalry
- 4.2. PESTEL analysis
- 4.3. BCG Analysis
- 4.3.1. Stars (High Growth, High Market Share)
- 4.3.2. Cash Cows (Low Growth, High Market Share)
- 4.3.3. Question Mark (High Growth, Low Market Share)
- 4.3.4. Dogs (Low Growth, Low Market Share)
- 4.4. Ansoff Matrix Analysis
- 4.5. Supply Chain Analysis
- 4.6. Regulatory Landscape
- 4.7. Current Market Potential and Opportunity Assessment (TAM–SAM–SOM Framework)
- 4.8. DMV Analyst Note
- 4.1. Porters Five Forces
- 5. Market Analysis, Insights and Forecast 2021-2033
- 5.1. Market Analysis, Insights and Forecast - by Type
- 5.1.1. Dry Cargo Broking
- 5.1.2. Tanker Broking
- 5.1.3. Container Vessel Broking
- 5.1.4. Other Types
- 5.2. Market Analysis, Insights and Forecast - by Service
- 5.2.1. Charting
- 5.2.2. Sales and Purchases
- 5.2.3. Offshore Services
- 5.2.4. Newbuilding Services
- 5.2.5. Salvage &Towage Services
- 5.3. Market Analysis, Insights and Forecast - by Industry
- 5.3.1. Oil and Gas
- 5.3.2. Manufacturing
- 5.3.3. Aerospace and Defense
- 5.3.4. Government
- 5.3.5. Other Industries
- 5.4. Market Analysis, Insights and Forecast - by Region
- 5.4.1. North America
- 5.4.2. Europe
- 5.4.3. Asia Pacific
- 5.4.4. South America
- 5.4.5. Middle East and Africa
- 5.1. Market Analysis, Insights and Forecast - by Type
- 6. Global Shipbroking Market Analysis, Insights and Forecast, 2021-2033
- 6.1. Market Analysis, Insights and Forecast - by Type
- 6.1.1. Dry Cargo Broking
- 6.1.2. Tanker Broking
- 6.1.3. Container Vessel Broking
- 6.1.4. Other Types
- 6.2. Market Analysis, Insights and Forecast - by Service
- 6.2.1. Charting
- 6.2.2. Sales and Purchases
- 6.2.3. Offshore Services
- 6.2.4. Newbuilding Services
- 6.2.5. Salvage &Towage Services
- 6.3. Market Analysis, Insights and Forecast - by Industry
- 6.3.1. Oil and Gas
- 6.3.2. Manufacturing
- 6.3.3. Aerospace and Defense
- 6.3.4. Government
- 6.3.5. Other Industries
- 6.1. Market Analysis, Insights and Forecast - by Type
- 7. North America Shipbroking Market Analysis, Insights and Forecast, 2020-2032
- 7.1. Market Analysis, Insights and Forecast - by Type
- 7.1.1. Dry Cargo Broking
- 7.1.2. Tanker Broking
- 7.1.3. Container Vessel Broking
- 7.1.4. Other Types
- 7.2. Market Analysis, Insights and Forecast - by Service
- 7.2.1. Charting
- 7.2.2. Sales and Purchases
- 7.2.3. Offshore Services
- 7.2.4. Newbuilding Services
- 7.2.5. Salvage &Towage Services
- 7.3. Market Analysis, Insights and Forecast - by Industry
- 7.3.1. Oil and Gas
- 7.3.2. Manufacturing
- 7.3.3. Aerospace and Defense
- 7.3.4. Government
- 7.3.5. Other Industries
- 7.1. Market Analysis, Insights and Forecast - by Type
- 8. Europe Shipbroking Market Analysis, Insights and Forecast, 2020-2032
- 8.1. Market Analysis, Insights and Forecast - by Type
- 8.1.1. Dry Cargo Broking
- 8.1.2. Tanker Broking
- 8.1.3. Container Vessel Broking
- 8.1.4. Other Types
- 8.2. Market Analysis, Insights and Forecast - by Service
- 8.2.1. Charting
- 8.2.2. Sales and Purchases
- 8.2.3. Offshore Services
- 8.2.4. Newbuilding Services
- 8.2.5. Salvage &Towage Services
- 8.3. Market Analysis, Insights and Forecast - by Industry
- 8.3.1. Oil and Gas
- 8.3.2. Manufacturing
- 8.3.3. Aerospace and Defense
- 8.3.4. Government
- 8.3.5. Other Industries
- 8.1. Market Analysis, Insights and Forecast - by Type
- 9. Asia Pacific Shipbroking Market Analysis, Insights and Forecast, 2020-2032
- 9.1. Market Analysis, Insights and Forecast - by Type
- 9.1.1. Dry Cargo Broking
- 9.1.2. Tanker Broking
- 9.1.3. Container Vessel Broking
- 9.1.4. Other Types
- 9.2. Market Analysis, Insights and Forecast - by Service
- 9.2.1. Charting
- 9.2.2. Sales and Purchases
- 9.2.3. Offshore Services
- 9.2.4. Newbuilding Services
- 9.2.5. Salvage &Towage Services
- 9.3. Market Analysis, Insights and Forecast - by Industry
- 9.3.1. Oil and Gas
- 9.3.2. Manufacturing
- 9.3.3. Aerospace and Defense
- 9.3.4. Government
- 9.3.5. Other Industries
- 9.1. Market Analysis, Insights and Forecast - by Type
- 10. South America Shipbroking Market Analysis, Insights and Forecast, 2020-2032
- 10.1. Market Analysis, Insights and Forecast - by Type
- 10.1.1. Dry Cargo Broking
- 10.1.2. Tanker Broking
- 10.1.3. Container Vessel Broking
- 10.1.4. Other Types
- 10.2. Market Analysis, Insights and Forecast - by Service
- 10.2.1. Charting
- 10.2.2. Sales and Purchases
- 10.2.3. Offshore Services
- 10.2.4. Newbuilding Services
- 10.2.5. Salvage &Towage Services
- 10.3. Market Analysis, Insights and Forecast - by Industry
- 10.3.1. Oil and Gas
- 10.3.2. Manufacturing
- 10.3.3. Aerospace and Defense
- 10.3.4. Government
- 10.3.5. Other Industries
- 10.1. Market Analysis, Insights and Forecast - by Type
- 11. Middle East and Africa Shipbroking Market Analysis, Insights and Forecast, 2020-2032
- 11.1. Market Analysis, Insights and Forecast - by Type
- 11.1.1. Dry Cargo Broking
- 11.1.2. Tanker Broking
- 11.1.3. Container Vessel Broking
- 11.1.4. Other Types
- 11.2. Market Analysis, Insights and Forecast - by Service
- 11.2.1. Charting
- 11.2.2. Sales and Purchases
- 11.2.3. Offshore Services
- 11.2.4. Newbuilding Services
- 11.2.5. Salvage &Towage Services
- 11.3. Market Analysis, Insights and Forecast - by Industry
- 11.3.1. Oil and Gas
- 11.3.2. Manufacturing
- 11.3.3. Aerospace and Defense
- 11.3.4. Government
- 11.3.5. Other Industries
- 11.1. Market Analysis, Insights and Forecast - by Type
- 12. Competitive Analysis
- 12.1. Company Profiles
- 12.1.1 Aries Shipbroking (Asia) Pte Ltd
- 12.1.1.1. Company Overview
- 12.1.1.2. Products
- 12.1.1.3. Company Financials
- 12.1.1.4. SWOT Analysis
- 12.1.2 BRS Group
- 12.1.2.1. Company Overview
- 12.1.2.2. Products
- 12.1.2.3. Company Financials
- 12.1.2.4. SWOT Analysis
- 12.1.3 Braemar Shipping Services PLC
- 12.1.3.1. Company Overview
- 12.1.3.2. Products
- 12.1.3.3. Company Financials
- 12.1.3.4. SWOT Analysis
- 12.1.4 Clarkson PLC
- 12.1.4.1. Company Overview
- 12.1.4.2. Products
- 12.1.4.3. Company Financials
- 12.1.4.4. SWOT Analysis
- 12.1.5 Howe Robinson Partners
- 12.1.5.1. Company Overview
- 12.1.5.2. Products
- 12.1.5.3. Company Financials
- 12.1.5.4. SWOT Analysis
- 12.1.6 Simpson Spense Young
- 12.1.6.1. Company Overview
- 12.1.6.2. Products
- 12.1.6.3. Company Financials
- 12.1.6.4. SWOT Analysis
- 12.1.7 Fearnleys A/S
- 12.1.7.1. Company Overview
- 12.1.7.2. Products
- 12.1.7.3. Company Financials
- 12.1.7.4. SWOT Analysis
- 12.1.8 ACM Shipping Group PLC
- 12.1.8.1. Company Overview
- 12.1.8.2. Products
- 12.1.8.3. Company Financials
- 12.1.8.4. SWOT Analysis
- 12.1.9 Chowgule Brothers Pvt Ltd
- 12.1.9.1. Company Overview
- 12.1.9.2. Products
- 12.1.9.3. Company Financials
- 12.1.9.4. SWOT Analysis
- 12.1.10 Affinity (Shipping) LLP**List Not Exhaustive
- 12.1.10.1. Company Overview
- 12.1.10.2. Products
- 12.1.10.3. Company Financials
- 12.1.10.4. SWOT Analysis
- 12.1.1 Aries Shipbroking (Asia) Pte Ltd
- 12.2. Market Entropy
- 12.2.1 Company's Key Areas Served
- 12.2.2 Recent Developments
- 12.3. Company Market Share Analysis 2025
- 12.3.1 Top 5 Companies Market Share Analysis
- 12.3.2 Top 3 Companies Market Share Analysis
- 12.4. List of Potential Customers
- 13. Research Methodology
List of Figures
- Figure 1: Global Shipbroking Market Revenue Breakdown (Million, %) by Region 2025 & 2033
- Figure 2: Global Shipbroking Market Volume Breakdown (Billion, %) by Region 2025 & 2033
- Figure 3: North America Shipbroking Market Revenue (Million), by Type 2025 & 2033
- Figure 4: North America Shipbroking Market Volume (Billion), by Type 2025 & 2033
- Figure 5: North America Shipbroking Market Revenue Share (%), by Type 2025 & 2033
- Figure 6: North America Shipbroking Market Volume Share (%), by Type 2025 & 2033
- Figure 7: North America Shipbroking Market Revenue (Million), by Service 2025 & 2033
- Figure 8: North America Shipbroking Market Volume (Billion), by Service 2025 & 2033
- Figure 9: North America Shipbroking Market Revenue Share (%), by Service 2025 & 2033
- Figure 10: North America Shipbroking Market Volume Share (%), by Service 2025 & 2033
- Figure 11: North America Shipbroking Market Revenue (Million), by Industry 2025 & 2033
- Figure 12: North America Shipbroking Market Volume (Billion), by Industry 2025 & 2033
- Figure 13: North America Shipbroking Market Revenue Share (%), by Industry 2025 & 2033
- Figure 14: North America Shipbroking Market Volume Share (%), by Industry 2025 & 2033
- Figure 15: North America Shipbroking Market Revenue (Million), by Country 2025 & 2033
- Figure 16: North America Shipbroking Market Volume (Billion), by Country 2025 & 2033
- Figure 17: North America Shipbroking Market Revenue Share (%), by Country 2025 & 2033
- Figure 18: North America Shipbroking Market Volume Share (%), by Country 2025 & 2033
- Figure 19: Europe Shipbroking Market Revenue (Million), by Type 2025 & 2033
- Figure 20: Europe Shipbroking Market Volume (Billion), by Type 2025 & 2033
- Figure 21: Europe Shipbroking Market Revenue Share (%), by Type 2025 & 2033
- Figure 22: Europe Shipbroking Market Volume Share (%), by Type 2025 & 2033
- Figure 23: Europe Shipbroking Market Revenue (Million), by Service 2025 & 2033
- Figure 24: Europe Shipbroking Market Volume (Billion), by Service 2025 & 2033
- Figure 25: Europe Shipbroking Market Revenue Share (%), by Service 2025 & 2033
- Figure 26: Europe Shipbroking Market Volume Share (%), by Service 2025 & 2033
- Figure 27: Europe Shipbroking Market Revenue (Million), by Industry 2025 & 2033
- Figure 28: Europe Shipbroking Market Volume (Billion), by Industry 2025 & 2033
- Figure 29: Europe Shipbroking Market Revenue Share (%), by Industry 2025 & 2033
- Figure 30: Europe Shipbroking Market Volume Share (%), by Industry 2025 & 2033
- Figure 31: Europe Shipbroking Market Revenue (Million), by Country 2025 & 2033
- Figure 32: Europe Shipbroking Market Volume (Billion), by Country 2025 & 2033
- Figure 33: Europe Shipbroking Market Revenue Share (%), by Country 2025 & 2033
- Figure 34: Europe Shipbroking Market Volume Share (%), by Country 2025 & 2033
- Figure 35: Asia Pacific Shipbroking Market Revenue (Million), by Type 2025 & 2033
- Figure 36: Asia Pacific Shipbroking Market Volume (Billion), by Type 2025 & 2033
- Figure 37: Asia Pacific Shipbroking Market Revenue Share (%), by Type 2025 & 2033
- Figure 38: Asia Pacific Shipbroking Market Volume Share (%), by Type 2025 & 2033
- Figure 39: Asia Pacific Shipbroking Market Revenue (Million), by Service 2025 & 2033
- Figure 40: Asia Pacific Shipbroking Market Volume (Billion), by Service 2025 & 2033
- Figure 41: Asia Pacific Shipbroking Market Revenue Share (%), by Service 2025 & 2033
- Figure 42: Asia Pacific Shipbroking Market Volume Share (%), by Service 2025 & 2033
- Figure 43: Asia Pacific Shipbroking Market Revenue (Million), by Industry 2025 & 2033
- Figure 44: Asia Pacific Shipbroking Market Volume (Billion), by Industry 2025 & 2033
- Figure 45: Asia Pacific Shipbroking Market Revenue Share (%), by Industry 2025 & 2033
- Figure 46: Asia Pacific Shipbroking Market Volume Share (%), by Industry 2025 & 2033
- Figure 47: Asia Pacific Shipbroking Market Revenue (Million), by Country 2025 & 2033
- Figure 48: Asia Pacific Shipbroking Market Volume (Billion), by Country 2025 & 2033
- Figure 49: Asia Pacific Shipbroking Market Revenue Share (%), by Country 2025 & 2033
- Figure 50: Asia Pacific Shipbroking Market Volume Share (%), by Country 2025 & 2033
- Figure 51: South America Shipbroking Market Revenue (Million), by Type 2025 & 2033
- Figure 52: South America Shipbroking Market Volume (Billion), by Type 2025 & 2033
- Figure 53: South America Shipbroking Market Revenue Share (%), by Type 2025 & 2033
- Figure 54: South America Shipbroking Market Volume Share (%), by Type 2025 & 2033
- Figure 55: South America Shipbroking Market Revenue (Million), by Service 2025 & 2033
- Figure 56: South America Shipbroking Market Volume (Billion), by Service 2025 & 2033
- Figure 57: South America Shipbroking Market Revenue Share (%), by Service 2025 & 2033
- Figure 58: South America Shipbroking Market Volume Share (%), by Service 2025 & 2033
- Figure 59: South America Shipbroking Market Revenue (Million), by Industry 2025 & 2033
- Figure 60: South America Shipbroking Market Volume (Billion), by Industry 2025 & 2033
- Figure 61: South America Shipbroking Market Revenue Share (%), by Industry 2025 & 2033
- Figure 62: South America Shipbroking Market Volume Share (%), by Industry 2025 & 2033
- Figure 63: South America Shipbroking Market Revenue (Million), by Country 2025 & 2033
- Figure 64: South America Shipbroking Market Volume (Billion), by Country 2025 & 2033
- Figure 65: South America Shipbroking Market Revenue Share (%), by Country 2025 & 2033
- Figure 66: South America Shipbroking Market Volume Share (%), by Country 2025 & 2033
- Figure 67: Middle East and Africa Shipbroking Market Revenue (Million), by Type 2025 & 2033
- Figure 68: Middle East and Africa Shipbroking Market Volume (Billion), by Type 2025 & 2033
- Figure 69: Middle East and Africa Shipbroking Market Revenue Share (%), by Type 2025 & 2033
- Figure 70: Middle East and Africa Shipbroking Market Volume Share (%), by Type 2025 & 2033
- Figure 71: Middle East and Africa Shipbroking Market Revenue (Million), by Service 2025 & 2033
- Figure 72: Middle East and Africa Shipbroking Market Volume (Billion), by Service 2025 & 2033
- Figure 73: Middle East and Africa Shipbroking Market Revenue Share (%), by Service 2025 & 2033
- Figure 74: Middle East and Africa Shipbroking Market Volume Share (%), by Service 2025 & 2033
- Figure 75: Middle East and Africa Shipbroking Market Revenue (Million), by Industry 2025 & 2033
- Figure 76: Middle East and Africa Shipbroking Market Volume (Billion), by Industry 2025 & 2033
- Figure 77: Middle East and Africa Shipbroking Market Revenue Share (%), by Industry 2025 & 2033
- Figure 78: Middle East and Africa Shipbroking Market Volume Share (%), by Industry 2025 & 2033
- Figure 79: Middle East and Africa Shipbroking Market Revenue (Million), by Country 2025 & 2033
- Figure 80: Middle East and Africa Shipbroking Market Volume (Billion), by Country 2025 & 2033
- Figure 81: Middle East and Africa Shipbroking Market Revenue Share (%), by Country 2025 & 2033
- Figure 82: Middle East and Africa Shipbroking Market Volume Share (%), by Country 2025 & 2033
List of Tables
- Table 1: Global Shipbroking Market Revenue Million Forecast, by Type 2020 & 2033
- Table 2: Global Shipbroking Market Volume Billion Forecast, by Type 2020 & 2033
- Table 3: Global Shipbroking Market Revenue Million Forecast, by Service 2020 & 2033
- Table 4: Global Shipbroking Market Volume Billion Forecast, by Service 2020 & 2033
- Table 5: Global Shipbroking Market Revenue Million Forecast, by Industry 2020 & 2033
- Table 6: Global Shipbroking Market Volume Billion Forecast, by Industry 2020 & 2033
- Table 7: Global Shipbroking Market Revenue Million Forecast, by Region 2020 & 2033
- Table 8: Global Shipbroking Market Volume Billion Forecast, by Region 2020 & 2033
- Table 9: Global Shipbroking Market Revenue Million Forecast, by Type 2020 & 2033
- Table 10: Global Shipbroking Market Volume Billion Forecast, by Type 2020 & 2033
- Table 11: Global Shipbroking Market Revenue Million Forecast, by Service 2020 & 2033
- Table 12: Global Shipbroking Market Volume Billion Forecast, by Service 2020 & 2033
- Table 13: Global Shipbroking Market Revenue Million Forecast, by Industry 2020 & 2033
- Table 14: Global Shipbroking Market Volume Billion Forecast, by Industry 2020 & 2033
- Table 15: Global Shipbroking Market Revenue Million Forecast, by Country 2020 & 2033
- Table 16: Global Shipbroking Market Volume Billion Forecast, by Country 2020 & 2033
- Table 17: United States Shipbroking Market Revenue (Million) Forecast, by Application 2020 & 2033
- Table 18: United States Shipbroking Market Volume (Billion) Forecast, by Application 2020 & 2033
- Table 19: Canada Shipbroking Market Revenue (Million) Forecast, by Application 2020 & 2033
- Table 20: Canada Shipbroking Market Volume (Billion) Forecast, by Application 2020 & 2033
- Table 21: Rest of North America Shipbroking Market Revenue (Million) Forecast, by Application 2020 & 2033
- Table 22: Rest of North America Shipbroking Market Volume (Billion) Forecast, by Application 2020 & 2033
- Table 23: Global Shipbroking Market Revenue Million Forecast, by Type 2020 & 2033
- Table 24: Global Shipbroking Market Volume Billion Forecast, by Type 2020 & 2033
- Table 25: Global Shipbroking Market Revenue Million Forecast, by Service 2020 & 2033
- Table 26: Global Shipbroking Market Volume Billion Forecast, by Service 2020 & 2033
- Table 27: Global Shipbroking Market Revenue Million Forecast, by Industry 2020 & 2033
- Table 28: Global Shipbroking Market Volume Billion Forecast, by Industry 2020 & 2033
- Table 29: Global Shipbroking Market Revenue Million Forecast, by Country 2020 & 2033
- Table 30: Global Shipbroking Market Volume Billion Forecast, by Country 2020 & 2033
- Table 31: Germany Shipbroking Market Revenue (Million) Forecast, by Application 2020 & 2033
- Table 32: Germany Shipbroking Market Volume (Billion) Forecast, by Application 2020 & 2033
- Table 33: United Kingdom Shipbroking Market Revenue (Million) Forecast, by Application 2020 & 2033
- Table 34: United Kingdom Shipbroking Market Volume (Billion) Forecast, by Application 2020 & 2033
- Table 35: France Shipbroking Market Revenue (Million) Forecast, by Application 2020 & 2033
- Table 36: France Shipbroking Market Volume (Billion) Forecast, by Application 2020 & 2033
- Table 37: Russia Shipbroking Market Revenue (Million) Forecast, by Application 2020 & 2033
- Table 38: Russia Shipbroking Market Volume (Billion) Forecast, by Application 2020 & 2033
- Table 39: Spain Shipbroking Market Revenue (Million) Forecast, by Application 2020 & 2033
- Table 40: Spain Shipbroking Market Volume (Billion) Forecast, by Application 2020 & 2033
- Table 41: Rest of Europe Shipbroking Market Revenue (Million) Forecast, by Application 2020 & 2033
- Table 42: Rest of Europe Shipbroking Market Volume (Billion) Forecast, by Application 2020 & 2033
- Table 43: Global Shipbroking Market Revenue Million Forecast, by Type 2020 & 2033
- Table 44: Global Shipbroking Market Volume Billion Forecast, by Type 2020 & 2033
- Table 45: Global Shipbroking Market Revenue Million Forecast, by Service 2020 & 2033
- Table 46: Global Shipbroking Market Volume Billion Forecast, by Service 2020 & 2033
- Table 47: Global Shipbroking Market Revenue Million Forecast, by Industry 2020 & 2033
- Table 48: Global Shipbroking Market Volume Billion Forecast, by Industry 2020 & 2033
- Table 49: Global Shipbroking Market Revenue Million Forecast, by Country 2020 & 2033
- Table 50: Global Shipbroking Market Volume Billion Forecast, by Country 2020 & 2033
- Table 51: India Shipbroking Market Revenue (Million) Forecast, by Application 2020 & 2033
- Table 52: India Shipbroking Market Volume (Billion) Forecast, by Application 2020 & 2033
- Table 53: China Shipbroking Market Revenue (Million) Forecast, by Application 2020 & 2033
- Table 54: China Shipbroking Market Volume (Billion) Forecast, by Application 2020 & 2033
- Table 55: Japan Shipbroking Market Revenue (Million) Forecast, by Application 2020 & 2033
- Table 56: Japan Shipbroking Market Volume (Billion) Forecast, by Application 2020 & 2033
- Table 57: Rest of Asia Pacific Shipbroking Market Revenue (Million) Forecast, by Application 2020 & 2033
- Table 58: Rest of Asia Pacific Shipbroking Market Volume (Billion) Forecast, by Application 2020 & 2033
- Table 59: Global Shipbroking Market Revenue Million Forecast, by Type 2020 & 2033
- Table 60: Global Shipbroking Market Volume Billion Forecast, by Type 2020 & 2033
- Table 61: Global Shipbroking Market Revenue Million Forecast, by Service 2020 & 2033
- Table 62: Global Shipbroking Market Volume Billion Forecast, by Service 2020 & 2033
- Table 63: Global Shipbroking Market Revenue Million Forecast, by Industry 2020 & 2033
- Table 64: Global Shipbroking Market Volume Billion Forecast, by Industry 2020 & 2033
- Table 65: Global Shipbroking Market Revenue Million Forecast, by Country 2020 & 2033
- Table 66: Global Shipbroking Market Volume Billion Forecast, by Country 2020 & 2033
- Table 67: Brazil Shipbroking Market Revenue (Million) Forecast, by Application 2020 & 2033
- Table 68: Brazil Shipbroking Market Volume (Billion) Forecast, by Application 2020 & 2033
- Table 69: Argentina Shipbroking Market Revenue (Million) Forecast, by Application 2020 & 2033
- Table 70: Argentina Shipbroking Market Volume (Billion) Forecast, by Application 2020 & 2033
- Table 71: Rest of South America Shipbroking Market Revenue (Million) Forecast, by Application 2020 & 2033
- Table 72: Rest of South America Shipbroking Market Volume (Billion) Forecast, by Application 2020 & 2033
- Table 73: Global Shipbroking Market Revenue Million Forecast, by Type 2020 & 2033
- Table 74: Global Shipbroking Market Volume Billion Forecast, by Type 2020 & 2033
- Table 75: Global Shipbroking Market Revenue Million Forecast, by Service 2020 & 2033
- Table 76: Global Shipbroking Market Volume Billion Forecast, by Service 2020 & 2033
- Table 77: Global Shipbroking Market Revenue Million Forecast, by Industry 2020 & 2033
- Table 78: Global Shipbroking Market Volume Billion Forecast, by Industry 2020 & 2033
- Table 79: Global Shipbroking Market Revenue Million Forecast, by Country 2020 & 2033
- Table 80: Global Shipbroking Market Volume Billion Forecast, by Country 2020 & 2033
- Table 81: United Arab Emirates Shipbroking Market Revenue (Million) Forecast, by Application 2020 & 2033
- Table 82: United Arab Emirates Shipbroking Market Volume (Billion) Forecast, by Application 2020 & 2033
- Table 83: Saudi Arabia Shipbroking Market Revenue (Million) Forecast, by Application 2020 & 2033
- Table 84: Saudi Arabia Shipbroking Market Volume (Billion) Forecast, by Application 2020 & 2033
- Table 85: Rest of Middle East and Africa Shipbroking Market Revenue (Million) Forecast, by Application 2020 & 2033
- Table 86: Rest of Middle East and Africa Shipbroking Market Volume (Billion) Forecast, by Application 2020 & 2033
Frequently Asked Questions
1. What is the projected Compound Annual Growth Rate (CAGR) of the Shipbroking Market?
The projected CAGR is approximately 3.65%.
2. Which companies are prominent players in the Shipbroking Market?
Key companies in the market include Aries Shipbroking (Asia) Pte Ltd, BRS Group, Braemar Shipping Services PLC, Clarkson PLC, Howe Robinson Partners, Simpson Spense Young, Fearnleys A/S, ACM Shipping Group PLC, Chowgule Brothers Pvt Ltd, Affinity (Shipping) LLP**List Not Exhaustive.
3. What are the main segments of the Shipbroking Market?
The market segments include Type, Service, Industry.
4. Can you provide details about the market size?
The market size is estimated to be USD 1.49 Million as of 2022.
5. What are some drivers contributing to market growth?
Rise in Maritime Transport is Driving the Market; The Increasing Interconnectedness of Global Markets.
6. What are the notable trends driving market growth?
Rise in Oil and Gas Industry is Driving the Shipbroking Market.
7. Are there any restraints impacting market growth?
Rise in Maritime Transport is Driving the Market; The Increasing Interconnectedness of Global Markets.
8. Can you provide examples of recent developments in the market?
January 2024: The Danish shipping giant Maersk announced a significant long-term collaboration with its German counterpart, Hapag-Lloyd, consolidating hundreds of vessels under this partnership.September 2023: Global container liner shipping business ZIM Integrated Shipping Services Ltd signed a new operational collaboration agreement spanning many trades with MSC, the industry leader. This partnership is intended to improve service standards for ZIM's esteemed clientele and greatly increase operating efficiencies.
9. What pricing options are available for accessing the report?
Pricing options include single-user, multi-user, and enterprise licenses priced at USD 4750, USD 5250, and USD 8750 respectively.
10. Is the market size provided in terms of value or volume?
The market size is provided in terms of value, measured in Million and volume, measured in Billion.
11. Are there any specific market keywords associated with the report?
Yes, the market keyword associated with the report is "Shipbroking Market," which aids in identifying and referencing the specific market segment covered.
12. How do I determine which pricing option suits my needs best?
The pricing options vary based on user requirements and access needs. Individual users may opt for single-user licenses, while businesses requiring broader access may choose multi-user or enterprise licenses for cost-effective access to the report.
13. Are there any additional resources or data provided in the Shipbroking Market report?
While the report offers comprehensive insights, it's advisable to review the specific contents or supplementary materials provided to ascertain if additional resources or data are available.
14. How can I stay updated on further developments or reports in the Shipbroking Market?
To stay informed about further developments, trends, and reports in the Shipbroking Market, consider subscribing to industry newsletters, following relevant companies and organizations, or regularly checking reputable industry news sources and publications.
Methodology
Step 1 - Identification of Relevant Samples Size from Population Database


Step 2 - Approaches for Defining Global Market Size (Value, Volume* & Price*)

Note*: In applicable scenarios
Step 3 - Data Sources
Primary Research
- Web Analytics
- Survey Reports
- Research Institute
- Latest Research Reports
- Opinion Leaders
Secondary Research
- Annual Reports
- White Paper
- Latest Press Release
- Industry Association
- Paid Database
- Investor Presentations

Step 4 - Data Triangulation
Involves using different sources of information in order to increase the validity of a study
These sources are likely to be stakeholders in a program - participants, other researchers, program staff, other community members, and so on.
Then we put all data in single framework & apply various statistical tools to find out the dynamic on the market.
During the analysis stage, feedback from the stakeholder groups would be compared to determine areas of agreement as well as areas of divergence