

Key Insights
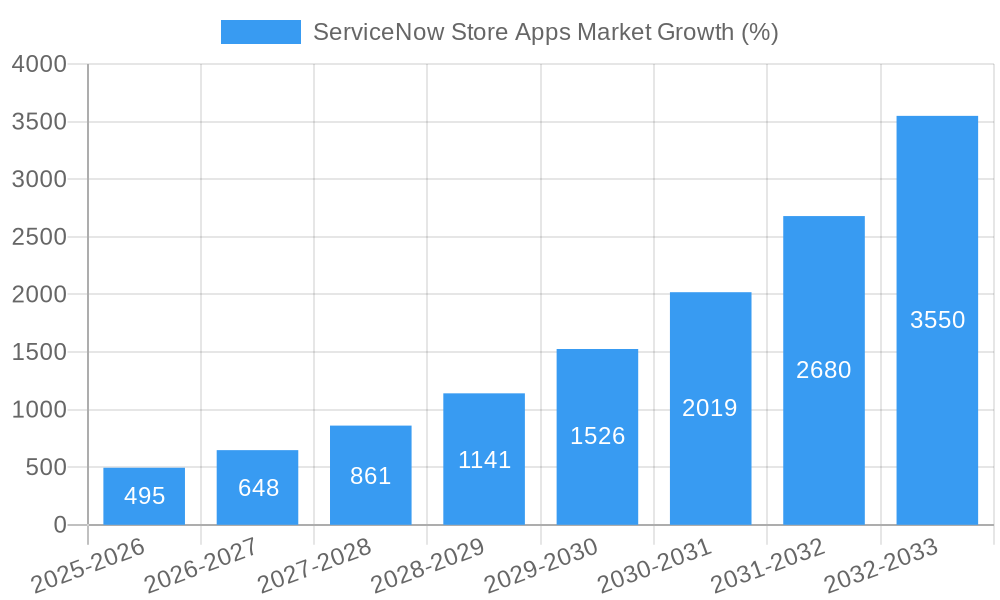
The ServiceNow Store Apps market is experiencing robust growth, driven by the increasing adoption of cloud-based solutions and the rising demand for improved operational efficiency among enterprises of all sizes. The market's Compound Annual Growth Rate (CAGR) of 32.73% from 2019 to 2024 indicates a significant upward trajectory, projected to continue through 2033. This expansion is fueled by several key factors. Firstly, the shift towards digital transformation and the need for agile business processes are compelling organizations to leverage ServiceNow's platform and its extensive app ecosystem. Secondly, the availability of specialized apps catering to diverse industry needs, from IT service management to HR and customer service, enhances the platform's value proposition and broadens its appeal across various sectors. Thirdly, the ease of integration with existing enterprise systems simplifies deployment and minimizes disruption, further encouraging adoption. The market is segmented by enterprise size (SMEs and large enterprises) and by app type (cloud-based and web-based), with cloud-based solutions currently dominating due to their scalability and accessibility. Major players such as ServiceNow, IBM, Microsoft, and others are actively contributing to market growth through continuous innovation, strategic partnerships, and acquisitions. Geographic expansion, particularly in rapidly developing economies of Asia-Pacific, further contributes to the overall market expansion. However, factors such as the complexity of integration with legacy systems and the need for specialized expertise in app development and deployment could potentially restrain growth to some extent.
The forecast period of 2025-2033 presents significant opportunities for market expansion. As businesses increasingly prioritize automation and process optimization, the demand for specialized ServiceNow apps is expected to surge. This growth will likely be driven by the expansion of the existing app store with a wider variety of niche solutions, an increasing number of ISVs developing and integrating apps into the ServiceNow platform, and a continued emphasis on enhancing user experience. The competitive landscape will remain dynamic, with existing players striving to maintain their market share and new entrants continuously seeking opportunities for growth. The focus on enhancing security, improving interoperability, and providing robust support will be critical to success in this highly competitive and rapidly evolving market.

ServiceNow Store Apps Market: A Comprehensive Report (2019-2033)
This insightful report provides a detailed analysis of the ServiceNow Store Apps Market, offering valuable insights for stakeholders seeking to understand market dynamics, competitive landscapes, and future growth opportunities. Covering the period 2019-2033, with a base year of 2025 and a forecast period of 2025-2033, this report is essential for strategic decision-making. The market is valued at xx Million in 2025 and is projected to reach xx Million by 2033, exhibiting a robust CAGR of xx%.
ServiceNow Store Apps Market Market Composition & Trends
This section delves into the intricate composition of the ServiceNow Store Apps Market, analyzing market concentration, innovation drivers, regulatory influences, substitute products, end-user profiles, and merger & acquisition (M&A) activities. We examine the market share distribution amongst key players, revealing a moderately concentrated market with a few dominant players holding significant shares. The report also quantifies the financial impact of M&A activities within the sector, analyzing deal values over the historical period (2019-2024) and providing projections for the forecast period. Innovation is fueled by increasing demand for enhanced workflow automation and integration within the ServiceNow ecosystem. Regulatory compliance requirements, particularly regarding data privacy and security, heavily influence market dynamics. The emergence of open-source alternatives and the increasing adoption of competing platforms pose a constant threat. Finally, the report profiles end-users, focusing on their specific needs and preferences which directly influence the demand for various ServiceNow store applications.
- Market Concentration: xx% held by top 5 players in 2024.
- M&A Deal Value (2019-2024): xx Million
- Predicted M&A Deal Value (2025-2033): xx Million
- Key End-User Segments: Large Enterprises (xx%), SMEs (xx%), and Government (xx%)
ServiceNow Store Apps Market Industry Evolution
This section meticulously examines the ServiceNow Store Apps Market's evolutionary trajectory, charting its growth path, technological advancements, and the ever-shifting consumer demands. We analyze the historical growth rates (2019-2024) and project future growth trajectories (2025-2033). Technological advancements, such as AI-powered automation and enhanced integration capabilities, are closely scrutinized, illustrating their transformative impact on the market. The report also addresses evolving consumer preferences, including a growing emphasis on cloud-based solutions and the demand for greater customization and seamless integration with existing IT infrastructure. The increasing adoption of ServiceNow itself across various industries fuels demand for supplementary apps. We provide specific data points, including adoption rates across different segments and regions, to offer a granular understanding of the market's evolution.
Leading Regions, Countries, or Segments in ServiceNow Store Apps Market
This segment identifies the leading regions, countries, and market segments within the ServiceNow Store Apps Market. We analyze the factors contributing to their dominance, providing insights into investment trends, regulatory support, and market maturity.
By Enterprise Size: Large Enterprises currently dominate the market due to their greater IT budgets and complexity of operations requiring sophisticated ServiceNow app integrations. However, the SME segment is expected to exhibit higher growth rates in the forecast period.
By Type: Cloud-based solutions are rapidly outpacing web-based solutions due to scalability, accessibility, and cost-effectiveness.
Key Drivers:
- High adoption of ServiceNow platform.
- Increased investment in digital transformation initiatives.
- Stringent regulatory compliance requirements.
ServiceNow Store Apps Market Product Innovations
The ServiceNow Store Apps Market showcases continuous product innovation, with new applications offering enhanced functionalities and improved performance. Recent releases feature advanced integrations with other enterprise software, AI-driven automation capabilities, and improved user interfaces. This drive for better user experience, coupled with technological advancements, ensures that businesses can streamline their operations and enhance productivity. Unique selling propositions, such as specialized industry solutions and enhanced security features, are critical differentiators in this competitive space.
Propelling Factors for ServiceNow Store Apps Market Growth
Several factors fuel the growth of the ServiceNow Store Apps Market. Technological advancements, such as the integration of AI and machine learning, drive efficiency gains and attract new users. The increasing adoption of cloud-based solutions lowers barriers to entry and fosters widespread use. Favorable regulatory environments in certain regions further stimulate market expansion. The rising need for improved IT service management (ITSM) and digital transformation initiatives across industries are strong tailwinds for market growth.
Obstacles in the ServiceNow Store Apps Market Market
Despite the significant growth potential, several obstacles hinder market expansion. Regulatory compliance costs and complexities can be significant, particularly for smaller vendors. Supply chain disruptions can impact product availability and lead times. Intense competition from both established and emerging players poses a major challenge. Pricing pressures and the need for constant innovation to remain competitive also restrict profit margins.
Future Opportunities in ServiceNow Store Apps Market
The ServiceNow Store Apps Market presents numerous promising opportunities. The expansion into emerging markets, particularly in developing economies, holds vast untapped potential. New technologies, such as the Internet of Things (IoT) integration and advanced analytics, offer significant growth avenues. The increasing demand for niche solutions tailored to specific industry needs and the development of enhanced security features will continue to drive demand.
Major Players in the ServiceNow Store Apps Market Ecosystem
- SAILPOINT TECHNOLOGIES INC
- IBM Corporation
- teamviewer
- PagerDuty
- Microsoft Corporation
- xMatters Inc
- Cisco Systems Inc
- Okta Inc
- Talkdesk Inc
- Dynatrace LLC
Key Developments in ServiceNow Store Apps Market Industry
May 2023: xtype launched xtype View, a free multi-instance viewer and platform engineering dashboard for ServiceNow, improving monitoring and reducing configuration discrepancies. This significantly enhances the user experience and increases adoption rates.
March 2023: Anglepoint launched an IBM Licensing for Software Asset Management application on the ServiceNow app store, improving IBM software management within the ServiceNow environment. This complements existing ServiceNow offerings and provides a complete solution for IBM software management.
Strategic ServiceNow Store Apps Market Market Forecast
The ServiceNow Store Apps Market is poised for sustained growth, driven by technological innovations, increasing enterprise adoption of cloud solutions, and a rising need for efficient IT service management. The expanding market in emerging economies and the development of tailored solutions for specific industries will continue to create new opportunities. The market’s future prospects are exceptionally positive, indicating significant potential for both established players and new entrants.
ServiceNow Store Apps Market Segmentation
-
1. Type
- 1.1. Cloud-Based
- 1.2. Web- Based
-
2. Enterprise Size
- 2.1. Small and Medium Enterprises (SMEs)
- 2.2. Large Enterprises
ServiceNow Store Apps Market Segmentation By Geography
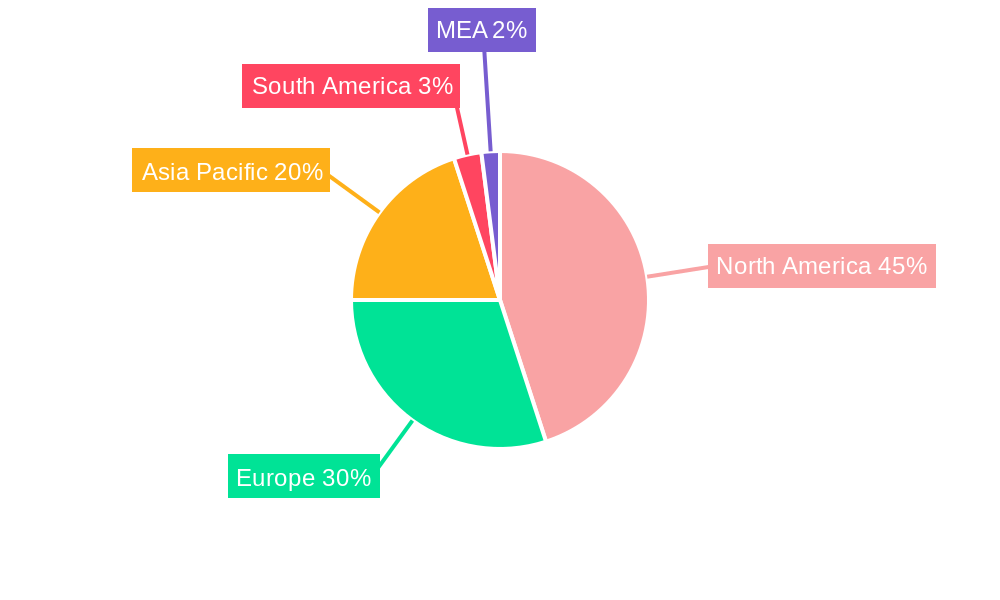
- 1. North America
- 2. Europe
- 3. Asia
- 4. Latin America
- 5. Middle East and Africa
ServiceNow Store Apps Market REPORT HIGHLIGHTS
| Aspects | Details |
|---|---|
| Study Period | 2019-2033 |
| Base Year | 2024 |
| Estimated Year | 2025 |
| Forecast Period | 2025-2033 |
| Historical Period | 2019-2024 |
| Growth Rate | CAGR of 32.73% from 2019-2033 |
| Segmentation |
|
Table of Contents
- 1. Introduction
- 1.1. Research Scope
- 1.2. Market Segmentation
- 1.3. Research Methodology
- 1.4. Definitions and Assumptions
- 2. Executive Summary
- 2.1. Introduction
- 3. Market Dynamics
- 3.1. Introduction
- 3.2. Market Drivers
- 3.2.1. Rise in adoption of cloud services and cloud computing; Rise in digital platforms and adoption of advance technologies
- 3.3. Market Restrains
- 3.3.1. High upfront and licensing costs
- 3.4. Market Trends
- 3.4.1. Cloud-Based is Expected to Hold Significant Share of the Market
- 4. Market Factor Analysis
- 4.1. Porters Five Forces
- 4.2. Supply/Value Chain
- 4.3. PESTEL analysis
- 4.4. Market Entropy
- 4.5. Patent/Trademark Analysis
- 5. Global ServiceNow Store Apps Market Analysis, Insights and Forecast, 2019-2031
- 5.1. Market Analysis, Insights and Forecast - by Type
- 5.1.1. Cloud-Based
- 5.1.2. Web- Based
- 5.2. Market Analysis, Insights and Forecast - by Enterprise Size
- 5.2.1. Small and Medium Enterprises (SMEs)
- 5.2.2. Large Enterprises
- 5.3. Market Analysis, Insights and Forecast - by Region
- 5.3.1. North America
- 5.3.2. Europe
- 5.3.3. Asia
- 5.3.4. Latin America
- 5.3.5. Middle East and Africa
- 5.1. Market Analysis, Insights and Forecast - by Type
- 6. North America ServiceNow Store Apps Market Analysis, Insights and Forecast, 2019-2031
- 6.1. Market Analysis, Insights and Forecast - by Type
- 6.1.1. Cloud-Based
- 6.1.2. Web- Based
- 6.2. Market Analysis, Insights and Forecast - by Enterprise Size
- 6.2.1. Small and Medium Enterprises (SMEs)
- 6.2.2. Large Enterprises
- 6.1. Market Analysis, Insights and Forecast - by Type
- 7. Europe ServiceNow Store Apps Market Analysis, Insights and Forecast, 2019-2031
- 7.1. Market Analysis, Insights and Forecast - by Type
- 7.1.1. Cloud-Based
- 7.1.2. Web- Based
- 7.2. Market Analysis, Insights and Forecast - by Enterprise Size
- 7.2.1. Small and Medium Enterprises (SMEs)
- 7.2.2. Large Enterprises
- 7.1. Market Analysis, Insights and Forecast - by Type
- 8. Asia ServiceNow Store Apps Market Analysis, Insights and Forecast, 2019-2031
- 8.1. Market Analysis, Insights and Forecast - by Type
- 8.1.1. Cloud-Based
- 8.1.2. Web- Based
- 8.2. Market Analysis, Insights and Forecast - by Enterprise Size
- 8.2.1. Small and Medium Enterprises (SMEs)
- 8.2.2. Large Enterprises
- 8.1. Market Analysis, Insights and Forecast - by Type
- 9. Latin America ServiceNow Store Apps Market Analysis, Insights and Forecast, 2019-2031
- 9.1. Market Analysis, Insights and Forecast - by Type
- 9.1.1. Cloud-Based
- 9.1.2. Web- Based
- 9.2. Market Analysis, Insights and Forecast - by Enterprise Size
- 9.2.1. Small and Medium Enterprises (SMEs)
- 9.2.2. Large Enterprises
- 9.1. Market Analysis, Insights and Forecast - by Type
- 10. Middle East and Africa ServiceNow Store Apps Market Analysis, Insights and Forecast, 2019-2031
- 10.1. Market Analysis, Insights and Forecast - by Type
- 10.1.1. Cloud-Based
- 10.1.2. Web- Based
- 10.2. Market Analysis, Insights and Forecast - by Enterprise Size
- 10.2.1. Small and Medium Enterprises (SMEs)
- 10.2.2. Large Enterprises
- 10.1. Market Analysis, Insights and Forecast - by Type
- 11. North America ServiceNow Store Apps Market Analysis, Insights and Forecast, 2019-2031
- 11.1. Market Analysis, Insights and Forecast - By Country/Sub-region
- 11.1.1 United States
- 11.1.2 Canada
- 11.1.3 Mexico
- 12. Europe ServiceNow Store Apps Market Analysis, Insights and Forecast, 2019-2031
- 12.1. Market Analysis, Insights and Forecast - By Country/Sub-region
- 12.1.1 Germany
- 12.1.2 United Kingdom
- 12.1.3 France
- 12.1.4 Spain
- 12.1.5 Italy
- 12.1.6 Spain
- 12.1.7 Belgium
- 12.1.8 Netherland
- 12.1.9 Nordics
- 12.1.10 Rest of Europe
- 13. Asia Pacific ServiceNow Store Apps Market Analysis, Insights and Forecast, 2019-2031
- 13.1. Market Analysis, Insights and Forecast - By Country/Sub-region
- 13.1.1 China
- 13.1.2 Japan
- 13.1.3 India
- 13.1.4 South Korea
- 13.1.5 Southeast Asia
- 13.1.6 Australia
- 13.1.7 Indonesia
- 13.1.8 Phillipes
- 13.1.9 Singapore
- 13.1.10 Thailandc
- 13.1.11 Rest of Asia Pacific
- 14. South America ServiceNow Store Apps Market Analysis, Insights and Forecast, 2019-2031
- 14.1. Market Analysis, Insights and Forecast - By Country/Sub-region
- 14.1.1 Brazil
- 14.1.2 Argentina
- 14.1.3 Peru
- 14.1.4 Chile
- 14.1.5 Colombia
- 14.1.6 Ecuador
- 14.1.7 Venezuela
- 14.1.8 Rest of South America
- 15. North America ServiceNow Store Apps Market Analysis, Insights and Forecast, 2019-2031
- 15.1. Market Analysis, Insights and Forecast - By Country/Sub-region
- 15.1.1 United States
- 15.1.2 Canada
- 15.1.3 Mexico
- 16. MEA ServiceNow Store Apps Market Analysis, Insights and Forecast, 2019-2031
- 16.1. Market Analysis, Insights and Forecast - By Country/Sub-region
- 16.1.1 United Arab Emirates
- 16.1.2 Saudi Arabia
- 16.1.3 South Africa
- 16.1.4 Rest of Middle East and Africa
- 17. Competitive Analysis
- 17.1. Global Market Share Analysis 2024
- 17.2. Company Profiles
- 17.2.1 SAILPOINT TECHNOLOGIES INC
- 17.2.1.1. Overview
- 17.2.1.2. Products
- 17.2.1.3. SWOT Analysis
- 17.2.1.4. Recent Developments
- 17.2.1.5. Financials (Based on Availability)
- 17.2.2 IBM Corporation
- 17.2.2.1. Overview
- 17.2.2.2. Products
- 17.2.2.3. SWOT Analysis
- 17.2.2.4. Recent Developments
- 17.2.2.5. Financials (Based on Availability)
- 17.2.3 teamviewer
- 17.2.3.1. Overview
- 17.2.3.2. Products
- 17.2.3.3. SWOT Analysis
- 17.2.3.4. Recent Developments
- 17.2.3.5. Financials (Based on Availability)
- 17.2.4 PagerDuty
- 17.2.4.1. Overview
- 17.2.4.2. Products
- 17.2.4.3. SWOT Analysis
- 17.2.4.4. Recent Developments
- 17.2.4.5. Financials (Based on Availability)
- 17.2.5 Microsoft Corporation*List Not Exhaustive
- 17.2.5.1. Overview
- 17.2.5.2. Products
- 17.2.5.3. SWOT Analysis
- 17.2.5.4. Recent Developments
- 17.2.5.5. Financials (Based on Availability)
- 17.2.6 xMatters Inc
- 17.2.6.1. Overview
- 17.2.6.2. Products
- 17.2.6.3. SWOT Analysis
- 17.2.6.4. Recent Developments
- 17.2.6.5. Financials (Based on Availability)
- 17.2.7 Cisco Systems Inc
- 17.2.7.1. Overview
- 17.2.7.2. Products
- 17.2.7.3. SWOT Analysis
- 17.2.7.4. Recent Developments
- 17.2.7.5. Financials (Based on Availability)
- 17.2.8 Okta Inc
- 17.2.8.1. Overview
- 17.2.8.2. Products
- 17.2.8.3. SWOT Analysis
- 17.2.8.4. Recent Developments
- 17.2.8.5. Financials (Based on Availability)
- 17.2.9 Talkdesk Inc
- 17.2.9.1. Overview
- 17.2.9.2. Products
- 17.2.9.3. SWOT Analysis
- 17.2.9.4. Recent Developments
- 17.2.9.5. Financials (Based on Availability)
- 17.2.10 Dynatrace LLC
- 17.2.10.1. Overview
- 17.2.10.2. Products
- 17.2.10.3. SWOT Analysis
- 17.2.10.4. Recent Developments
- 17.2.10.5. Financials (Based on Availability)
- 17.2.1 SAILPOINT TECHNOLOGIES INC
List of Figures
- Figure 1: Global ServiceNow Store Apps Market Revenue Breakdown (Million, %) by Region 2024 & 2032
- Figure 2: North America ServiceNow Store Apps Market Revenue (Million), by Country 2024 & 2032
- Figure 3: North America ServiceNow Store Apps Market Revenue Share (%), by Country 2024 & 2032
- Figure 4: Europe ServiceNow Store Apps Market Revenue (Million), by Country 2024 & 2032
- Figure 5: Europe ServiceNow Store Apps Market Revenue Share (%), by Country 2024 & 2032
- Figure 6: Asia Pacific ServiceNow Store Apps Market Revenue (Million), by Country 2024 & 2032
- Figure 7: Asia Pacific ServiceNow Store Apps Market Revenue Share (%), by Country 2024 & 2032
- Figure 8: South America ServiceNow Store Apps Market Revenue (Million), by Country 2024 & 2032
- Figure 9: South America ServiceNow Store Apps Market Revenue Share (%), by Country 2024 & 2032
- Figure 10: North America ServiceNow Store Apps Market Revenue (Million), by Country 2024 & 2032
- Figure 11: North America ServiceNow Store Apps Market Revenue Share (%), by Country 2024 & 2032
- Figure 12: MEA ServiceNow Store Apps Market Revenue (Million), by Country 2024 & 2032
- Figure 13: MEA ServiceNow Store Apps Market Revenue Share (%), by Country 2024 & 2032
- Figure 14: North America ServiceNow Store Apps Market Revenue (Million), by Type 2024 & 2032
- Figure 15: North America ServiceNow Store Apps Market Revenue Share (%), by Type 2024 & 2032
- Figure 16: North America ServiceNow Store Apps Market Revenue (Million), by Enterprise Size 2024 & 2032
- Figure 17: North America ServiceNow Store Apps Market Revenue Share (%), by Enterprise Size 2024 & 2032
- Figure 18: North America ServiceNow Store Apps Market Revenue (Million), by Country 2024 & 2032
- Figure 19: North America ServiceNow Store Apps Market Revenue Share (%), by Country 2024 & 2032
- Figure 20: Europe ServiceNow Store Apps Market Revenue (Million), by Type 2024 & 2032
- Figure 21: Europe ServiceNow Store Apps Market Revenue Share (%), by Type 2024 & 2032
- Figure 22: Europe ServiceNow Store Apps Market Revenue (Million), by Enterprise Size 2024 & 2032
- Figure 23: Europe ServiceNow Store Apps Market Revenue Share (%), by Enterprise Size 2024 & 2032
- Figure 24: Europe ServiceNow Store Apps Market Revenue (Million), by Country 2024 & 2032
- Figure 25: Europe ServiceNow Store Apps Market Revenue Share (%), by Country 2024 & 2032
- Figure 26: Asia ServiceNow Store Apps Market Revenue (Million), by Type 2024 & 2032
- Figure 27: Asia ServiceNow Store Apps Market Revenue Share (%), by Type 2024 & 2032
- Figure 28: Asia ServiceNow Store Apps Market Revenue (Million), by Enterprise Size 2024 & 2032
- Figure 29: Asia ServiceNow Store Apps Market Revenue Share (%), by Enterprise Size 2024 & 2032
- Figure 30: Asia ServiceNow Store Apps Market Revenue (Million), by Country 2024 & 2032
- Figure 31: Asia ServiceNow Store Apps Market Revenue Share (%), by Country 2024 & 2032
- Figure 32: Latin America ServiceNow Store Apps Market Revenue (Million), by Type 2024 & 2032
- Figure 33: Latin America ServiceNow Store Apps Market Revenue Share (%), by Type 2024 & 2032
- Figure 34: Latin America ServiceNow Store Apps Market Revenue (Million), by Enterprise Size 2024 & 2032
- Figure 35: Latin America ServiceNow Store Apps Market Revenue Share (%), by Enterprise Size 2024 & 2032
- Figure 36: Latin America ServiceNow Store Apps Market Revenue (Million), by Country 2024 & 2032
- Figure 37: Latin America ServiceNow Store Apps Market Revenue Share (%), by Country 2024 & 2032
- Figure 38: Middle East and Africa ServiceNow Store Apps Market Revenue (Million), by Type 2024 & 2032
- Figure 39: Middle East and Africa ServiceNow Store Apps Market Revenue Share (%), by Type 2024 & 2032
- Figure 40: Middle East and Africa ServiceNow Store Apps Market Revenue (Million), by Enterprise Size 2024 & 2032
- Figure 41: Middle East and Africa ServiceNow Store Apps Market Revenue Share (%), by Enterprise Size 2024 & 2032
- Figure 42: Middle East and Africa ServiceNow Store Apps Market Revenue (Million), by Country 2024 & 2032
- Figure 43: Middle East and Africa ServiceNow Store Apps Market Revenue Share (%), by Country 2024 & 2032
List of Tables
- Table 1: Global ServiceNow Store Apps Market Revenue Million Forecast, by Region 2019 & 2032
- Table 2: Global ServiceNow Store Apps Market Revenue Million Forecast, by Type 2019 & 2032
- Table 3: Global ServiceNow Store Apps Market Revenue Million Forecast, by Enterprise Size 2019 & 2032
- Table 4: Global ServiceNow Store Apps Market Revenue Million Forecast, by Region 2019 & 2032
- Table 5: Global ServiceNow Store Apps Market Revenue Million Forecast, by Country 2019 & 2032
- Table 6: United States ServiceNow Store Apps Market Revenue (Million) Forecast, by Application 2019 & 2032
- Table 7: Canada ServiceNow Store Apps Market Revenue (Million) Forecast, by Application 2019 & 2032
- Table 8: Mexico ServiceNow Store Apps Market Revenue (Million) Forecast, by Application 2019 & 2032
- Table 9: Global ServiceNow Store Apps Market Revenue Million Forecast, by Country 2019 & 2032
- Table 10: Germany ServiceNow Store Apps Market Revenue (Million) Forecast, by Application 2019 & 2032
- Table 11: United Kingdom ServiceNow Store Apps Market Revenue (Million) Forecast, by Application 2019 & 2032
- Table 12: France ServiceNow Store Apps Market Revenue (Million) Forecast, by Application 2019 & 2032
- Table 13: Spain ServiceNow Store Apps Market Revenue (Million) Forecast, by Application 2019 & 2032
- Table 14: Italy ServiceNow Store Apps Market Revenue (Million) Forecast, by Application 2019 & 2032
- Table 15: Spain ServiceNow Store Apps Market Revenue (Million) Forecast, by Application 2019 & 2032
- Table 16: Belgium ServiceNow Store Apps Market Revenue (Million) Forecast, by Application 2019 & 2032
- Table 17: Netherland ServiceNow Store Apps Market Revenue (Million) Forecast, by Application 2019 & 2032
- Table 18: Nordics ServiceNow Store Apps Market Revenue (Million) Forecast, by Application 2019 & 2032
- Table 19: Rest of Europe ServiceNow Store Apps Market Revenue (Million) Forecast, by Application 2019 & 2032
- Table 20: Global ServiceNow Store Apps Market Revenue Million Forecast, by Country 2019 & 2032
- Table 21: China ServiceNow Store Apps Market Revenue (Million) Forecast, by Application 2019 & 2032
- Table 22: Japan ServiceNow Store Apps Market Revenue (Million) Forecast, by Application 2019 & 2032
- Table 23: India ServiceNow Store Apps Market Revenue (Million) Forecast, by Application 2019 & 2032
- Table 24: South Korea ServiceNow Store Apps Market Revenue (Million) Forecast, by Application 2019 & 2032
- Table 25: Southeast Asia ServiceNow Store Apps Market Revenue (Million) Forecast, by Application 2019 & 2032
- Table 26: Australia ServiceNow Store Apps Market Revenue (Million) Forecast, by Application 2019 & 2032
- Table 27: Indonesia ServiceNow Store Apps Market Revenue (Million) Forecast, by Application 2019 & 2032
- Table 28: Phillipes ServiceNow Store Apps Market Revenue (Million) Forecast, by Application 2019 & 2032
- Table 29: Singapore ServiceNow Store Apps Market Revenue (Million) Forecast, by Application 2019 & 2032
- Table 30: Thailandc ServiceNow Store Apps Market Revenue (Million) Forecast, by Application 2019 & 2032
- Table 31: Rest of Asia Pacific ServiceNow Store Apps Market Revenue (Million) Forecast, by Application 2019 & 2032
- Table 32: Global ServiceNow Store Apps Market Revenue Million Forecast, by Country 2019 & 2032
- Table 33: Brazil ServiceNow Store Apps Market Revenue (Million) Forecast, by Application 2019 & 2032
- Table 34: Argentina ServiceNow Store Apps Market Revenue (Million) Forecast, by Application 2019 & 2032
- Table 35: Peru ServiceNow Store Apps Market Revenue (Million) Forecast, by Application 2019 & 2032
- Table 36: Chile ServiceNow Store Apps Market Revenue (Million) Forecast, by Application 2019 & 2032
- Table 37: Colombia ServiceNow Store Apps Market Revenue (Million) Forecast, by Application 2019 & 2032
- Table 38: Ecuador ServiceNow Store Apps Market Revenue (Million) Forecast, by Application 2019 & 2032
- Table 39: Venezuela ServiceNow Store Apps Market Revenue (Million) Forecast, by Application 2019 & 2032
- Table 40: Rest of South America ServiceNow Store Apps Market Revenue (Million) Forecast, by Application 2019 & 2032
- Table 41: Global ServiceNow Store Apps Market Revenue Million Forecast, by Country 2019 & 2032
- Table 42: United States ServiceNow Store Apps Market Revenue (Million) Forecast, by Application 2019 & 2032
- Table 43: Canada ServiceNow Store Apps Market Revenue (Million) Forecast, by Application 2019 & 2032
- Table 44: Mexico ServiceNow Store Apps Market Revenue (Million) Forecast, by Application 2019 & 2032
- Table 45: Global ServiceNow Store Apps Market Revenue Million Forecast, by Country 2019 & 2032
- Table 46: United Arab Emirates ServiceNow Store Apps Market Revenue (Million) Forecast, by Application 2019 & 2032
- Table 47: Saudi Arabia ServiceNow Store Apps Market Revenue (Million) Forecast, by Application 2019 & 2032
- Table 48: South Africa ServiceNow Store Apps Market Revenue (Million) Forecast, by Application 2019 & 2032
- Table 49: Rest of Middle East and Africa ServiceNow Store Apps Market Revenue (Million) Forecast, by Application 2019 & 2032
- Table 50: Global ServiceNow Store Apps Market Revenue Million Forecast, by Type 2019 & 2032
- Table 51: Global ServiceNow Store Apps Market Revenue Million Forecast, by Enterprise Size 2019 & 2032
- Table 52: Global ServiceNow Store Apps Market Revenue Million Forecast, by Country 2019 & 2032
- Table 53: Global ServiceNow Store Apps Market Revenue Million Forecast, by Type 2019 & 2032
- Table 54: Global ServiceNow Store Apps Market Revenue Million Forecast, by Enterprise Size 2019 & 2032
- Table 55: Global ServiceNow Store Apps Market Revenue Million Forecast, by Country 2019 & 2032
- Table 56: Global ServiceNow Store Apps Market Revenue Million Forecast, by Type 2019 & 2032
- Table 57: Global ServiceNow Store Apps Market Revenue Million Forecast, by Enterprise Size 2019 & 2032
- Table 58: Global ServiceNow Store Apps Market Revenue Million Forecast, by Country 2019 & 2032
- Table 59: Global ServiceNow Store Apps Market Revenue Million Forecast, by Type 2019 & 2032
- Table 60: Global ServiceNow Store Apps Market Revenue Million Forecast, by Enterprise Size 2019 & 2032
- Table 61: Global ServiceNow Store Apps Market Revenue Million Forecast, by Country 2019 & 2032
- Table 62: Global ServiceNow Store Apps Market Revenue Million Forecast, by Type 2019 & 2032
- Table 63: Global ServiceNow Store Apps Market Revenue Million Forecast, by Enterprise Size 2019 & 2032
- Table 64: Global ServiceNow Store Apps Market Revenue Million Forecast, by Country 2019 & 2032
Frequently Asked Questions
1. What is the projected Compound Annual Growth Rate (CAGR) of the ServiceNow Store Apps Market?
The projected CAGR is approximately 32.73%.
2. Which companies are prominent players in the ServiceNow Store Apps Market?
Key companies in the market include SAILPOINT TECHNOLOGIES INC, IBM Corporation, teamviewer, PagerDuty, Microsoft Corporation*List Not Exhaustive, xMatters Inc, Cisco Systems Inc, Okta Inc, Talkdesk Inc, Dynatrace LLC.
3. What are the main segments of the ServiceNow Store Apps Market?
The market segments include Type, Enterprise Size.
4. Can you provide details about the market size?
The market size is estimated to be USD XX Million as of 2022.
5. What are some drivers contributing to market growth?
Rise in adoption of cloud services and cloud computing; Rise in digital platforms and adoption of advance technologies.
6. What are the notable trends driving market growth?
Cloud-Based is Expected to Hold Significant Share of the Market.
7. Are there any restraints impacting market growth?
High upfront and licensing costs.
8. Can you provide examples of recent developments in the market?
May 2023: xtype, the renowned agile software delivery company, announced the launch of xtype View, an innovative multi-instance viewer and platform engineering dashboard exclusively designed for ServiceNow professionals. As the inaugural real-time, multi-instance dashboard tailored specifically for ServiceNow experts, xtype View offers a comprehensive solution to effortlessly monitor all plugins and applications within their ServiceNow ecosystem from a single unified interface. xtype View is available free of charge and is poised to significantly mitigate the challenges associated with configuration discrepancies, ultimately enhancing the ServiceNow experience.
9. What pricing options are available for accessing the report?
Pricing options include single-user, multi-user, and enterprise licenses priced at USD 4750, USD 5250, and USD 8750 respectively.
10. Is the market size provided in terms of value or volume?
The market size is provided in terms of value, measured in Million.
11. Are there any specific market keywords associated with the report?
Yes, the market keyword associated with the report is "ServiceNow Store Apps Market," which aids in identifying and referencing the specific market segment covered.
12. How do I determine which pricing option suits my needs best?
The pricing options vary based on user requirements and access needs. Individual users may opt for single-user licenses, while businesses requiring broader access may choose multi-user or enterprise licenses for cost-effective access to the report.
13. Are there any additional resources or data provided in the ServiceNow Store Apps Market report?
While the report offers comprehensive insights, it's advisable to review the specific contents or supplementary materials provided to ascertain if additional resources or data are available.
14. How can I stay updated on further developments or reports in the ServiceNow Store Apps Market?
To stay informed about further developments, trends, and reports in the ServiceNow Store Apps Market, consider subscribing to industry newsletters, following relevant companies and organizations, or regularly checking reputable industry news sources and publications.
Methodology
Step 1 - Identification of Relevant Samples Size from Population Database


Step 2 - Approaches for Defining Global Market Size (Value, Volume* & Price*)

Note*: In applicable scenarios
Step 3 - Data Sources
Primary Research
- Web Analytics
- Survey Reports
- Research Institute
- Latest Research Reports
- Opinion Leaders
Secondary Research
- Annual Reports
- White Paper
- Latest Press Release
- Industry Association
- Paid Database
- Investor Presentations

Step 4 - Data Triangulation
Involves using different sources of information in order to increase the validity of a study
These sources are likely to be stakeholders in a program - participants, other researchers, program staff, other community members, and so on.
Then we put all data in single framework & apply various statistical tools to find out the dynamic on the market.
During the analysis stage, feedback from the stakeholder groups would be compared to determine areas of agreement as well as areas of divergence
