

Key Insights
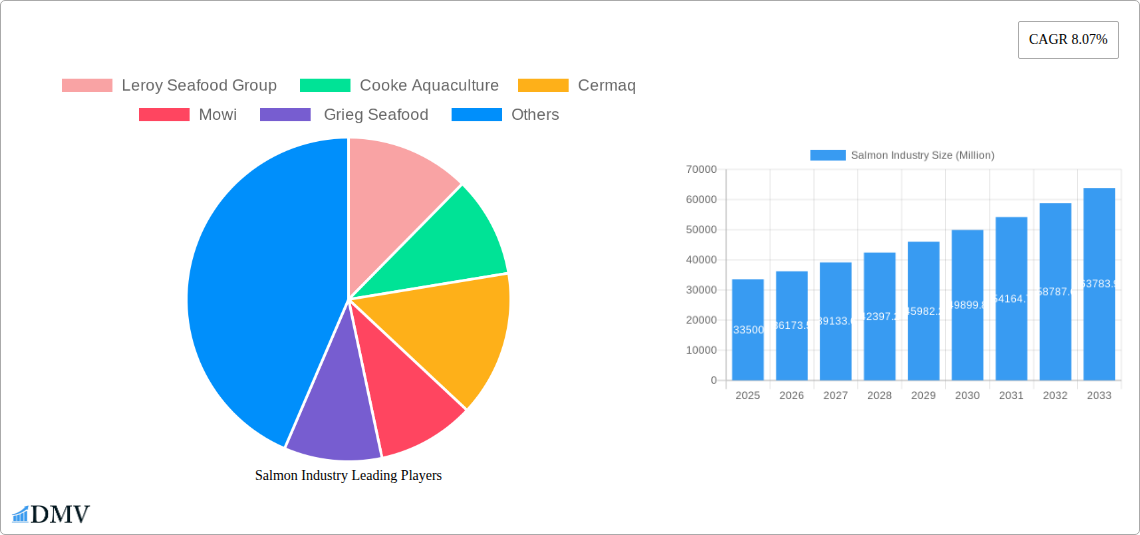
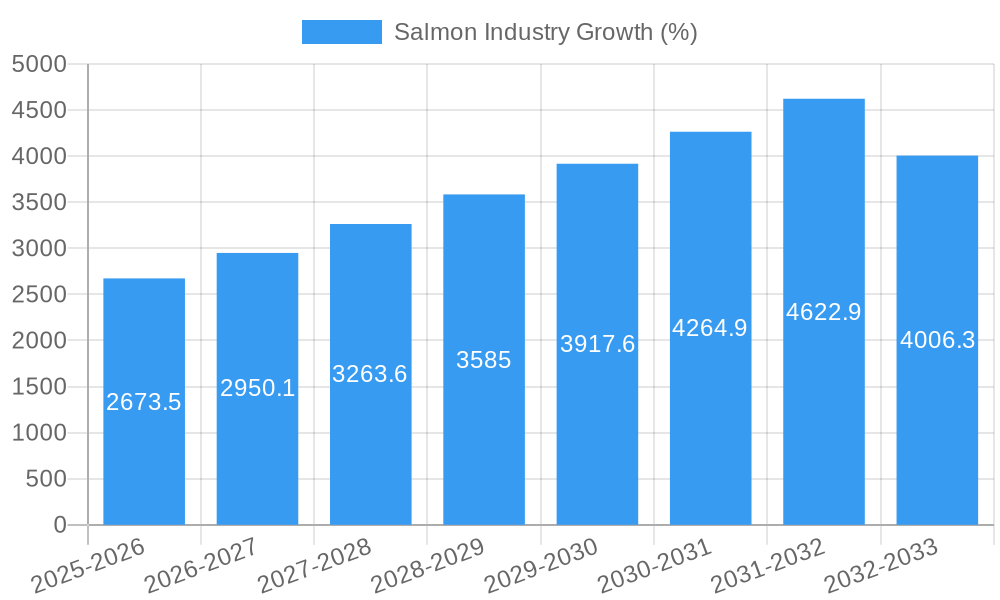
The global salmon market, valued at $33.5 billion in 2025, is projected to experience robust growth, driven by increasing consumer demand for healthy protein sources and the rising popularity of sushi and other salmon-based dishes. The market's Compound Annual Growth Rate (CAGR) of 8.07% from 2025 to 2033 signifies substantial expansion, fueled by several key factors. Growing aquaculture production, particularly in regions like Norway and Chile, significantly contributes to the market's growth. Furthermore, advancements in aquaculture technology, such as selective breeding and improved feed formulations, are enhancing salmon production efficiency and quality. The market is segmented by farming type (farmed and wild-captured) and species type (Atlantic Salmon, Coho Salmon, Masu Salmon, Chinook Salmon, and Others). Farmed salmon currently dominates the market, reflecting the industry's ability to meet increasing global demand. However, consumer preference for wild-caught salmon, while representing a smaller segment, remains strong, driven by perceived higher quality and sustainability concerns. Major players like Leroy Seafood Group, Cooke Aquaculture, Cermaq, Mowi, and Grieg Seafood are shaping market dynamics through strategic investments in sustainable aquaculture practices and global distribution networks. Regional variations exist, with North America and Europe representing significant markets, followed by the Asia-Pacific region showcasing strong growth potential. Challenges include disease outbreaks in aquaculture farms and fluctuating global prices, but ongoing research and improved farming practices mitigate these risks.
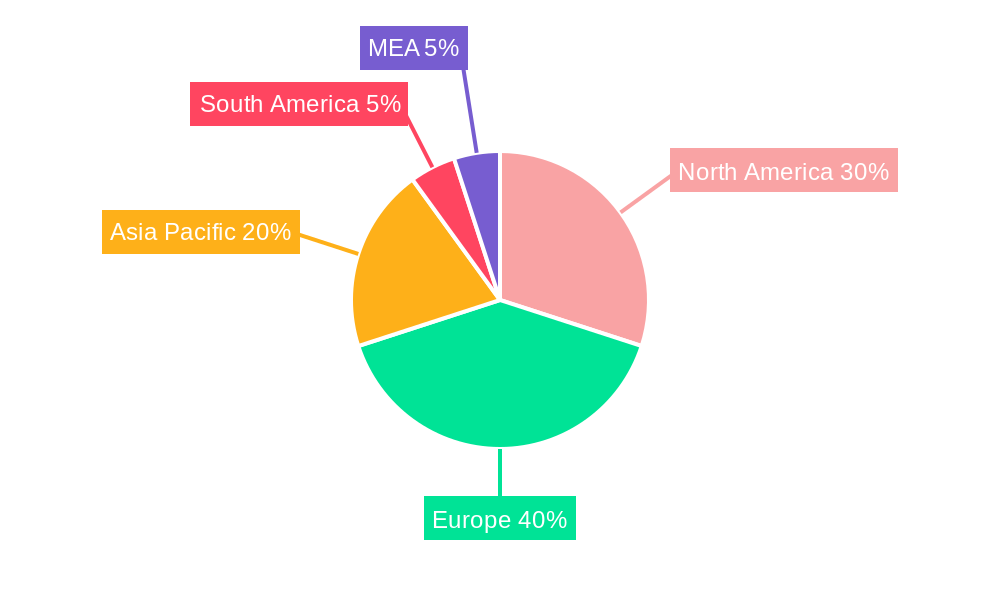
The forecast period (2025-2033) suggests continued market expansion, with North America and Europe expected to remain key markets, albeit at varying growth rates. Asia-Pacific, particularly China and Japan, offers substantial untapped potential due to increasing disposable incomes and growing awareness of the health benefits of salmon consumption. The market's success hinges on maintaining sustainable aquaculture practices, addressing consumer concerns about environmental impact, and adapting to shifts in consumer preferences. Innovative product development, such as value-added salmon products and convenient ready-to-eat options, will play a crucial role in driving future growth and market expansion. The increasing demand for traceability and transparency in the salmon supply chain also presents an opportunity for businesses to build consumer trust and loyalty.
Salmon Industry Market Report: 2019-2033 Forecast
This comprehensive report provides a detailed analysis of the global salmon industry, encompassing market size, trends, leading players, and future growth prospects from 2019 to 2033. With a base year of 2025 and a forecast period spanning 2025-2033, this report is an indispensable resource for stakeholders seeking to understand this dynamic market. The report leverages extensive data analysis to offer actionable insights into the production and consumption of Atlantic Salmon, Coho Salmon, Masu Salmon, Chinook Salmon, and other species, segmented by farmed and wild-captured sources. The total market value is projected to reach xx Million by 2033.
Salmon Industry Market Composition & Trends
The global salmon industry, valued at xx Million in 2024, exhibits a moderately concentrated market structure. Key players like Mowi, Leroy Seafood Group, Cooke Aquaculture, Cermaq, and Grieg Seafood hold significant market share, with Mowi estimated to control approximately xx% in 2025. Innovation is driven by advancements in aquaculture technologies, focused on increasing yields and improving salmon quality and sustainability. Stringent regulatory frameworks, varying by region, impact production costs and sustainability practices. Substitute protein sources, such as other fish and plant-based alternatives, exert competitive pressure. End-users primarily include food retailers, food service providers, and processors. Mergers and acquisitions (M&A) activity has been substantial, with deal values exceeding xx Million in the past five years, shaping market consolidation.
- Market Share Distribution (2025): Mowi (xx%), Leroy Seafood Group (xx%), Cooke Aquaculture (xx%), Cermaq (xx%), Grieg Seafood (xx%), Others (xx%).
- M&A Activity (2019-2024): Total deal value exceeding xx Million. Key drivers include economies of scale, geographical expansion, and access to technology.
Salmon Industry Industry Evolution
The salmon industry has witnessed significant growth over the historical period (2019-2024), driven by increasing global demand for seafood and technological advancements in aquaculture. Farmed salmon accounts for a larger share of the market compared to wild-caught salmon. The industry has experienced a Compound Annual Growth Rate (CAGR) of xx% during 2019-2024. Technological advancements, such as improved farming techniques (RAS, Recirculating Aquaculture Systems), selective breeding programs, and disease prevention strategies, have boosted production efficiency and sustainability. Changing consumer preferences, with an increased focus on health, sustainability, and traceability, are also influencing market trends. The forecast period (2025-2033) is projected to see a CAGR of xx%, driven by factors like growing middle classes in developing economies and rising demand for high-quality protein. Adoption of sustainable aquaculture practices is also expected to accelerate.
Leading Regions, Countries, or Segments in Salmon Industry
Norway and Chile remain the dominant producers of farmed salmon globally, accounting for a combined xx% of global production in 2025. Atlantic salmon represents the largest species segment, contributing xx% to overall volume.
- Key Drivers for Norway's Dominance: Established aquaculture infrastructure, technological advancements, supportive government policies, and access to suitable water conditions.
- Key Drivers for Chile's Dominance: Favorable climatic conditions, existing aquaculture infrastructure, and access to global markets.
- Atlantic Salmon Dominance: High consumer demand, established farming practices, and established supply chains.
- Farmed Salmon's Market Share: Farmed salmon constitutes xx% of the total market volume in 2025 due to its greater scalability and cost-effectiveness.
Salmon Industry Product Innovations
Recent innovations include the development of more sustainable and efficient aquaculture practices, focusing on reducing environmental impact and improving fish welfare. New processing techniques enhance product quality and shelf life. Value-added products, such as pre-packaged meals and ready-to-eat options, cater to the growing convenience food segment. Traceability technologies, using blockchain and RFID tracking, enhance transparency and build consumer trust.
Propelling Factors for Salmon Industry Growth
Key growth drivers include increasing global population and rising per capita consumption of seafood. Economic growth in emerging markets boosts demand for higher-value protein sources. Supportive government policies, promoting sustainable aquaculture practices, further stimulate market expansion.
Obstacles in the Salmon Industry Market
Challenges include price volatility due to fluctuating supply and demand. Disease outbreaks in farmed salmon populations can disrupt production and lead to significant economic losses. Environmental concerns regarding the impact of aquaculture on marine ecosystems impose regulatory pressures and consumer scrutiny. Intense competition among producers necessitates efficient operations and cost-management strategies.
Future Opportunities in Salmon Industry
Emerging opportunities lie in expanding into new markets, particularly in Asia and Africa, where seafood consumption is growing. Developing innovative products with enhanced nutritional profiles and functional benefits can attract health-conscious consumers. Technological advancements in aquaculture, such as precision feeding and automation, contribute to increased efficiency and profitability.
Major Players in the Salmon Industry Ecosystem
Key Developments in Salmon Industry Industry
- 2022 Q4: Mowi announced a significant investment in RAS technology to enhance sustainability.
- 2023 Q1: Cooke Aquaculture launched a new line of sustainably sourced salmon products.
- 2023 Q3: A major merger between two smaller salmon farming companies resulted in a significant shift in market share.
Strategic Salmon Industry Market Forecast
The global salmon industry is poised for continued growth, driven by increasing demand and the adoption of sustainable aquaculture practices. Innovation and technological advancements will play a crucial role in shaping the future of the industry, optimizing production efficiency, and meeting evolving consumer preferences. The forecast period is expected to witness substantial expansion, with the market value reaching xx Million by 2033, fueled by emerging markets and a rising global appetite for high-quality seafood.
Salmon Industry Segmentation
-
1. Species Type
- 1.1. Atlantic Salmon
- 1.2. Coho Salmon
- 1.3. Masu Salmon
- 1.4. Chinook Salmon
- 1.5. Other Species Types
-
2. Type
- 2.1. Farmed
- 2.2. Wild Captured
-
3. Species Type
- 3.1. Atlantic Salmon
- 3.2. Coho Salmon
- 3.3. Masu Salmon
- 3.4. Chinook Salmon
- 3.5. Other Species Types
-
4. Type
- 4.1. Farmed
- 4.2. Wild Captured
Salmon Industry Segmentation By Geography
-
1. North America
- 1.1. United States
- 1.2. Canada
-
2. Europe
- 2.1. Norway
- 2.2. Spain
- 2.3. Netherlands
- 2.4. France
- 2.5. Italy
- 2.6. Greece
- 2.7. United Kingdom
- 2.8. Scotland
-
3. Asia Pacific
- 3.1. China
- 3.2. Japan
- 3.3. Australia
-
4. South America
- 4.1. Chile
Salmon Industry REPORT HIGHLIGHTS
| Aspects | Details |
|---|---|
| Study Period | 2019-2033 |
| Base Year | 2024 |
| Estimated Year | 2025 |
| Forecast Period | 2025-2033 |
| Historical Period | 2019-2024 |
| Growth Rate | CAGR of 8.07% from 2019-2033 |
| Segmentation |
|
Table of Contents
- 1. Introduction
- 1.1. Research Scope
- 1.2. Market Segmentation
- 1.3. Research Methodology
- 1.4. Definitions and Assumptions
- 2. Executive Summary
- 2.1. Introduction
- 3. Market Dynamics
- 3.1. Introduction
- 3.2. Market Drivers
- 3.2.1. ; Awareness About Health Benefits Associated With Pecan Consumption; Wide Application of Pecan
- 3.3. Market Restrains
- 3.3.1. ; Volatility in the Prices; Adverse Weather Conditions Affecting Yield
- 3.4. Market Trends
- 3.4.1. Healthy Boost in the Salmon Production
- 4. Market Factor Analysis
- 4.1. Porters Five Forces
- 4.2. Supply/Value Chain
- 4.3. PESTEL analysis
- 4.4. Market Entropy
- 4.5. Patent/Trademark Analysis
- 5. Global Salmon Industry Analysis, Insights and Forecast, 2019-2031
- 5.1. Market Analysis, Insights and Forecast - by Species Type
- 5.1.1. Atlantic Salmon
- 5.1.2. Coho Salmon
- 5.1.3. Masu Salmon
- 5.1.4. Chinook Salmon
- 5.1.5. Other Species Types
- 5.2. Market Analysis, Insights and Forecast - by Type
- 5.2.1. Farmed
- 5.2.2. Wild Captured
- 5.3. Market Analysis, Insights and Forecast - by Species Type
- 5.3.1. Atlantic Salmon
- 5.3.2. Coho Salmon
- 5.3.3. Masu Salmon
- 5.3.4. Chinook Salmon
- 5.3.5. Other Species Types
- 5.4. Market Analysis, Insights and Forecast - by Type
- 5.4.1. Farmed
- 5.4.2. Wild Captured
- 5.5. Market Analysis, Insights and Forecast - by Region
- 5.5.1. North America
- 5.5.2. Europe
- 5.5.3. Asia Pacific
- 5.5.4. South America
- 5.1. Market Analysis, Insights and Forecast - by Species Type
- 6. North America Salmon Industry Analysis, Insights and Forecast, 2019-2031
- 6.1. Market Analysis, Insights and Forecast - by Species Type
- 6.1.1. Atlantic Salmon
- 6.1.2. Coho Salmon
- 6.1.3. Masu Salmon
- 6.1.4. Chinook Salmon
- 6.1.5. Other Species Types
- 6.2. Market Analysis, Insights and Forecast - by Type
- 6.2.1. Farmed
- 6.2.2. Wild Captured
- 6.3. Market Analysis, Insights and Forecast - by Species Type
- 6.3.1. Atlantic Salmon
- 6.3.2. Coho Salmon
- 6.3.3. Masu Salmon
- 6.3.4. Chinook Salmon
- 6.3.5. Other Species Types
- 6.4. Market Analysis, Insights and Forecast - by Type
- 6.4.1. Farmed
- 6.4.2. Wild Captured
- 6.1. Market Analysis, Insights and Forecast - by Species Type
- 7. Europe Salmon Industry Analysis, Insights and Forecast, 2019-2031
- 7.1. Market Analysis, Insights and Forecast - by Species Type
- 7.1.1. Atlantic Salmon
- 7.1.2. Coho Salmon
- 7.1.3. Masu Salmon
- 7.1.4. Chinook Salmon
- 7.1.5. Other Species Types
- 7.2. Market Analysis, Insights and Forecast - by Type
- 7.2.1. Farmed
- 7.2.2. Wild Captured
- 7.3. Market Analysis, Insights and Forecast - by Species Type
- 7.3.1. Atlantic Salmon
- 7.3.2. Coho Salmon
- 7.3.3. Masu Salmon
- 7.3.4. Chinook Salmon
- 7.3.5. Other Species Types
- 7.4. Market Analysis, Insights and Forecast - by Type
- 7.4.1. Farmed
- 7.4.2. Wild Captured
- 7.1. Market Analysis, Insights and Forecast - by Species Type
- 8. Asia Pacific Salmon Industry Analysis, Insights and Forecast, 2019-2031
- 8.1. Market Analysis, Insights and Forecast - by Species Type
- 8.1.1. Atlantic Salmon
- 8.1.2. Coho Salmon
- 8.1.3. Masu Salmon
- 8.1.4. Chinook Salmon
- 8.1.5. Other Species Types
- 8.2. Market Analysis, Insights and Forecast - by Type
- 8.2.1. Farmed
- 8.2.2. Wild Captured
- 8.3. Market Analysis, Insights and Forecast - by Species Type
- 8.3.1. Atlantic Salmon
- 8.3.2. Coho Salmon
- 8.3.3. Masu Salmon
- 8.3.4. Chinook Salmon
- 8.3.5. Other Species Types
- 8.4. Market Analysis, Insights and Forecast - by Type
- 8.4.1. Farmed
- 8.4.2. Wild Captured
- 8.1. Market Analysis, Insights and Forecast - by Species Type
- 9. South America Salmon Industry Analysis, Insights and Forecast, 2019-2031
- 9.1. Market Analysis, Insights and Forecast - by Species Type
- 9.1.1. Atlantic Salmon
- 9.1.2. Coho Salmon
- 9.1.3. Masu Salmon
- 9.1.4. Chinook Salmon
- 9.1.5. Other Species Types
- 9.2. Market Analysis, Insights and Forecast - by Type
- 9.2.1. Farmed
- 9.2.2. Wild Captured
- 9.3. Market Analysis, Insights and Forecast - by Species Type
- 9.3.1. Atlantic Salmon
- 9.3.2. Coho Salmon
- 9.3.3. Masu Salmon
- 9.3.4. Chinook Salmon
- 9.3.5. Other Species Types
- 9.4. Market Analysis, Insights and Forecast - by Type
- 9.4.1. Farmed
- 9.4.2. Wild Captured
- 9.1. Market Analysis, Insights and Forecast - by Species Type
- 10. North America Salmon Industry Analysis, Insights and Forecast, 2019-2031
- 10.1. Market Analysis, Insights and Forecast - By Country/Sub-region
- 10.1.1 United States
- 10.1.2 Canada
- 11. Europe Salmon Industry Analysis, Insights and Forecast, 2019-2031
- 11.1. Market Analysis, Insights and Forecast - By Country/Sub-region
- 11.1.1 Norway
- 11.1.2 Spain
- 11.1.3 Netherlands
- 11.1.4 France
- 11.1.5 Italy
- 11.1.6 Greece
- 11.1.7 United Kingdom
- 11.1.8 Scotland
- 12. Asia Pacific Salmon Industry Analysis, Insights and Forecast, 2019-2031
- 12.1. Market Analysis, Insights and Forecast - By Country/Sub-region
- 12.1.1 China
- 12.1.2 Japan
- 12.1.3 Australia
- 13. South America Salmon Industry Analysis, Insights and Forecast, 2019-2031
- 13.1. Market Analysis, Insights and Forecast - By Country/Sub-region
- 13.1.1. Chile
- 14. MEA Salmon Industry Analysis, Insights and Forecast, 2019-2031
- 14.1. Market Analysis, Insights and Forecast - By Country/Sub-region
- 14.1.1 Middle East
- 14.1.2 Africa
- 15. Competitive Analysis
- 15.1. Global Market Share Analysis 2024
- 15.2. Company Profiles
- 15.2.1 Leroy Seafood Group
- 15.2.1.1. Overview
- 15.2.1.2. Products
- 15.2.1.3. SWOT Analysis
- 15.2.1.4. Recent Developments
- 15.2.1.5. Financials (Based on Availability)
- 15.2.2 Cooke Aquaculture
- 15.2.2.1. Overview
- 15.2.2.2. Products
- 15.2.2.3. SWOT Analysis
- 15.2.2.4. Recent Developments
- 15.2.2.5. Financials (Based on Availability)
- 15.2.3 Cermaq
- 15.2.3.1. Overview
- 15.2.3.2. Products
- 15.2.3.3. SWOT Analysis
- 15.2.3.4. Recent Developments
- 15.2.3.5. Financials (Based on Availability)
- 15.2.4 Mowi
- 15.2.4.1. Overview
- 15.2.4.2. Products
- 15.2.4.3. SWOT Analysis
- 15.2.4.4. Recent Developments
- 15.2.4.5. Financials (Based on Availability)
- 15.2.5 Grieg Seafood
- 15.2.5.1. Overview
- 15.2.5.2. Products
- 15.2.5.3. SWOT Analysis
- 15.2.5.4. Recent Developments
- 15.2.5.5. Financials (Based on Availability)
- 15.2.1 Leroy Seafood Group
List of Figures
- Figure 1: Global Salmon Industry Revenue Breakdown (Million, %) by Region 2024 & 2032
- Figure 2: North America Salmon Industry Revenue (Million), by Country 2024 & 2032
- Figure 3: North America Salmon Industry Revenue Share (%), by Country 2024 & 2032
- Figure 4: Europe Salmon Industry Revenue (Million), by Country 2024 & 2032
- Figure 5: Europe Salmon Industry Revenue Share (%), by Country 2024 & 2032
- Figure 6: Asia Pacific Salmon Industry Revenue (Million), by Country 2024 & 2032
- Figure 7: Asia Pacific Salmon Industry Revenue Share (%), by Country 2024 & 2032
- Figure 8: South America Salmon Industry Revenue (Million), by Country 2024 & 2032
- Figure 9: South America Salmon Industry Revenue Share (%), by Country 2024 & 2032
- Figure 10: MEA Salmon Industry Revenue (Million), by Country 2024 & 2032
- Figure 11: MEA Salmon Industry Revenue Share (%), by Country 2024 & 2032
- Figure 12: North America Salmon Industry Revenue (Million), by Species Type 2024 & 2032
- Figure 13: North America Salmon Industry Revenue Share (%), by Species Type 2024 & 2032
- Figure 14: North America Salmon Industry Revenue (Million), by Type 2024 & 2032
- Figure 15: North America Salmon Industry Revenue Share (%), by Type 2024 & 2032
- Figure 16: North America Salmon Industry Revenue (Million), by Species Type 2024 & 2032
- Figure 17: North America Salmon Industry Revenue Share (%), by Species Type 2024 & 2032
- Figure 18: North America Salmon Industry Revenue (Million), by Type 2024 & 2032
- Figure 19: North America Salmon Industry Revenue Share (%), by Type 2024 & 2032
- Figure 20: North America Salmon Industry Revenue (Million), by Country 2024 & 2032
- Figure 21: North America Salmon Industry Revenue Share (%), by Country 2024 & 2032
- Figure 22: Europe Salmon Industry Revenue (Million), by Species Type 2024 & 2032
- Figure 23: Europe Salmon Industry Revenue Share (%), by Species Type 2024 & 2032
- Figure 24: Europe Salmon Industry Revenue (Million), by Type 2024 & 2032
- Figure 25: Europe Salmon Industry Revenue Share (%), by Type 2024 & 2032
- Figure 26: Europe Salmon Industry Revenue (Million), by Species Type 2024 & 2032
- Figure 27: Europe Salmon Industry Revenue Share (%), by Species Type 2024 & 2032
- Figure 28: Europe Salmon Industry Revenue (Million), by Type 2024 & 2032
- Figure 29: Europe Salmon Industry Revenue Share (%), by Type 2024 & 2032
- Figure 30: Europe Salmon Industry Revenue (Million), by Country 2024 & 2032
- Figure 31: Europe Salmon Industry Revenue Share (%), by Country 2024 & 2032
- Figure 32: Asia Pacific Salmon Industry Revenue (Million), by Species Type 2024 & 2032
- Figure 33: Asia Pacific Salmon Industry Revenue Share (%), by Species Type 2024 & 2032
- Figure 34: Asia Pacific Salmon Industry Revenue (Million), by Type 2024 & 2032
- Figure 35: Asia Pacific Salmon Industry Revenue Share (%), by Type 2024 & 2032
- Figure 36: Asia Pacific Salmon Industry Revenue (Million), by Species Type 2024 & 2032
- Figure 37: Asia Pacific Salmon Industry Revenue Share (%), by Species Type 2024 & 2032
- Figure 38: Asia Pacific Salmon Industry Revenue (Million), by Type 2024 & 2032
- Figure 39: Asia Pacific Salmon Industry Revenue Share (%), by Type 2024 & 2032
- Figure 40: Asia Pacific Salmon Industry Revenue (Million), by Country 2024 & 2032
- Figure 41: Asia Pacific Salmon Industry Revenue Share (%), by Country 2024 & 2032
- Figure 42: South America Salmon Industry Revenue (Million), by Species Type 2024 & 2032
- Figure 43: South America Salmon Industry Revenue Share (%), by Species Type 2024 & 2032
- Figure 44: South America Salmon Industry Revenue (Million), by Type 2024 & 2032
- Figure 45: South America Salmon Industry Revenue Share (%), by Type 2024 & 2032
- Figure 46: South America Salmon Industry Revenue (Million), by Species Type 2024 & 2032
- Figure 47: South America Salmon Industry Revenue Share (%), by Species Type 2024 & 2032
- Figure 48: South America Salmon Industry Revenue (Million), by Type 2024 & 2032
- Figure 49: South America Salmon Industry Revenue Share (%), by Type 2024 & 2032
- Figure 50: South America Salmon Industry Revenue (Million), by Country 2024 & 2032
- Figure 51: South America Salmon Industry Revenue Share (%), by Country 2024 & 2032
List of Tables
- Table 1: Global Salmon Industry Revenue Million Forecast, by Region 2019 & 2032
- Table 2: Global Salmon Industry Revenue Million Forecast, by Species Type 2019 & 2032
- Table 3: Global Salmon Industry Revenue Million Forecast, by Type 2019 & 2032
- Table 4: Global Salmon Industry Revenue Million Forecast, by Species Type 2019 & 2032
- Table 5: Global Salmon Industry Revenue Million Forecast, by Type 2019 & 2032
- Table 6: Global Salmon Industry Revenue Million Forecast, by Region 2019 & 2032
- Table 7: Global Salmon Industry Revenue Million Forecast, by Country 2019 & 2032
- Table 8: United States Salmon Industry Revenue (Million) Forecast, by Application 2019 & 2032
- Table 9: Canada Salmon Industry Revenue (Million) Forecast, by Application 2019 & 2032
- Table 10: Global Salmon Industry Revenue Million Forecast, by Country 2019 & 2032
- Table 11: Norway Salmon Industry Revenue (Million) Forecast, by Application 2019 & 2032
- Table 12: Spain Salmon Industry Revenue (Million) Forecast, by Application 2019 & 2032
- Table 13: Netherlands Salmon Industry Revenue (Million) Forecast, by Application 2019 & 2032
- Table 14: France Salmon Industry Revenue (Million) Forecast, by Application 2019 & 2032
- Table 15: Italy Salmon Industry Revenue (Million) Forecast, by Application 2019 & 2032
- Table 16: Greece Salmon Industry Revenue (Million) Forecast, by Application 2019 & 2032
- Table 17: United Kingdom Salmon Industry Revenue (Million) Forecast, by Application 2019 & 2032
- Table 18: Scotland Salmon Industry Revenue (Million) Forecast, by Application 2019 & 2032
- Table 19: Global Salmon Industry Revenue Million Forecast, by Country 2019 & 2032
- Table 20: China Salmon Industry Revenue (Million) Forecast, by Application 2019 & 2032
- Table 21: Japan Salmon Industry Revenue (Million) Forecast, by Application 2019 & 2032
- Table 22: Australia Salmon Industry Revenue (Million) Forecast, by Application 2019 & 2032
- Table 23: Global Salmon Industry Revenue Million Forecast, by Country 2019 & 2032
- Table 24: Chile Salmon Industry Revenue (Million) Forecast, by Application 2019 & 2032
- Table 25: Global Salmon Industry Revenue Million Forecast, by Country 2019 & 2032
- Table 26: Middle East Salmon Industry Revenue (Million) Forecast, by Application 2019 & 2032
- Table 27: Africa Salmon Industry Revenue (Million) Forecast, by Application 2019 & 2032
- Table 28: Global Salmon Industry Revenue Million Forecast, by Species Type 2019 & 2032
- Table 29: Global Salmon Industry Revenue Million Forecast, by Type 2019 & 2032
- Table 30: Global Salmon Industry Revenue Million Forecast, by Species Type 2019 & 2032
- Table 31: Global Salmon Industry Revenue Million Forecast, by Type 2019 & 2032
- Table 32: Global Salmon Industry Revenue Million Forecast, by Country 2019 & 2032
- Table 33: United States Salmon Industry Revenue (Million) Forecast, by Application 2019 & 2032
- Table 34: Canada Salmon Industry Revenue (Million) Forecast, by Application 2019 & 2032
- Table 35: Global Salmon Industry Revenue Million Forecast, by Species Type 2019 & 2032
- Table 36: Global Salmon Industry Revenue Million Forecast, by Type 2019 & 2032
- Table 37: Global Salmon Industry Revenue Million Forecast, by Species Type 2019 & 2032
- Table 38: Global Salmon Industry Revenue Million Forecast, by Type 2019 & 2032
- Table 39: Global Salmon Industry Revenue Million Forecast, by Country 2019 & 2032
- Table 40: Norway Salmon Industry Revenue (Million) Forecast, by Application 2019 & 2032
- Table 41: Spain Salmon Industry Revenue (Million) Forecast, by Application 2019 & 2032
- Table 42: Netherlands Salmon Industry Revenue (Million) Forecast, by Application 2019 & 2032
- Table 43: France Salmon Industry Revenue (Million) Forecast, by Application 2019 & 2032
- Table 44: Italy Salmon Industry Revenue (Million) Forecast, by Application 2019 & 2032
- Table 45: Greece Salmon Industry Revenue (Million) Forecast, by Application 2019 & 2032
- Table 46: United Kingdom Salmon Industry Revenue (Million) Forecast, by Application 2019 & 2032
- Table 47: Scotland Salmon Industry Revenue (Million) Forecast, by Application 2019 & 2032
- Table 48: Global Salmon Industry Revenue Million Forecast, by Species Type 2019 & 2032
- Table 49: Global Salmon Industry Revenue Million Forecast, by Type 2019 & 2032
- Table 50: Global Salmon Industry Revenue Million Forecast, by Species Type 2019 & 2032
- Table 51: Global Salmon Industry Revenue Million Forecast, by Type 2019 & 2032
- Table 52: Global Salmon Industry Revenue Million Forecast, by Country 2019 & 2032
- Table 53: China Salmon Industry Revenue (Million) Forecast, by Application 2019 & 2032
- Table 54: Japan Salmon Industry Revenue (Million) Forecast, by Application 2019 & 2032
- Table 55: Australia Salmon Industry Revenue (Million) Forecast, by Application 2019 & 2032
- Table 56: Global Salmon Industry Revenue Million Forecast, by Species Type 2019 & 2032
- Table 57: Global Salmon Industry Revenue Million Forecast, by Type 2019 & 2032
- Table 58: Global Salmon Industry Revenue Million Forecast, by Species Type 2019 & 2032
- Table 59: Global Salmon Industry Revenue Million Forecast, by Type 2019 & 2032
- Table 60: Global Salmon Industry Revenue Million Forecast, by Country 2019 & 2032
- Table 61: Chile Salmon Industry Revenue (Million) Forecast, by Application 2019 & 2032
Frequently Asked Questions
1. What is the projected Compound Annual Growth Rate (CAGR) of the Salmon Industry?
The projected CAGR is approximately 8.07%.
2. Which companies are prominent players in the Salmon Industry?
Key companies in the market include Leroy Seafood Group , Cooke Aquaculture , Cermaq, Mowi , Grieg Seafood .
3. What are the main segments of the Salmon Industry?
The market segments include Species Type, Type, Species Type, Type.
4. Can you provide details about the market size?
The market size is estimated to be USD 33.50 Million as of 2022.
5. What are some drivers contributing to market growth?
; Awareness About Health Benefits Associated With Pecan Consumption; Wide Application of Pecan.
6. What are the notable trends driving market growth?
Healthy Boost in the Salmon Production.
7. Are there any restraints impacting market growth?
; Volatility in the Prices; Adverse Weather Conditions Affecting Yield.
8. Can you provide examples of recent developments in the market?
N/A
9. What pricing options are available for accessing the report?
Pricing options include single-user, multi-user, and enterprise licenses priced at USD 4750, USD 5250, and USD 8750 respectively.
10. Is the market size provided in terms of value or volume?
The market size is provided in terms of value, measured in Million.
11. Are there any specific market keywords associated with the report?
Yes, the market keyword associated with the report is "Salmon Industry," which aids in identifying and referencing the specific market segment covered.
12. How do I determine which pricing option suits my needs best?
The pricing options vary based on user requirements and access needs. Individual users may opt for single-user licenses, while businesses requiring broader access may choose multi-user or enterprise licenses for cost-effective access to the report.
13. Are there any additional resources or data provided in the Salmon Industry report?
While the report offers comprehensive insights, it's advisable to review the specific contents or supplementary materials provided to ascertain if additional resources or data are available.
14. How can I stay updated on further developments or reports in the Salmon Industry?
To stay informed about further developments, trends, and reports in the Salmon Industry, consider subscribing to industry newsletters, following relevant companies and organizations, or regularly checking reputable industry news sources and publications.
Methodology
Step 1 - Identification of Relevant Samples Size from Population Database


Step 2 - Approaches for Defining Global Market Size (Value, Volume* & Price*)

Note*: In applicable scenarios
Step 3 - Data Sources
Primary Research
- Web Analytics
- Survey Reports
- Research Institute
- Latest Research Reports
- Opinion Leaders
Secondary Research
- Annual Reports
- White Paper
- Latest Press Release
- Industry Association
- Paid Database
- Investor Presentations

Step 4 - Data Triangulation
Involves using different sources of information in order to increase the validity of a study
These sources are likely to be stakeholders in a program - participants, other researchers, program staff, other community members, and so on.
Then we put all data in single framework & apply various statistical tools to find out the dynamic on the market.
During the analysis stage, feedback from the stakeholder groups would be compared to determine areas of agreement as well as areas of divergence
