

Key Insights
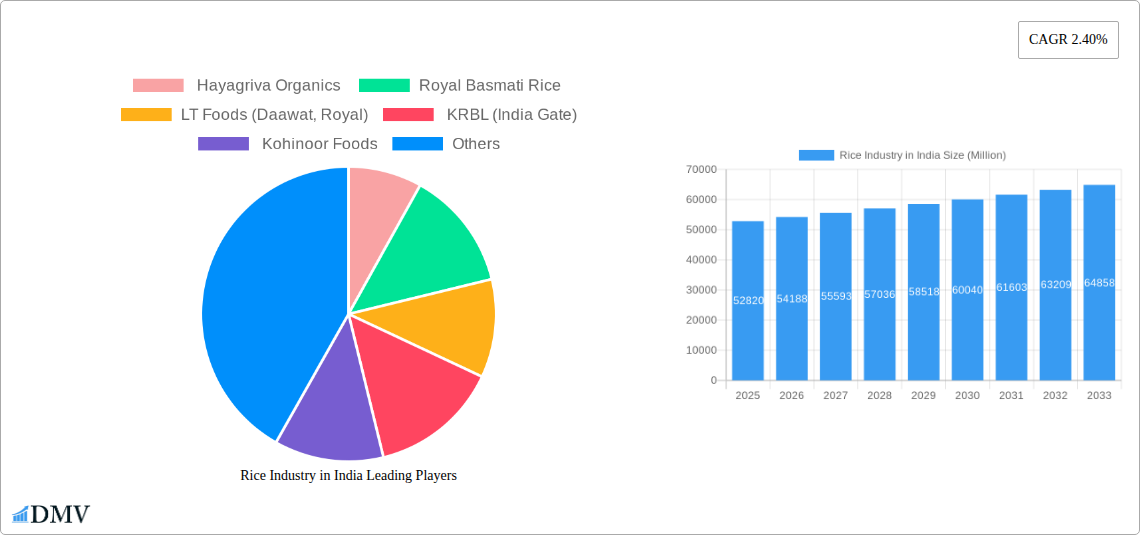
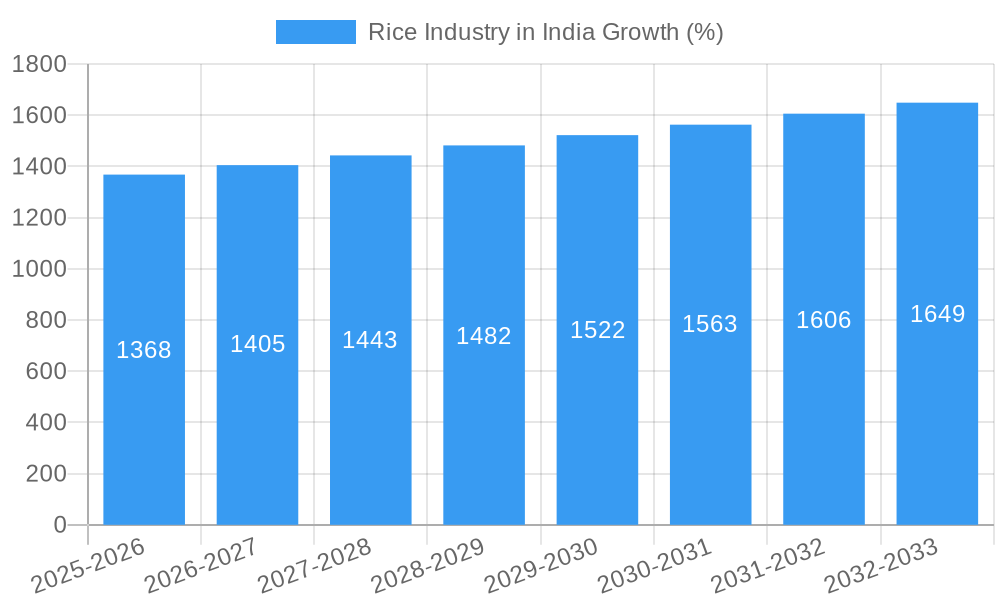
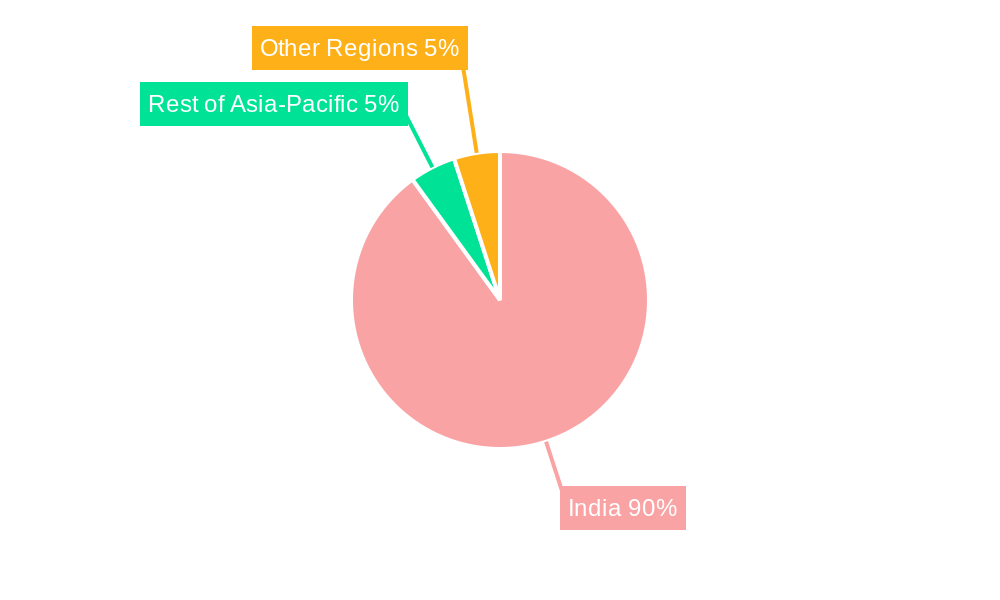
The Indian rice market, valued at $52.82 billion in 2025, exhibits a steady growth trajectory, projected to expand at a compound annual growth rate (CAGR) of 2.40% from 2025 to 2033. This growth is fueled by several key factors. Rising disposable incomes and a burgeoning population are driving increased consumption of rice, a staple food in India. Further growth is spurred by the increasing popularity of packaged and branded rice, particularly Basmati rice, which commands a premium price and caters to evolving consumer preferences for convenience and quality. Government initiatives promoting agricultural development and improved farming techniques also contribute to enhanced production and market supply. However, challenges persist, including climate change impacting yields, fluctuating global prices, and the need for improved infrastructure to facilitate efficient distribution. The market segmentation reveals a significant preference for Basmati rice, followed by Non-Basmati varieties. The fortified rice segment, driven by health consciousness, holds considerable future growth potential. Major players like LT Foods (Daawat, Royal), KRBL (India Gate), and Kohinoor Foods dominate the market, leveraging strong brand recognition and extensive distribution networks. The Asia-Pacific region, particularly India, remains the epicenter of this market, given the country's substantial rice consumption and production capabilities.
The competitive landscape is characterized by a mix of large multinational corporations and smaller regional players. While established brands maintain a strong hold, smaller players are gaining traction by focusing on niche segments, such as organic and specialty rice, catering to the increasing demand for healthier and more sustainable options. Future growth will depend on factors such as technological advancements in rice cultivation, effective supply chain management to ensure timely delivery, and adapting to evolving consumer preferences for convenience and value-added products. The market is expected to experience further consolidation as larger players acquire smaller companies and expand their product portfolios. Furthermore, the market's susceptibility to climatic variations and global price fluctuations necessitate proactive strategies for risk management.
Rice Industry in India: A Comprehensive Market Report (2019-2033)
This insightful report provides a detailed analysis of the Indian rice industry, covering market trends, key players, and future projections from 2019 to 2033. The study period spans the historical period (2019-2024), the base year (2025), and the forecast period (2025-2033), offering stakeholders a complete understanding of this vital sector. With a focus on key segments – Basmati rice, Non-Basmati rice, Fortified rice, and Specialty rice – this report is essential for investors, businesses, and policymakers seeking to navigate the complexities of the Indian rice market. The report values are in Millions.
Rice Industry in India Market Composition & Trends
The Indian rice market, valued at xx Million in 2024, is characterized by a moderately concentrated structure with a few dominant players and a large number of smaller regional producers. Market share distribution is skewed towards large companies like KRBL (India Gate), LT Foods (Daawat, Royal), and Kohinoor Foods, which collectively hold approximately xx% of the market. Innovation in the sector is driven by increased consumer demand for premium rice varieties (Basmati and specialty rices), fortified rice options catering to nutritional needs, and improved farming practices focused on sustainability. The regulatory landscape, encompassing export policies and agricultural subsidies, significantly influences market dynamics. Substitute products, such as wheat and other grains, exert limited competitive pressure given rice's staple food status. End-users primarily include domestic consumers, food processors, and exporters. M&A activity has been relatively moderate in recent years, with deal values averaging around xx Million annually. Notable M&A activity includes (if any available, otherwise write "no major M&A activity reported").
- Market Concentration: Moderately concentrated, with top players holding xx% market share.
- Innovation Catalysts: Consumer demand for premium and fortified rice, sustainable farming practices.
- Regulatory Landscape: Export policies, agricultural subsidies, and food safety regulations significantly affect market dynamics.
- Substitute Products: Limited competition from wheat and other grains.
- End-User Profiles: Domestic consumers, food processors, exporters.
- M&A Activity: Average annual deal value: xx Million. (Specify deals if available, otherwise "no major M&A activity reported").
Rice Industry in India Industry Evolution
The Indian rice industry has witnessed significant evolution over the past five years. Market growth has been driven by a combination of factors, including rising population, increasing disposable incomes, and changing dietary preferences. The historical period (2019-2024) saw an average annual growth rate (AAGR) of xx%, with the market expanding from xx Million in 2019 to xx Million in 2024. This growth is projected to continue in the forecast period (2025-2033), with an estimated AAGR of xx%, leading to a market size of xx Million by 2033. Technological advancements, including improved seed varieties, precision agriculture techniques, and mechanized harvesting, have enhanced productivity and efficiency. Consumer demand is shifting towards premium and fortified rice options, leading to product diversification and innovation within the industry. The industry has also responded to increasing concerns about sustainability through the adoption of climate-smart agricultural practices. The government's initiatives to promote agricultural modernization further fuel this evolution.
Leading Regions, Countries, or Segments in Rice Industry in India
The Indian rice market is dominated by the states of Punjab, Haryana, Uttar Pradesh, and Andhra Pradesh, which are major producers of Basmati and Non-Basmati rice. Basmati rice accounts for a significant portion of the market, primarily due to its high export demand.
Key Drivers for Dominance:
- Basmati Rice: High export demand, premium pricing, established cultivation practices.
- Non-Basmati Rice: Large domestic consumption, diverse varieties suitable for different regions and culinary uses.
- Fortified Rice: Growing awareness of nutritional needs and government initiatives promoting fortified foods.
- Specialty Rice: Increasing demand for niche varieties with unique flavors, textures, and health benefits.
In-depth analysis of dominance: The dominance of Punjab, Haryana, Uttar Pradesh, and Andhra Pradesh stems from favorable climatic conditions, established irrigation infrastructure, and a large pool of skilled agricultural labor. The high export demand for Basmati rice from these regions has fueled significant investment in production and processing capabilities. The growth of the Non-Basmati segment is attributed to its wide acceptance among domestic consumers and its suitability for various culinary preparations. Increased consumer awareness regarding nutrition is driving the market for fortified rice. Finally, the specialty rice segment is benefiting from the rising demand for diverse and premium rice products.
Rice Industry in India Product Innovations
Recent innovations include the development of high-yielding, pest-resistant rice varieties, such as those released by Acharya N.G. Ranga Agricultural University in June 2024. These varieties improve productivity and reduce reliance on chemical pesticides. Furthermore, there's a growing focus on developing fortified rice varieties enriched with essential nutrients like iron and zinc to address malnutrition. The emergence of specialty rice varieties with unique flavors and textures caters to evolving consumer preferences. Technological advancements in processing and packaging have enhanced product quality and shelf life.
Propelling Factors for Rice Industry in India Growth
Several factors contribute to the growth of the Indian rice industry. Technological advancements in agriculture, including improved seed varieties and mechanization, have increased yields and efficiency. Government support through subsidies and infrastructure development has further propelled growth. Rising disposable incomes and changing consumer preferences towards premium and fortified rice varieties are also driving market expansion. Finally, India's substantial export potential contributes significantly to the industry's overall growth.
Obstacles in the Rice Industry in India Market
The Indian rice industry faces several challenges. Climate change poses a threat to rice production through erratic rainfall and extreme weather events. Supply chain disruptions due to logistical issues and infrastructure bottlenecks can lead to increased costs and reduced efficiency. Fluctuations in global rice prices and intense competition from other rice-producing countries affect profitability. Lastly, stringent regulatory norms related to food safety and exports can impact the industry's overall growth.
Future Opportunities in Rice Industry in India
Future opportunities lie in tapping into the growing demand for organic and sustainably produced rice. Expanding into new export markets and developing value-added rice products, such as ready-to-cook meals, can unlock further growth potential. Investing in technologies that enhance water management and resource efficiency will address sustainability concerns. Lastly, capitalizing on the increasing demand for fortified and functional rice varieties can create new market segments and drive industry innovation.
Major Players in the Rice Industry in India Ecosystem
- Hayagriva Organics
- Royal Basmati Rice
- LT Foods (Daawat, Royal)
- KRBL (India Gate)
- Kohinoor Foods
- Chaman Lal Setia Exports
- Amira Nature Foods
Key Developments in Rice Industry in India Industry
- June 2024: Acharya N.G. Ranga Agricultural University released high-yielding, pest-resistant rice varieties (MTU 1271, BPT 2846, BPT 2841, and NLR 3238) for Andhra Pradesh, boosting local production and reducing reliance on pesticides.
- September 2022: Government of India banned broken rice exports, aimed at increasing domestic supply for poultry feed and ethanol production, impacting export-oriented businesses.
- June 2022: Vida Carbon Corp.'s agreement with Core CarbonX Solutions to improve rice cultivation and water management across 100,000 hectares in Telangana enhances sustainability and potentially boosts productivity.
Strategic Rice Industry in India Market Forecast
The Indian rice industry is poised for sustained growth driven by rising domestic demand, export opportunities, and technological advancements. The focus on sustainable practices, fortified rice, and value-added products will shape future market dynamics. The forecast period (2025-2033) promises significant expansion, driven by increasing consumer spending and government support, presenting substantial opportunities for market participants. Further innovation in processing and packaging will also play a key role in shaping future market trends.
Rice Industry in India Segmentation
- 1. Production Analysis (Volume)
- 2. Consumption Analysis (Value and Volume)
- 3. Import Analysis (Value and Volume)
- 4. Export Analysis (Value and Volume)
- 5. Price Trend Analysis
- 6. Production Analysis (Volume)
- 7. Consumption Analysis (Value and Volume)
- 8. Import Analysis (Value and Volume)
- 9. Export Analysis (Value and Volume)
- 10. Price Trend Analysis
Rice Industry in India Segmentation By Geography
-
1. North America
- 1.1. United States
- 1.2. Canada
- 1.3. Mexico
-
2. South America
- 2.1. Brazil
- 2.2. Argentina
- 2.3. Rest of South America
-
3. Europe
- 3.1. United Kingdom
- 3.2. Germany
- 3.3. France
- 3.4. Italy
- 3.5. Spain
- 3.6. Russia
- 3.7. Benelux
- 3.8. Nordics
- 3.9. Rest of Europe
-
4. Middle East & Africa
- 4.1. Turkey
- 4.2. Israel
- 4.3. GCC
- 4.4. North Africa
- 4.5. South Africa
- 4.6. Rest of Middle East & Africa
-
5. Asia Pacific
- 5.1. China
- 5.2. India
- 5.3. Japan
- 5.4. South Korea
- 5.5. ASEAN
- 5.6. Oceania
- 5.7. Rest of Asia Pacific
Rice Industry in India REPORT HIGHLIGHTS
| Aspects | Details |
|---|---|
| Study Period | 2019-2033 |
| Base Year | 2024 |
| Estimated Year | 2025 |
| Forecast Period | 2025-2033 |
| Historical Period | 2019-2024 |
| Growth Rate | CAGR of 2.40% from 2019-2033 |
| Segmentation |
|
Table of Contents
- 1. Introduction
- 1.1. Research Scope
- 1.2. Market Segmentation
- 1.3. Research Methodology
- 1.4. Definitions and Assumptions
- 2. Executive Summary
- 2.1. Introduction
- 3. Market Dynamics
- 3.1. Introduction
- 3.2. Market Drivers
- 3.2.1. Increasing Demand for Indian Rice; Enhancing Production Capacities; Increasing Government Initiatives
- 3.3. Market Restrains
- 3.3.1. Abiotic and Biotic Stresses in Rice Cultivation; High Market Entry Costs
- 3.4. Market Trends
- 3.4.1. Increasing Demand for Indian Rice
- 4. Market Factor Analysis
- 4.1. Porters Five Forces
- 4.2. Supply/Value Chain
- 4.3. PESTEL analysis
- 4.4. Market Entropy
- 4.5. Patent/Trademark Analysis
- 5. Global Rice Industry in India Analysis, Insights and Forecast, 2019-2031
- 5.1. Market Analysis, Insights and Forecast - by Production Analysis (Volume)
- 5.2. Market Analysis, Insights and Forecast - by Consumption Analysis (Value and Volume)
- 5.3. Market Analysis, Insights and Forecast - by Import Analysis (Value and Volume)
- 5.4. Market Analysis, Insights and Forecast - by Export Analysis (Value and Volume)
- 5.5. Market Analysis, Insights and Forecast - by Price Trend Analysis
- 5.6. Market Analysis, Insights and Forecast - by Production Analysis (Volume)
- 5.7. Market Analysis, Insights and Forecast - by Consumption Analysis (Value and Volume)
- 5.8. Market Analysis, Insights and Forecast - by Import Analysis (Value and Volume)
- 5.9. Market Analysis, Insights and Forecast - by Export Analysis (Value and Volume)
- 5.10. Market Analysis, Insights and Forecast - by Price Trend Analysis
- 5.11. Market Analysis, Insights and Forecast - by Region
- 5.11.1. North America
- 5.11.2. South America
- 5.11.3. Europe
- 5.11.4. Middle East & Africa
- 5.11.5. Asia Pacific
- 5.1. Market Analysis, Insights and Forecast - by Production Analysis (Volume)
- 6. North America Rice Industry in India Analysis, Insights and Forecast, 2019-2031
- 6.1. Market Analysis, Insights and Forecast - by Production Analysis (Volume)
- 6.2. Market Analysis, Insights and Forecast - by Consumption Analysis (Value and Volume)
- 6.3. Market Analysis, Insights and Forecast - by Import Analysis (Value and Volume)
- 6.4. Market Analysis, Insights and Forecast - by Export Analysis (Value and Volume)
- 6.5. Market Analysis, Insights and Forecast - by Price Trend Analysis
- 6.6. Market Analysis, Insights and Forecast - by Production Analysis (Volume)
- 6.7. Market Analysis, Insights and Forecast - by Consumption Analysis (Value and Volume)
- 6.8. Market Analysis, Insights and Forecast - by Import Analysis (Value and Volume)
- 6.9. Market Analysis, Insights and Forecast - by Export Analysis (Value and Volume)
- 6.10. Market Analysis, Insights and Forecast - by Price Trend Analysis
- 6.1. Market Analysis, Insights and Forecast - by Production Analysis (Volume)
- 7. South America Rice Industry in India Analysis, Insights and Forecast, 2019-2031
- 7.1. Market Analysis, Insights and Forecast - by Production Analysis (Volume)
- 7.2. Market Analysis, Insights and Forecast - by Consumption Analysis (Value and Volume)
- 7.3. Market Analysis, Insights and Forecast - by Import Analysis (Value and Volume)
- 7.4. Market Analysis, Insights and Forecast - by Export Analysis (Value and Volume)
- 7.5. Market Analysis, Insights and Forecast - by Price Trend Analysis
- 7.6. Market Analysis, Insights and Forecast - by Production Analysis (Volume)
- 7.7. Market Analysis, Insights and Forecast - by Consumption Analysis (Value and Volume)
- 7.8. Market Analysis, Insights and Forecast - by Import Analysis (Value and Volume)
- 7.9. Market Analysis, Insights and Forecast - by Export Analysis (Value and Volume)
- 7.10. Market Analysis, Insights and Forecast - by Price Trend Analysis
- 7.1. Market Analysis, Insights and Forecast - by Production Analysis (Volume)
- 8. Europe Rice Industry in India Analysis, Insights and Forecast, 2019-2031
- 8.1. Market Analysis, Insights and Forecast - by Production Analysis (Volume)
- 8.2. Market Analysis, Insights and Forecast - by Consumption Analysis (Value and Volume)
- 8.3. Market Analysis, Insights and Forecast - by Import Analysis (Value and Volume)
- 8.4. Market Analysis, Insights and Forecast - by Export Analysis (Value and Volume)
- 8.5. Market Analysis, Insights and Forecast - by Price Trend Analysis
- 8.6. Market Analysis, Insights and Forecast - by Production Analysis (Volume)
- 8.7. Market Analysis, Insights and Forecast - by Consumption Analysis (Value and Volume)
- 8.8. Market Analysis, Insights and Forecast - by Import Analysis (Value and Volume)
- 8.9. Market Analysis, Insights and Forecast - by Export Analysis (Value and Volume)
- 8.10. Market Analysis, Insights and Forecast - by Price Trend Analysis
- 8.1. Market Analysis, Insights and Forecast - by Production Analysis (Volume)
- 9. Middle East & Africa Rice Industry in India Analysis, Insights and Forecast, 2019-2031
- 9.1. Market Analysis, Insights and Forecast - by Production Analysis (Volume)
- 9.2. Market Analysis, Insights and Forecast - by Consumption Analysis (Value and Volume)
- 9.3. Market Analysis, Insights and Forecast - by Import Analysis (Value and Volume)
- 9.4. Market Analysis, Insights and Forecast - by Export Analysis (Value and Volume)
- 9.5. Market Analysis, Insights and Forecast - by Price Trend Analysis
- 9.6. Market Analysis, Insights and Forecast - by Production Analysis (Volume)
- 9.7. Market Analysis, Insights and Forecast - by Consumption Analysis (Value and Volume)
- 9.8. Market Analysis, Insights and Forecast - by Import Analysis (Value and Volume)
- 9.9. Market Analysis, Insights and Forecast - by Export Analysis (Value and Volume)
- 9.10. Market Analysis, Insights and Forecast - by Price Trend Analysis
- 9.1. Market Analysis, Insights and Forecast - by Production Analysis (Volume)
- 10. Asia Pacific Rice Industry in India Analysis, Insights and Forecast, 2019-2031
- 10.1. Market Analysis, Insights and Forecast - by Production Analysis (Volume)
- 10.2. Market Analysis, Insights and Forecast - by Consumption Analysis (Value and Volume)
- 10.3. Market Analysis, Insights and Forecast - by Import Analysis (Value and Volume)
- 10.4. Market Analysis, Insights and Forecast - by Export Analysis (Value and Volume)
- 10.5. Market Analysis, Insights and Forecast - by Price Trend Analysis
- 10.6. Market Analysis, Insights and Forecast - by Production Analysis (Volume)
- 10.7. Market Analysis, Insights and Forecast - by Consumption Analysis (Value and Volume)
- 10.8. Market Analysis, Insights and Forecast - by Import Analysis (Value and Volume)
- 10.9. Market Analysis, Insights and Forecast - by Export Analysis (Value and Volume)
- 10.10. Market Analysis, Insights and Forecast - by Price Trend Analysis
- 10.1. Market Analysis, Insights and Forecast - by Production Analysis (Volume)
- 11. China Rice Industry in India Analysis, Insights and Forecast, 2019-2031
- 12. Japan Rice Industry in India Analysis, Insights and Forecast, 2019-2031
- 13. India Rice Industry in India Analysis, Insights and Forecast, 2019-2031
- 14. South Korea Rice Industry in India Analysis, Insights and Forecast, 2019-2031
- 15. Taiwan Rice Industry in India Analysis, Insights and Forecast, 2019-2031
- 16. Australia Rice Industry in India Analysis, Insights and Forecast, 2019-2031
- 17. Rest of Asia-Pacific Rice Industry in India Analysis, Insights and Forecast, 2019-2031
- 18. Competitive Analysis
- 18.1. Global Market Share Analysis 2024
- 18.2. Company Profiles
- 18.2.1 Hayagriva Organics
- 18.2.1.1. Overview
- 18.2.1.2. Products
- 18.2.1.3. SWOT Analysis
- 18.2.1.4. Recent Developments
- 18.2.1.5. Financials (Based on Availability)
- 18.2.2 Royal Basmati Rice
- 18.2.2.1. Overview
- 18.2.2.2. Products
- 18.2.2.3. SWOT Analysis
- 18.2.2.4. Recent Developments
- 18.2.2.5. Financials (Based on Availability)
- 18.2.3 LT Foods (Daawat Royal)
- 18.2.3.1. Overview
- 18.2.3.2. Products
- 18.2.3.3. SWOT Analysis
- 18.2.3.4. Recent Developments
- 18.2.3.5. Financials (Based on Availability)
- 18.2.4 KRBL (India Gate)
- 18.2.4.1. Overview
- 18.2.4.2. Products
- 18.2.4.3. SWOT Analysis
- 18.2.4.4. Recent Developments
- 18.2.4.5. Financials (Based on Availability)
- 18.2.5 Kohinoor Foods
- 18.2.5.1. Overview
- 18.2.5.2. Products
- 18.2.5.3. SWOT Analysis
- 18.2.5.4. Recent Developments
- 18.2.5.5. Financials (Based on Availability)
- 18.2.6 Chaman Lal Setia Exports
- 18.2.6.1. Overview
- 18.2.6.2. Products
- 18.2.6.3. SWOT Analysis
- 18.2.6.4. Recent Developments
- 18.2.6.5. Financials (Based on Availability)
- 18.2.7 Amira Nature Foods
- 18.2.7.1. Overview
- 18.2.7.2. Products
- 18.2.7.3. SWOT Analysis
- 18.2.7.4. Recent Developments
- 18.2.7.5. Financials (Based on Availability)
- 18.2.1 Hayagriva Organics
List of Figures
- Figure 1: Global Rice Industry in India Revenue Breakdown (Million, %) by Region 2024 & 2032
- Figure 2: Global Rice Industry in India Volume Breakdown (Kiloton, %) by Region 2024 & 2032
- Figure 3: Asia Pacific Rice Industry in India Revenue (Million), by Country 2024 & 2032
- Figure 4: Asia Pacific Rice Industry in India Volume (Kiloton), by Country 2024 & 2032
- Figure 5: Asia Pacific Rice Industry in India Revenue Share (%), by Country 2024 & 2032
- Figure 6: Asia Pacific Rice Industry in India Volume Share (%), by Country 2024 & 2032
- Figure 7: North America Rice Industry in India Revenue (Million), by Production Analysis (Volume) 2024 & 2032
- Figure 8: North America Rice Industry in India Volume (Kiloton), by Production Analysis (Volume) 2024 & 2032
- Figure 9: North America Rice Industry in India Revenue Share (%), by Production Analysis (Volume) 2024 & 2032
- Figure 10: North America Rice Industry in India Volume Share (%), by Production Analysis (Volume) 2024 & 2032
- Figure 11: North America Rice Industry in India Revenue (Million), by Consumption Analysis (Value and Volume) 2024 & 2032
- Figure 12: North America Rice Industry in India Volume (Kiloton), by Consumption Analysis (Value and Volume) 2024 & 2032
- Figure 13: North America Rice Industry in India Revenue Share (%), by Consumption Analysis (Value and Volume) 2024 & 2032
- Figure 14: North America Rice Industry in India Volume Share (%), by Consumption Analysis (Value and Volume) 2024 & 2032
- Figure 15: North America Rice Industry in India Revenue (Million), by Import Analysis (Value and Volume) 2024 & 2032
- Figure 16: North America Rice Industry in India Volume (Kiloton), by Import Analysis (Value and Volume) 2024 & 2032
- Figure 17: North America Rice Industry in India Revenue Share (%), by Import Analysis (Value and Volume) 2024 & 2032
- Figure 18: North America Rice Industry in India Volume Share (%), by Import Analysis (Value and Volume) 2024 & 2032
- Figure 19: North America Rice Industry in India Revenue (Million), by Export Analysis (Value and Volume) 2024 & 2032
- Figure 20: North America Rice Industry in India Volume (Kiloton), by Export Analysis (Value and Volume) 2024 & 2032
- Figure 21: North America Rice Industry in India Revenue Share (%), by Export Analysis (Value and Volume) 2024 & 2032
- Figure 22: North America Rice Industry in India Volume Share (%), by Export Analysis (Value and Volume) 2024 & 2032
- Figure 23: North America Rice Industry in India Revenue (Million), by Price Trend Analysis 2024 & 2032
- Figure 24: North America Rice Industry in India Volume (Kiloton), by Price Trend Analysis 2024 & 2032
- Figure 25: North America Rice Industry in India Revenue Share (%), by Price Trend Analysis 2024 & 2032
- Figure 26: North America Rice Industry in India Volume Share (%), by Price Trend Analysis 2024 & 2032
- Figure 27: North America Rice Industry in India Revenue (Million), by Production Analysis (Volume) 2024 & 2032
- Figure 28: North America Rice Industry in India Volume (Kiloton), by Production Analysis (Volume) 2024 & 2032
- Figure 29: North America Rice Industry in India Revenue Share (%), by Production Analysis (Volume) 2024 & 2032
- Figure 30: North America Rice Industry in India Volume Share (%), by Production Analysis (Volume) 2024 & 2032
- Figure 31: North America Rice Industry in India Revenue (Million), by Consumption Analysis (Value and Volume) 2024 & 2032
- Figure 32: North America Rice Industry in India Volume (Kiloton), by Consumption Analysis (Value and Volume) 2024 & 2032
- Figure 33: North America Rice Industry in India Revenue Share (%), by Consumption Analysis (Value and Volume) 2024 & 2032
- Figure 34: North America Rice Industry in India Volume Share (%), by Consumption Analysis (Value and Volume) 2024 & 2032
- Figure 35: North America Rice Industry in India Revenue (Million), by Import Analysis (Value and Volume) 2024 & 2032
- Figure 36: North America Rice Industry in India Volume (Kiloton), by Import Analysis (Value and Volume) 2024 & 2032
- Figure 37: North America Rice Industry in India Revenue Share (%), by Import Analysis (Value and Volume) 2024 & 2032
- Figure 38: North America Rice Industry in India Volume Share (%), by Import Analysis (Value and Volume) 2024 & 2032
- Figure 39: North America Rice Industry in India Revenue (Million), by Export Analysis (Value and Volume) 2024 & 2032
- Figure 40: North America Rice Industry in India Volume (Kiloton), by Export Analysis (Value and Volume) 2024 & 2032
- Figure 41: North America Rice Industry in India Revenue Share (%), by Export Analysis (Value and Volume) 2024 & 2032
- Figure 42: North America Rice Industry in India Volume Share (%), by Export Analysis (Value and Volume) 2024 & 2032
- Figure 43: North America Rice Industry in India Revenue (Million), by Price Trend Analysis 2024 & 2032
- Figure 44: North America Rice Industry in India Volume (Kiloton), by Price Trend Analysis 2024 & 2032
- Figure 45: North America Rice Industry in India Revenue Share (%), by Price Trend Analysis 2024 & 2032
- Figure 46: North America Rice Industry in India Volume Share (%), by Price Trend Analysis 2024 & 2032
- Figure 47: North America Rice Industry in India Revenue (Million), by Country 2024 & 2032
- Figure 48: North America Rice Industry in India Volume (Kiloton), by Country 2024 & 2032
- Figure 49: North America Rice Industry in India Revenue Share (%), by Country 2024 & 2032
- Figure 50: North America Rice Industry in India Volume Share (%), by Country 2024 & 2032
- Figure 51: South America Rice Industry in India Revenue (Million), by Production Analysis (Volume) 2024 & 2032
- Figure 52: South America Rice Industry in India Volume (Kiloton), by Production Analysis (Volume) 2024 & 2032
- Figure 53: South America Rice Industry in India Revenue Share (%), by Production Analysis (Volume) 2024 & 2032
- Figure 54: South America Rice Industry in India Volume Share (%), by Production Analysis (Volume) 2024 & 2032
- Figure 55: South America Rice Industry in India Revenue (Million), by Consumption Analysis (Value and Volume) 2024 & 2032
- Figure 56: South America Rice Industry in India Volume (Kiloton), by Consumption Analysis (Value and Volume) 2024 & 2032
- Figure 57: South America Rice Industry in India Revenue Share (%), by Consumption Analysis (Value and Volume) 2024 & 2032
- Figure 58: South America Rice Industry in India Volume Share (%), by Consumption Analysis (Value and Volume) 2024 & 2032
- Figure 59: South America Rice Industry in India Revenue (Million), by Import Analysis (Value and Volume) 2024 & 2032
- Figure 60: South America Rice Industry in India Volume (Kiloton), by Import Analysis (Value and Volume) 2024 & 2032
- Figure 61: South America Rice Industry in India Revenue Share (%), by Import Analysis (Value and Volume) 2024 & 2032
- Figure 62: South America Rice Industry in India Volume Share (%), by Import Analysis (Value and Volume) 2024 & 2032
- Figure 63: South America Rice Industry in India Revenue (Million), by Export Analysis (Value and Volume) 2024 & 2032
- Figure 64: South America Rice Industry in India Volume (Kiloton), by Export Analysis (Value and Volume) 2024 & 2032
- Figure 65: South America Rice Industry in India Revenue Share (%), by Export Analysis (Value and Volume) 2024 & 2032
- Figure 66: South America Rice Industry in India Volume Share (%), by Export Analysis (Value and Volume) 2024 & 2032
- Figure 67: South America Rice Industry in India Revenue (Million), by Price Trend Analysis 2024 & 2032
- Figure 68: South America Rice Industry in India Volume (Kiloton), by Price Trend Analysis 2024 & 2032
- Figure 69: South America Rice Industry in India Revenue Share (%), by Price Trend Analysis 2024 & 2032
- Figure 70: South America Rice Industry in India Volume Share (%), by Price Trend Analysis 2024 & 2032
- Figure 71: South America Rice Industry in India Revenue (Million), by Production Analysis (Volume) 2024 & 2032
- Figure 72: South America Rice Industry in India Volume (Kiloton), by Production Analysis (Volume) 2024 & 2032
- Figure 73: South America Rice Industry in India Revenue Share (%), by Production Analysis (Volume) 2024 & 2032
- Figure 74: South America Rice Industry in India Volume Share (%), by Production Analysis (Volume) 2024 & 2032
- Figure 75: South America Rice Industry in India Revenue (Million), by Consumption Analysis (Value and Volume) 2024 & 2032
- Figure 76: South America Rice Industry in India Volume (Kiloton), by Consumption Analysis (Value and Volume) 2024 & 2032
- Figure 77: South America Rice Industry in India Revenue Share (%), by Consumption Analysis (Value and Volume) 2024 & 2032
- Figure 78: South America Rice Industry in India Volume Share (%), by Consumption Analysis (Value and Volume) 2024 & 2032
- Figure 79: South America Rice Industry in India Revenue (Million), by Import Analysis (Value and Volume) 2024 & 2032
- Figure 80: South America Rice Industry in India Volume (Kiloton), by Import Analysis (Value and Volume) 2024 & 2032
- Figure 81: South America Rice Industry in India Revenue Share (%), by Import Analysis (Value and Volume) 2024 & 2032
- Figure 82: South America Rice Industry in India Volume Share (%), by Import Analysis (Value and Volume) 2024 & 2032
- Figure 83: South America Rice Industry in India Revenue (Million), by Export Analysis (Value and Volume) 2024 & 2032
- Figure 84: South America Rice Industry in India Volume (Kiloton), by Export Analysis (Value and Volume) 2024 & 2032
- Figure 85: South America Rice Industry in India Revenue Share (%), by Export Analysis (Value and Volume) 2024 & 2032
- Figure 86: South America Rice Industry in India Volume Share (%), by Export Analysis (Value and Volume) 2024 & 2032
- Figure 87: South America Rice Industry in India Revenue (Million), by Price Trend Analysis 2024 & 2032
- Figure 88: South America Rice Industry in India Volume (Kiloton), by Price Trend Analysis 2024 & 2032
- Figure 89: South America Rice Industry in India Revenue Share (%), by Price Trend Analysis 2024 & 2032
- Figure 90: South America Rice Industry in India Volume Share (%), by Price Trend Analysis 2024 & 2032
- Figure 91: South America Rice Industry in India Revenue (Million), by Country 2024 & 2032
- Figure 92: South America Rice Industry in India Volume (Kiloton), by Country 2024 & 2032
- Figure 93: South America Rice Industry in India Revenue Share (%), by Country 2024 & 2032
- Figure 94: South America Rice Industry in India Volume Share (%), by Country 2024 & 2032
- Figure 95: Europe Rice Industry in India Revenue (Million), by Production Analysis (Volume) 2024 & 2032
- Figure 96: Europe Rice Industry in India Volume (Kiloton), by Production Analysis (Volume) 2024 & 2032
- Figure 97: Europe Rice Industry in India Revenue Share (%), by Production Analysis (Volume) 2024 & 2032
- Figure 98: Europe Rice Industry in India Volume Share (%), by Production Analysis (Volume) 2024 & 2032
- Figure 99: Europe Rice Industry in India Revenue (Million), by Consumption Analysis (Value and Volume) 2024 & 2032
- Figure 100: Europe Rice Industry in India Volume (Kiloton), by Consumption Analysis (Value and Volume) 2024 & 2032
- Figure 101: Europe Rice Industry in India Revenue Share (%), by Consumption Analysis (Value and Volume) 2024 & 2032
- Figure 102: Europe Rice Industry in India Volume Share (%), by Consumption Analysis (Value and Volume) 2024 & 2032
- Figure 103: Europe Rice Industry in India Revenue (Million), by Import Analysis (Value and Volume) 2024 & 2032
- Figure 104: Europe Rice Industry in India Volume (Kiloton), by Import Analysis (Value and Volume) 2024 & 2032
- Figure 105: Europe Rice Industry in India Revenue Share (%), by Import Analysis (Value and Volume) 2024 & 2032
- Figure 106: Europe Rice Industry in India Volume Share (%), by Import Analysis (Value and Volume) 2024 & 2032
- Figure 107: Europe Rice Industry in India Revenue (Million), by Export Analysis (Value and Volume) 2024 & 2032
- Figure 108: Europe Rice Industry in India Volume (Kiloton), by Export Analysis (Value and Volume) 2024 & 2032
- Figure 109: Europe Rice Industry in India Revenue Share (%), by Export Analysis (Value and Volume) 2024 & 2032
- Figure 110: Europe Rice Industry in India Volume Share (%), by Export Analysis (Value and Volume) 2024 & 2032
- Figure 111: Europe Rice Industry in India Revenue (Million), by Price Trend Analysis 2024 & 2032
- Figure 112: Europe Rice Industry in India Volume (Kiloton), by Price Trend Analysis 2024 & 2032
- Figure 113: Europe Rice Industry in India Revenue Share (%), by Price Trend Analysis 2024 & 2032
- Figure 114: Europe Rice Industry in India Volume Share (%), by Price Trend Analysis 2024 & 2032
- Figure 115: Europe Rice Industry in India Revenue (Million), by Production Analysis (Volume) 2024 & 2032
- Figure 116: Europe Rice Industry in India Volume (Kiloton), by Production Analysis (Volume) 2024 & 2032
- Figure 117: Europe Rice Industry in India Revenue Share (%), by Production Analysis (Volume) 2024 & 2032
- Figure 118: Europe Rice Industry in India Volume Share (%), by Production Analysis (Volume) 2024 & 2032
- Figure 119: Europe Rice Industry in India Revenue (Million), by Consumption Analysis (Value and Volume) 2024 & 2032
- Figure 120: Europe Rice Industry in India Volume (Kiloton), by Consumption Analysis (Value and Volume) 2024 & 2032
- Figure 121: Europe Rice Industry in India Revenue Share (%), by Consumption Analysis (Value and Volume) 2024 & 2032
- Figure 122: Europe Rice Industry in India Volume Share (%), by Consumption Analysis (Value and Volume) 2024 & 2032
- Figure 123: Europe Rice Industry in India Revenue (Million), by Import Analysis (Value and Volume) 2024 & 2032
- Figure 124: Europe Rice Industry in India Volume (Kiloton), by Import Analysis (Value and Volume) 2024 & 2032
- Figure 125: Europe Rice Industry in India Revenue Share (%), by Import Analysis (Value and Volume) 2024 & 2032
- Figure 126: Europe Rice Industry in India Volume Share (%), by Import Analysis (Value and Volume) 2024 & 2032
- Figure 127: Europe Rice Industry in India Revenue (Million), by Export Analysis (Value and Volume) 2024 & 2032
- Figure 128: Europe Rice Industry in India Volume (Kiloton), by Export Analysis (Value and Volume) 2024 & 2032
- Figure 129: Europe Rice Industry in India Revenue Share (%), by Export Analysis (Value and Volume) 2024 & 2032
- Figure 130: Europe Rice Industry in India Volume Share (%), by Export Analysis (Value and Volume) 2024 & 2032
- Figure 131: Europe Rice Industry in India Revenue (Million), by Price Trend Analysis 2024 & 2032
- Figure 132: Europe Rice Industry in India Volume (Kiloton), by Price Trend Analysis 2024 & 2032
- Figure 133: Europe Rice Industry in India Revenue Share (%), by Price Trend Analysis 2024 & 2032
- Figure 134: Europe Rice Industry in India Volume Share (%), by Price Trend Analysis 2024 & 2032
- Figure 135: Europe Rice Industry in India Revenue (Million), by Country 2024 & 2032
- Figure 136: Europe Rice Industry in India Volume (Kiloton), by Country 2024 & 2032
- Figure 137: Europe Rice Industry in India Revenue Share (%), by Country 2024 & 2032
- Figure 138: Europe Rice Industry in India Volume Share (%), by Country 2024 & 2032
- Figure 139: Middle East & Africa Rice Industry in India Revenue (Million), by Production Analysis (Volume) 2024 & 2032
- Figure 140: Middle East & Africa Rice Industry in India Volume (Kiloton), by Production Analysis (Volume) 2024 & 2032
- Figure 141: Middle East & Africa Rice Industry in India Revenue Share (%), by Production Analysis (Volume) 2024 & 2032
- Figure 142: Middle East & Africa Rice Industry in India Volume Share (%), by Production Analysis (Volume) 2024 & 2032
- Figure 143: Middle East & Africa Rice Industry in India Revenue (Million), by Consumption Analysis (Value and Volume) 2024 & 2032
- Figure 144: Middle East & Africa Rice Industry in India Volume (Kiloton), by Consumption Analysis (Value and Volume) 2024 & 2032
- Figure 145: Middle East & Africa Rice Industry in India Revenue Share (%), by Consumption Analysis (Value and Volume) 2024 & 2032
- Figure 146: Middle East & Africa Rice Industry in India Volume Share (%), by Consumption Analysis (Value and Volume) 2024 & 2032
- Figure 147: Middle East & Africa Rice Industry in India Revenue (Million), by Import Analysis (Value and Volume) 2024 & 2032
- Figure 148: Middle East & Africa Rice Industry in India Volume (Kiloton), by Import Analysis (Value and Volume) 2024 & 2032
- Figure 149: Middle East & Africa Rice Industry in India Revenue Share (%), by Import Analysis (Value and Volume) 2024 & 2032
- Figure 150: Middle East & Africa Rice Industry in India Volume Share (%), by Import Analysis (Value and Volume) 2024 & 2032
- Figure 151: Middle East & Africa Rice Industry in India Revenue (Million), by Export Analysis (Value and Volume) 2024 & 2032
- Figure 152: Middle East & Africa Rice Industry in India Volume (Kiloton), by Export Analysis (Value and Volume) 2024 & 2032
- Figure 153: Middle East & Africa Rice Industry in India Revenue Share (%), by Export Analysis (Value and Volume) 2024 & 2032
- Figure 154: Middle East & Africa Rice Industry in India Volume Share (%), by Export Analysis (Value and Volume) 2024 & 2032
- Figure 155: Middle East & Africa Rice Industry in India Revenue (Million), by Price Trend Analysis 2024 & 2032
- Figure 156: Middle East & Africa Rice Industry in India Volume (Kiloton), by Price Trend Analysis 2024 & 2032
- Figure 157: Middle East & Africa Rice Industry in India Revenue Share (%), by Price Trend Analysis 2024 & 2032
- Figure 158: Middle East & Africa Rice Industry in India Volume Share (%), by Price Trend Analysis 2024 & 2032
- Figure 159: Middle East & Africa Rice Industry in India Revenue (Million), by Production Analysis (Volume) 2024 & 2032
- Figure 160: Middle East & Africa Rice Industry in India Volume (Kiloton), by Production Analysis (Volume) 2024 & 2032
- Figure 161: Middle East & Africa Rice Industry in India Revenue Share (%), by Production Analysis (Volume) 2024 & 2032
- Figure 162: Middle East & Africa Rice Industry in India Volume Share (%), by Production Analysis (Volume) 2024 & 2032
- Figure 163: Middle East & Africa Rice Industry in India Revenue (Million), by Consumption Analysis (Value and Volume) 2024 & 2032
- Figure 164: Middle East & Africa Rice Industry in India Volume (Kiloton), by Consumption Analysis (Value and Volume) 2024 & 2032
- Figure 165: Middle East & Africa Rice Industry in India Revenue Share (%), by Consumption Analysis (Value and Volume) 2024 & 2032
- Figure 166: Middle East & Africa Rice Industry in India Volume Share (%), by Consumption Analysis (Value and Volume) 2024 & 2032
- Figure 167: Middle East & Africa Rice Industry in India Revenue (Million), by Import Analysis (Value and Volume) 2024 & 2032
- Figure 168: Middle East & Africa Rice Industry in India Volume (Kiloton), by Import Analysis (Value and Volume) 2024 & 2032
- Figure 169: Middle East & Africa Rice Industry in India Revenue Share (%), by Import Analysis (Value and Volume) 2024 & 2032
- Figure 170: Middle East & Africa Rice Industry in India Volume Share (%), by Import Analysis (Value and Volume) 2024 & 2032
- Figure 171: Middle East & Africa Rice Industry in India Revenue (Million), by Export Analysis (Value and Volume) 2024 & 2032
- Figure 172: Middle East & Africa Rice Industry in India Volume (Kiloton), by Export Analysis (Value and Volume) 2024 & 2032
- Figure 173: Middle East & Africa Rice Industry in India Revenue Share (%), by Export Analysis (Value and Volume) 2024 & 2032
- Figure 174: Middle East & Africa Rice Industry in India Volume Share (%), by Export Analysis (Value and Volume) 2024 & 2032
- Figure 175: Middle East & Africa Rice Industry in India Revenue (Million), by Price Trend Analysis 2024 & 2032
- Figure 176: Middle East & Africa Rice Industry in India Volume (Kiloton), by Price Trend Analysis 2024 & 2032
- Figure 177: Middle East & Africa Rice Industry in India Revenue Share (%), by Price Trend Analysis 2024 & 2032
- Figure 178: Middle East & Africa Rice Industry in India Volume Share (%), by Price Trend Analysis 2024 & 2032
- Figure 179: Middle East & Africa Rice Industry in India Revenue (Million), by Country 2024 & 2032
- Figure 180: Middle East & Africa Rice Industry in India Volume (Kiloton), by Country 2024 & 2032
- Figure 181: Middle East & Africa Rice Industry in India Revenue Share (%), by Country 2024 & 2032
- Figure 182: Middle East & Africa Rice Industry in India Volume Share (%), by Country 2024 & 2032
- Figure 183: Asia Pacific Rice Industry in India Revenue (Million), by Production Analysis (Volume) 2024 & 2032
- Figure 184: Asia Pacific Rice Industry in India Volume (Kiloton), by Production Analysis (Volume) 2024 & 2032
- Figure 185: Asia Pacific Rice Industry in India Revenue Share (%), by Production Analysis (Volume) 2024 & 2032
- Figure 186: Asia Pacific Rice Industry in India Volume Share (%), by Production Analysis (Volume) 2024 & 2032
- Figure 187: Asia Pacific Rice Industry in India Revenue (Million), by Consumption Analysis (Value and Volume) 2024 & 2032
- Figure 188: Asia Pacific Rice Industry in India Volume (Kiloton), by Consumption Analysis (Value and Volume) 2024 & 2032
- Figure 189: Asia Pacific Rice Industry in India Revenue Share (%), by Consumption Analysis (Value and Volume) 2024 & 2032
- Figure 190: Asia Pacific Rice Industry in India Volume Share (%), by Consumption Analysis (Value and Volume) 2024 & 2032
- Figure 191: Asia Pacific Rice Industry in India Revenue (Million), by Import Analysis (Value and Volume) 2024 & 2032
- Figure 192: Asia Pacific Rice Industry in India Volume (Kiloton), by Import Analysis (Value and Volume) 2024 & 2032
- Figure 193: Asia Pacific Rice Industry in India Revenue Share (%), by Import Analysis (Value and Volume) 2024 & 2032
- Figure 194: Asia Pacific Rice Industry in India Volume Share (%), by Import Analysis (Value and Volume) 2024 & 2032
- Figure 195: Asia Pacific Rice Industry in India Revenue (Million), by Export Analysis (Value and Volume) 2024 & 2032
- Figure 196: Asia Pacific Rice Industry in India Volume (Kiloton), by Export Analysis (Value and Volume) 2024 & 2032
- Figure 197: Asia Pacific Rice Industry in India Revenue Share (%), by Export Analysis (Value and Volume) 2024 & 2032
- Figure 198: Asia Pacific Rice Industry in India Volume Share (%), by Export Analysis (Value and Volume) 2024 & 2032
- Figure 199: Asia Pacific Rice Industry in India Revenue (Million), by Price Trend Analysis 2024 & 2032
- Figure 200: Asia Pacific Rice Industry in India Volume (Kiloton), by Price Trend Analysis 2024 & 2032
- Figure 201: Asia Pacific Rice Industry in India Revenue Share (%), by Price Trend Analysis 2024 & 2032
- Figure 202: Asia Pacific Rice Industry in India Volume Share (%), by Price Trend Analysis 2024 & 2032
- Figure 203: Asia Pacific Rice Industry in India Revenue (Million), by Production Analysis (Volume) 2024 & 2032
- Figure 204: Asia Pacific Rice Industry in India Volume (Kiloton), by Production Analysis (Volume) 2024 & 2032
- Figure 205: Asia Pacific Rice Industry in India Revenue Share (%), by Production Analysis (Volume) 2024 & 2032
- Figure 206: Asia Pacific Rice Industry in India Volume Share (%), by Production Analysis (Volume) 2024 & 2032
- Figure 207: Asia Pacific Rice Industry in India Revenue (Million), by Consumption Analysis (Value and Volume) 2024 & 2032
- Figure 208: Asia Pacific Rice Industry in India Volume (Kiloton), by Consumption Analysis (Value and Volume) 2024 & 2032
- Figure 209: Asia Pacific Rice Industry in India Revenue Share (%), by Consumption Analysis (Value and Volume) 2024 & 2032
- Figure 210: Asia Pacific Rice Industry in India Volume Share (%), by Consumption Analysis (Value and Volume) 2024 & 2032
- Figure 211: Asia Pacific Rice Industry in India Revenue (Million), by Import Analysis (Value and Volume) 2024 & 2032
- Figure 212: Asia Pacific Rice Industry in India Volume (Kiloton), by Import Analysis (Value and Volume) 2024 & 2032
- Figure 213: Asia Pacific Rice Industry in India Revenue Share (%), by Import Analysis (Value and Volume) 2024 & 2032
- Figure 214: Asia Pacific Rice Industry in India Volume Share (%), by Import Analysis (Value and Volume) 2024 & 2032
- Figure 215: Asia Pacific Rice Industry in India Revenue (Million), by Export Analysis (Value and Volume) 2024 & 2032
- Figure 216: Asia Pacific Rice Industry in India Volume (Kiloton), by Export Analysis (Value and Volume) 2024 & 2032
- Figure 217: Asia Pacific Rice Industry in India Revenue Share (%), by Export Analysis (Value and Volume) 2024 & 2032
- Figure 218: Asia Pacific Rice Industry in India Volume Share (%), by Export Analysis (Value and Volume) 2024 & 2032
- Figure 219: Asia Pacific Rice Industry in India Revenue (Million), by Price Trend Analysis 2024 & 2032
- Figure 220: Asia Pacific Rice Industry in India Volume (Kiloton), by Price Trend Analysis 2024 & 2032
- Figure 221: Asia Pacific Rice Industry in India Revenue Share (%), by Price Trend Analysis 2024 & 2032
- Figure 222: Asia Pacific Rice Industry in India Volume Share (%), by Price Trend Analysis 2024 & 2032
- Figure 223: Asia Pacific Rice Industry in India Revenue (Million), by Country 2024 & 2032
- Figure 224: Asia Pacific Rice Industry in India Volume (Kiloton), by Country 2024 & 2032
- Figure 225: Asia Pacific Rice Industry in India Revenue Share (%), by Country 2024 & 2032
- Figure 226: Asia Pacific Rice Industry in India Volume Share (%), by Country 2024 & 2032
List of Tables
- Table 1: Global Rice Industry in India Revenue Million Forecast, by Region 2019 & 2032
- Table 2: Global Rice Industry in India Volume Kiloton Forecast, by Region 2019 & 2032
- Table 3: Global Rice Industry in India Revenue Million Forecast, by Production Analysis (Volume) 2019 & 2032
- Table 4: Global Rice Industry in India Volume Kiloton Forecast, by Production Analysis (Volume) 2019 & 2032
- Table 5: Global Rice Industry in India Revenue Million Forecast, by Consumption Analysis (Value and Volume) 2019 & 2032
- Table 6: Global Rice Industry in India Volume Kiloton Forecast, by Consumption Analysis (Value and Volume) 2019 & 2032
- Table 7: Global Rice Industry in India Revenue Million Forecast, by Import Analysis (Value and Volume) 2019 & 2032
- Table 8: Global Rice Industry in India Volume Kiloton Forecast, by Import Analysis (Value and Volume) 2019 & 2032
- Table 9: Global Rice Industry in India Revenue Million Forecast, by Export Analysis (Value and Volume) 2019 & 2032
- Table 10: Global Rice Industry in India Volume Kiloton Forecast, by Export Analysis (Value and Volume) 2019 & 2032
- Table 11: Global Rice Industry in India Revenue Million Forecast, by Price Trend Analysis 2019 & 2032
- Table 12: Global Rice Industry in India Volume Kiloton Forecast, by Price Trend Analysis 2019 & 2032
- Table 13: Global Rice Industry in India Revenue Million Forecast, by Production Analysis (Volume) 2019 & 2032
- Table 14: Global Rice Industry in India Volume Kiloton Forecast, by Production Analysis (Volume) 2019 & 2032
- Table 15: Global Rice Industry in India Revenue Million Forecast, by Consumption Analysis (Value and Volume) 2019 & 2032
- Table 16: Global Rice Industry in India Volume Kiloton Forecast, by Consumption Analysis (Value and Volume) 2019 & 2032
- Table 17: Global Rice Industry in India Revenue Million Forecast, by Import Analysis (Value and Volume) 2019 & 2032
- Table 18: Global Rice Industry in India Volume Kiloton Forecast, by Import Analysis (Value and Volume) 2019 & 2032
- Table 19: Global Rice Industry in India Revenue Million Forecast, by Export Analysis (Value and Volume) 2019 & 2032
- Table 20: Global Rice Industry in India Volume Kiloton Forecast, by Export Analysis (Value and Volume) 2019 & 2032
- Table 21: Global Rice Industry in India Revenue Million Forecast, by Price Trend Analysis 2019 & 2032
- Table 22: Global Rice Industry in India Volume Kiloton Forecast, by Price Trend Analysis 2019 & 2032
- Table 23: Global Rice Industry in India Revenue Million Forecast, by Region 2019 & 2032
- Table 24: Global Rice Industry in India Volume Kiloton Forecast, by Region 2019 & 2032
- Table 25: Global Rice Industry in India Revenue Million Forecast, by Country 2019 & 2032
- Table 26: Global Rice Industry in India Volume Kiloton Forecast, by Country 2019 & 2032
- Table 27: China Rice Industry in India Revenue (Million) Forecast, by Application 2019 & 2032
- Table 28: China Rice Industry in India Volume (Kiloton) Forecast, by Application 2019 & 2032
- Table 29: Japan Rice Industry in India Revenue (Million) Forecast, by Application 2019 & 2032
- Table 30: Japan Rice Industry in India Volume (Kiloton) Forecast, by Application 2019 & 2032
- Table 31: India Rice Industry in India Revenue (Million) Forecast, by Application 2019 & 2032
- Table 32: India Rice Industry in India Volume (Kiloton) Forecast, by Application 2019 & 2032
- Table 33: South Korea Rice Industry in India Revenue (Million) Forecast, by Application 2019 & 2032
- Table 34: South Korea Rice Industry in India Volume (Kiloton) Forecast, by Application 2019 & 2032
- Table 35: Taiwan Rice Industry in India Revenue (Million) Forecast, by Application 2019 & 2032
- Table 36: Taiwan Rice Industry in India Volume (Kiloton) Forecast, by Application 2019 & 2032
- Table 37: Australia Rice Industry in India Revenue (Million) Forecast, by Application 2019 & 2032
- Table 38: Australia Rice Industry in India Volume (Kiloton) Forecast, by Application 2019 & 2032
- Table 39: Rest of Asia-Pacific Rice Industry in India Revenue (Million) Forecast, by Application 2019 & 2032
- Table 40: Rest of Asia-Pacific Rice Industry in India Volume (Kiloton) Forecast, by Application 2019 & 2032
- Table 41: Global Rice Industry in India Revenue Million Forecast, by Production Analysis (Volume) 2019 & 2032
- Table 42: Global Rice Industry in India Volume Kiloton Forecast, by Production Analysis (Volume) 2019 & 2032
- Table 43: Global Rice Industry in India Revenue Million Forecast, by Consumption Analysis (Value and Volume) 2019 & 2032
- Table 44: Global Rice Industry in India Volume Kiloton Forecast, by Consumption Analysis (Value and Volume) 2019 & 2032
- Table 45: Global Rice Industry in India Revenue Million Forecast, by Import Analysis (Value and Volume) 2019 & 2032
- Table 46: Global Rice Industry in India Volume Kiloton Forecast, by Import Analysis (Value and Volume) 2019 & 2032
- Table 47: Global Rice Industry in India Revenue Million Forecast, by Export Analysis (Value and Volume) 2019 & 2032
- Table 48: Global Rice Industry in India Volume Kiloton Forecast, by Export Analysis (Value and Volume) 2019 & 2032
- Table 49: Global Rice Industry in India Revenue Million Forecast, by Price Trend Analysis 2019 & 2032
- Table 50: Global Rice Industry in India Volume Kiloton Forecast, by Price Trend Analysis 2019 & 2032
- Table 51: Global Rice Industry in India Revenue Million Forecast, by Production Analysis (Volume) 2019 & 2032
- Table 52: Global Rice Industry in India Volume Kiloton Forecast, by Production Analysis (Volume) 2019 & 2032
- Table 53: Global Rice Industry in India Revenue Million Forecast, by Consumption Analysis (Value and Volume) 2019 & 2032
- Table 54: Global Rice Industry in India Volume Kiloton Forecast, by Consumption Analysis (Value and Volume) 2019 & 2032
- Table 55: Global Rice Industry in India Revenue Million Forecast, by Import Analysis (Value and Volume) 2019 & 2032
- Table 56: Global Rice Industry in India Volume Kiloton Forecast, by Import Analysis (Value and Volume) 2019 & 2032
- Table 57: Global Rice Industry in India Revenue Million Forecast, by Export Analysis (Value and Volume) 2019 & 2032
- Table 58: Global Rice Industry in India Volume Kiloton Forecast, by Export Analysis (Value and Volume) 2019 & 2032
- Table 59: Global Rice Industry in India Revenue Million Forecast, by Price Trend Analysis 2019 & 2032
- Table 60: Global Rice Industry in India Volume Kiloton Forecast, by Price Trend Analysis 2019 & 2032
- Table 61: Global Rice Industry in India Revenue Million Forecast, by Country 2019 & 2032
- Table 62: Global Rice Industry in India Volume Kiloton Forecast, by Country 2019 & 2032
- Table 63: United States Rice Industry in India Revenue (Million) Forecast, by Application 2019 & 2032
- Table 64: United States Rice Industry in India Volume (Kiloton) Forecast, by Application 2019 & 2032
- Table 65: Canada Rice Industry in India Revenue (Million) Forecast, by Application 2019 & 2032
- Table 66: Canada Rice Industry in India Volume (Kiloton) Forecast, by Application 2019 & 2032
- Table 67: Mexico Rice Industry in India Revenue (Million) Forecast, by Application 2019 & 2032
- Table 68: Mexico Rice Industry in India Volume (Kiloton) Forecast, by Application 2019 & 2032
- Table 69: Global Rice Industry in India Revenue Million Forecast, by Production Analysis (Volume) 2019 & 2032
- Table 70: Global Rice Industry in India Volume Kiloton Forecast, by Production Analysis (Volume) 2019 & 2032
- Table 71: Global Rice Industry in India Revenue Million Forecast, by Consumption Analysis (Value and Volume) 2019 & 2032
- Table 72: Global Rice Industry in India Volume Kiloton Forecast, by Consumption Analysis (Value and Volume) 2019 & 2032
- Table 73: Global Rice Industry in India Revenue Million Forecast, by Import Analysis (Value and Volume) 2019 & 2032
- Table 74: Global Rice Industry in India Volume Kiloton Forecast, by Import Analysis (Value and Volume) 2019 & 2032
- Table 75: Global Rice Industry in India Revenue Million Forecast, by Export Analysis (Value and Volume) 2019 & 2032
- Table 76: Global Rice Industry in India Volume Kiloton Forecast, by Export Analysis (Value and Volume) 2019 & 2032
- Table 77: Global Rice Industry in India Revenue Million Forecast, by Price Trend Analysis 2019 & 2032
- Table 78: Global Rice Industry in India Volume Kiloton Forecast, by Price Trend Analysis 2019 & 2032
- Table 79: Global Rice Industry in India Revenue Million Forecast, by Production Analysis (Volume) 2019 & 2032
- Table 80: Global Rice Industry in India Volume Kiloton Forecast, by Production Analysis (Volume) 2019 & 2032
- Table 81: Global Rice Industry in India Revenue Million Forecast, by Consumption Analysis (Value and Volume) 2019 & 2032
- Table 82: Global Rice Industry in India Volume Kiloton Forecast, by Consumption Analysis (Value and Volume) 2019 & 2032
- Table 83: Global Rice Industry in India Revenue Million Forecast, by Import Analysis (Value and Volume) 2019 & 2032
- Table 84: Global Rice Industry in India Volume Kiloton Forecast, by Import Analysis (Value and Volume) 2019 & 2032
- Table 85: Global Rice Industry in India Revenue Million Forecast, by Export Analysis (Value and Volume) 2019 & 2032
- Table 86: Global Rice Industry in India Volume Kiloton Forecast, by Export Analysis (Value and Volume) 2019 & 2032
- Table 87: Global Rice Industry in India Revenue Million Forecast, by Price Trend Analysis 2019 & 2032
- Table 88: Global Rice Industry in India Volume Kiloton Forecast, by Price Trend Analysis 2019 & 2032
- Table 89: Global Rice Industry in India Revenue Million Forecast, by Country 2019 & 2032
- Table 90: Global Rice Industry in India Volume Kiloton Forecast, by Country 2019 & 2032
- Table 91: Brazil Rice Industry in India Revenue (Million) Forecast, by Application 2019 & 2032
- Table 92: Brazil Rice Industry in India Volume (Kiloton) Forecast, by Application 2019 & 2032
- Table 93: Argentina Rice Industry in India Revenue (Million) Forecast, by Application 2019 & 2032
- Table 94: Argentina Rice Industry in India Volume (Kiloton) Forecast, by Application 2019 & 2032
- Table 95: Rest of South America Rice Industry in India Revenue (Million) Forecast, by Application 2019 & 2032
- Table 96: Rest of South America Rice Industry in India Volume (Kiloton) Forecast, by Application 2019 & 2032
- Table 97: Global Rice Industry in India Revenue Million Forecast, by Production Analysis (Volume) 2019 & 2032
- Table 98: Global Rice Industry in India Volume Kiloton Forecast, by Production Analysis (Volume) 2019 & 2032
- Table 99: Global Rice Industry in India Revenue Million Forecast, by Consumption Analysis (Value and Volume) 2019 & 2032
- Table 100: Global Rice Industry in India Volume Kiloton Forecast, by Consumption Analysis (Value and Volume) 2019 & 2032
- Table 101: Global Rice Industry in India Revenue Million Forecast, by Import Analysis (Value and Volume) 2019 & 2032
- Table 102: Global Rice Industry in India Volume Kiloton Forecast, by Import Analysis (Value and Volume) 2019 & 2032
- Table 103: Global Rice Industry in India Revenue Million Forecast, by Export Analysis (Value and Volume) 2019 & 2032
- Table 104: Global Rice Industry in India Volume Kiloton Forecast, by Export Analysis (Value and Volume) 2019 & 2032
- Table 105: Global Rice Industry in India Revenue Million Forecast, by Price Trend Analysis 2019 & 2032
- Table 106: Global Rice Industry in India Volume Kiloton Forecast, by Price Trend Analysis 2019 & 2032
- Table 107: Global Rice Industry in India Revenue Million Forecast, by Production Analysis (Volume) 2019 & 2032
- Table 108: Global Rice Industry in India Volume Kiloton Forecast, by Production Analysis (Volume) 2019 & 2032
- Table 109: Global Rice Industry in India Revenue Million Forecast, by Consumption Analysis (Value and Volume) 2019 & 2032
- Table 110: Global Rice Industry in India Volume Kiloton Forecast, by Consumption Analysis (Value and Volume) 2019 & 2032
- Table 111: Global Rice Industry in India Revenue Million Forecast, by Import Analysis (Value and Volume) 2019 & 2032
- Table 112: Global Rice Industry in India Volume Kiloton Forecast, by Import Analysis (Value and Volume) 2019 & 2032
- Table 113: Global Rice Industry in India Revenue Million Forecast, by Export Analysis (Value and Volume) 2019 & 2032
- Table 114: Global Rice Industry in India Volume Kiloton Forecast, by Export Analysis (Value and Volume) 2019 & 2032
- Table 115: Global Rice Industry in India Revenue Million Forecast, by Price Trend Analysis 2019 & 2032
- Table 116: Global Rice Industry in India Volume Kiloton Forecast, by Price Trend Analysis 2019 & 2032
- Table 117: Global Rice Industry in India Revenue Million Forecast, by Country 2019 & 2032
- Table 118: Global Rice Industry in India Volume Kiloton Forecast, by Country 2019 & 2032
- Table 119: United Kingdom Rice Industry in India Revenue (Million) Forecast, by Application 2019 & 2032
- Table 120: United Kingdom Rice Industry in India Volume (Kiloton) Forecast, by Application 2019 & 2032
- Table 121: Germany Rice Industry in India Revenue (Million) Forecast, by Application 2019 & 2032
- Table 122: Germany Rice Industry in India Volume (Kiloton) Forecast, by Application 2019 & 2032
- Table 123: France Rice Industry in India Revenue (Million) Forecast, by Application 2019 & 2032
- Table 124: France Rice Industry in India Volume (Kiloton) Forecast, by Application 2019 & 2032
- Table 125: Italy Rice Industry in India Revenue (Million) Forecast, by Application 2019 & 2032
- Table 126: Italy Rice Industry in India Volume (Kiloton) Forecast, by Application 2019 & 2032
- Table 127: Spain Rice Industry in India Revenue (Million) Forecast, by Application 2019 & 2032
- Table 128: Spain Rice Industry in India Volume (Kiloton) Forecast, by Application 2019 & 2032
- Table 129: Russia Rice Industry in India Revenue (Million) Forecast, by Application 2019 & 2032
- Table 130: Russia Rice Industry in India Volume (Kiloton) Forecast, by Application 2019 & 2032
- Table 131: Benelux Rice Industry in India Revenue (Million) Forecast, by Application 2019 & 2032
- Table 132: Benelux Rice Industry in India Volume (Kiloton) Forecast, by Application 2019 & 2032
- Table 133: Nordics Rice Industry in India Revenue (Million) Forecast, by Application 2019 & 2032
- Table 134: Nordics Rice Industry in India Volume (Kiloton) Forecast, by Application 2019 & 2032
- Table 135: Rest of Europe Rice Industry in India Revenue (Million) Forecast, by Application 2019 & 2032
- Table 136: Rest of Europe Rice Industry in India Volume (Kiloton) Forecast, by Application 2019 & 2032
- Table 137: Global Rice Industry in India Revenue Million Forecast, by Production Analysis (Volume) 2019 & 2032
- Table 138: Global Rice Industry in India Volume Kiloton Forecast, by Production Analysis (Volume) 2019 & 2032
- Table 139: Global Rice Industry in India Revenue Million Forecast, by Consumption Analysis (Value and Volume) 2019 & 2032
- Table 140: Global Rice Industry in India Volume Kiloton Forecast, by Consumption Analysis (Value and Volume) 2019 & 2032
- Table 141: Global Rice Industry in India Revenue Million Forecast, by Import Analysis (Value and Volume) 2019 & 2032
- Table 142: Global Rice Industry in India Volume Kiloton Forecast, by Import Analysis (Value and Volume) 2019 & 2032
- Table 143: Global Rice Industry in India Revenue Million Forecast, by Export Analysis (Value and Volume) 2019 & 2032
- Table 144: Global Rice Industry in India Volume Kiloton Forecast, by Export Analysis (Value and Volume) 2019 & 2032
- Table 145: Global Rice Industry in India Revenue Million Forecast, by Price Trend Analysis 2019 & 2032
- Table 146: Global Rice Industry in India Volume Kiloton Forecast, by Price Trend Analysis 2019 & 2032
- Table 147: Global Rice Industry in India Revenue Million Forecast, by Production Analysis (Volume) 2019 & 2032
- Table 148: Global Rice Industry in India Volume Kiloton Forecast, by Production Analysis (Volume) 2019 & 2032
- Table 149: Global Rice Industry in India Revenue Million Forecast, by Consumption Analysis (Value and Volume) 2019 & 2032
- Table 150: Global Rice Industry in India Volume Kiloton Forecast, by Consumption Analysis (Value and Volume) 2019 & 2032
- Table 151: Global Rice Industry in India Revenue Million Forecast, by Import Analysis (Value and Volume) 2019 & 2032
- Table 152: Global Rice Industry in India Volume Kiloton Forecast, by Import Analysis (Value and Volume) 2019 & 2032
- Table 153: Global Rice Industry in India Revenue Million Forecast, by Export Analysis (Value and Volume) 2019 & 2032
- Table 154: Global Rice Industry in India Volume Kiloton Forecast, by Export Analysis (Value and Volume) 2019 & 2032
- Table 155: Global Rice Industry in India Revenue Million Forecast, by Price Trend Analysis 2019 & 2032
- Table 156: Global Rice Industry in India Volume Kiloton Forecast, by Price Trend Analysis 2019 & 2032
- Table 157: Global Rice Industry in India Revenue Million Forecast, by Country 2019 & 2032
- Table 158: Global Rice Industry in India Volume Kiloton Forecast, by Country 2019 & 2032
- Table 159: Turkey Rice Industry in India Revenue (Million) Forecast, by Application 2019 & 2032
- Table 160: Turkey Rice Industry in India Volume (Kiloton) Forecast, by Application 2019 & 2032
- Table 161: Israel Rice Industry in India Revenue (Million) Forecast, by Application 2019 & 2032
- Table 162: Israel Rice Industry in India Volume (Kiloton) Forecast, by Application 2019 & 2032
- Table 163: GCC Rice Industry in India Revenue (Million) Forecast, by Application 2019 & 2032
- Table 164: GCC Rice Industry in India Volume (Kiloton) Forecast, by Application 2019 & 2032
- Table 165: North Africa Rice Industry in India Revenue (Million) Forecast, by Application 2019 & 2032
- Table 166: North Africa Rice Industry in India Volume (Kiloton) Forecast, by Application 2019 & 2032
- Table 167: South Africa Rice Industry in India Revenue (Million) Forecast, by Application 2019 & 2032
- Table 168: South Africa Rice Industry in India Volume (Kiloton) Forecast, by Application 2019 & 2032
- Table 169: Rest of Middle East & Africa Rice Industry in India Revenue (Million) Forecast, by Application 2019 & 2032
- Table 170: Rest of Middle East & Africa Rice Industry in India Volume (Kiloton) Forecast, by Application 2019 & 2032
- Table 171: Global Rice Industry in India Revenue Million Forecast, by Production Analysis (Volume) 2019 & 2032
- Table 172: Global Rice Industry in India Volume Kiloton Forecast, by Production Analysis (Volume) 2019 & 2032
- Table 173: Global Rice Industry in India Revenue Million Forecast, by Consumption Analysis (Value and Volume) 2019 & 2032
- Table 174: Global Rice Industry in India Volume Kiloton Forecast, by Consumption Analysis (Value and Volume) 2019 & 2032
- Table 175: Global Rice Industry in India Revenue Million Forecast, by Import Analysis (Value and Volume) 2019 & 2032
- Table 176: Global Rice Industry in India Volume Kiloton Forecast, by Import Analysis (Value and Volume) 2019 & 2032
- Table 177: Global Rice Industry in India Revenue Million Forecast, by Export Analysis (Value and Volume) 2019 & 2032
- Table 178: Global Rice Industry in India Volume Kiloton Forecast, by Export Analysis (Value and Volume) 2019 & 2032
- Table 179: Global Rice Industry in India Revenue Million Forecast, by Price Trend Analysis 2019 & 2032
- Table 180: Global Rice Industry in India Volume Kiloton Forecast, by Price Trend Analysis 2019 & 2032
- Table 181: Global Rice Industry in India Revenue Million Forecast, by Production Analysis (Volume) 2019 & 2032
- Table 182: Global Rice Industry in India Volume Kiloton Forecast, by Production Analysis (Volume) 2019 & 2032
- Table 183: Global Rice Industry in India Revenue Million Forecast, by Consumption Analysis (Value and Volume) 2019 & 2032
- Table 184: Global Rice Industry in India Volume Kiloton Forecast, by Consumption Analysis (Value and Volume) 2019 & 2032
- Table 185: Global Rice Industry in India Revenue Million Forecast, by Import Analysis (Value and Volume) 2019 & 2032
- Table 186: Global Rice Industry in India Volume Kiloton Forecast, by Import Analysis (Value and Volume) 2019 & 2032
- Table 187: Global Rice Industry in India Revenue Million Forecast, by Export Analysis (Value and Volume) 2019 & 2032
- Table 188: Global Rice Industry in India Volume Kiloton Forecast, by Export Analysis (Value and Volume) 2019 & 2032
- Table 189: Global Rice Industry in India Revenue Million Forecast, by Price Trend Analysis 2019 & 2032
- Table 190: Global Rice Industry in India Volume Kiloton Forecast, by Price Trend Analysis 2019 & 2032
- Table 191: Global Rice Industry in India Revenue Million Forecast, by Country 2019 & 2032
- Table 192: Global Rice Industry in India Volume Kiloton Forecast, by Country 2019 & 2032
- Table 193: China Rice Industry in India Revenue (Million) Forecast, by Application 2019 & 2032
- Table 194: China Rice Industry in India Volume (Kiloton) Forecast, by Application 2019 & 2032
- Table 195: India Rice Industry in India Revenue (Million) Forecast, by Application 2019 & 2032
- Table 196: India Rice Industry in India Volume (Kiloton) Forecast, by Application 2019 & 2032
- Table 197: Japan Rice Industry in India Revenue (Million) Forecast, by Application 2019 & 2032
- Table 198: Japan Rice Industry in India Volume (Kiloton) Forecast, by Application 2019 & 2032
- Table 199: South Korea Rice Industry in India Revenue (Million) Forecast, by Application 2019 & 2032
- Table 200: South Korea Rice Industry in India Volume (Kiloton) Forecast, by Application 2019 & 2032
- Table 201: ASEAN Rice Industry in India Revenue (Million) Forecast, by Application 2019 & 2032
- Table 202: ASEAN Rice Industry in India Volume (Kiloton) Forecast, by Application 2019 & 2032
- Table 203: Oceania Rice Industry in India Revenue (Million) Forecast, by Application 2019 & 2032
- Table 204: Oceania Rice Industry in India Volume (Kiloton) Forecast, by Application 2019 & 2032
- Table 205: Rest of Asia Pacific Rice Industry in India Revenue (Million) Forecast, by Application 2019 & 2032
- Table 206: Rest of Asia Pacific Rice Industry in India Volume (Kiloton) Forecast, by Application 2019 & 2032
Frequently Asked Questions
1. What is the projected Compound Annual Growth Rate (CAGR) of the Rice Industry in India?
The projected CAGR is approximately 2.40%.
2. Which companies are prominent players in the Rice Industry in India?
Key companies in the market include Hayagriva Organics , Royal Basmati Rice , LT Foods (Daawat, Royal), KRBL (India Gate), Kohinoor Foods, Chaman Lal Setia Exports, Amira Nature Foods.
3. What are the main segments of the Rice Industry in India?
The market segments include Production Analysis (Volume), Consumption Analysis (Value and Volume), Import Analysis (Value and Volume), Export Analysis (Value and Volume), Price Trend Analysis, Production Analysis (Volume), Consumption Analysis (Value and Volume), Import Analysis (Value and Volume), Export Analysis (Value and Volume), Price Trend Analysis.
4. Can you provide details about the market size?
The market size is estimated to be USD 52.82 Million as of 2022.
5. What are some drivers contributing to market growth?
Increasing Demand for Indian Rice; Enhancing Production Capacities; Increasing Government Initiatives.
6. What are the notable trends driving market growth?
Increasing Demand for Indian Rice.
7. Are there any restraints impacting market growth?
Abiotic and Biotic Stresses in Rice Cultivation; High Market Entry Costs.
8. Can you provide examples of recent developments in the market?
June 2024: The Acharya N.G. Ranga Agricultural University released rice varieties suitable for Andhra Pradesh. The varieties are MTU 1271, BPT 2846, BPT 2841, and NLR 3238. The new varieties are high-yielding and resistant to various pests and diseases.
9. What pricing options are available for accessing the report?
Pricing options include single-user, multi-user, and enterprise licenses priced at USD 3800, USD 4500, and USD 5800 respectively.
10. Is the market size provided in terms of value or volume?
The market size is provided in terms of value, measured in Million and volume, measured in Kiloton.
11. Are there any specific market keywords associated with the report?
Yes, the market keyword associated with the report is "Rice Industry in India," which aids in identifying and referencing the specific market segment covered.
12. How do I determine which pricing option suits my needs best?
The pricing options vary based on user requirements and access needs. Individual users may opt for single-user licenses, while businesses requiring broader access may choose multi-user or enterprise licenses for cost-effective access to the report.
13. Are there any additional resources or data provided in the Rice Industry in India report?
While the report offers comprehensive insights, it's advisable to review the specific contents or supplementary materials provided to ascertain if additional resources or data are available.
14. How can I stay updated on further developments or reports in the Rice Industry in India?
To stay informed about further developments, trends, and reports in the Rice Industry in India, consider subscribing to industry newsletters, following relevant companies and organizations, or regularly checking reputable industry news sources and publications.
Methodology
Step 1 - Identification of Relevant Samples Size from Population Database


Step 2 - Approaches for Defining Global Market Size (Value, Volume* & Price*)

Note*: In applicable scenarios
Step 3 - Data Sources
Primary Research
- Web Analytics
- Survey Reports
- Research Institute
- Latest Research Reports
- Opinion Leaders
Secondary Research
- Annual Reports
- White Paper
- Latest Press Release
- Industry Association
- Paid Database
- Investor Presentations

Step 4 - Data Triangulation
Involves using different sources of information in order to increase the validity of a study
These sources are likely to be stakeholders in a program - participants, other researchers, program staff, other community members, and so on.
Then we put all data in single framework & apply various statistical tools to find out the dynamic on the market.
During the analysis stage, feedback from the stakeholder groups would be compared to determine areas of agreement as well as areas of divergence
