

Key Insights
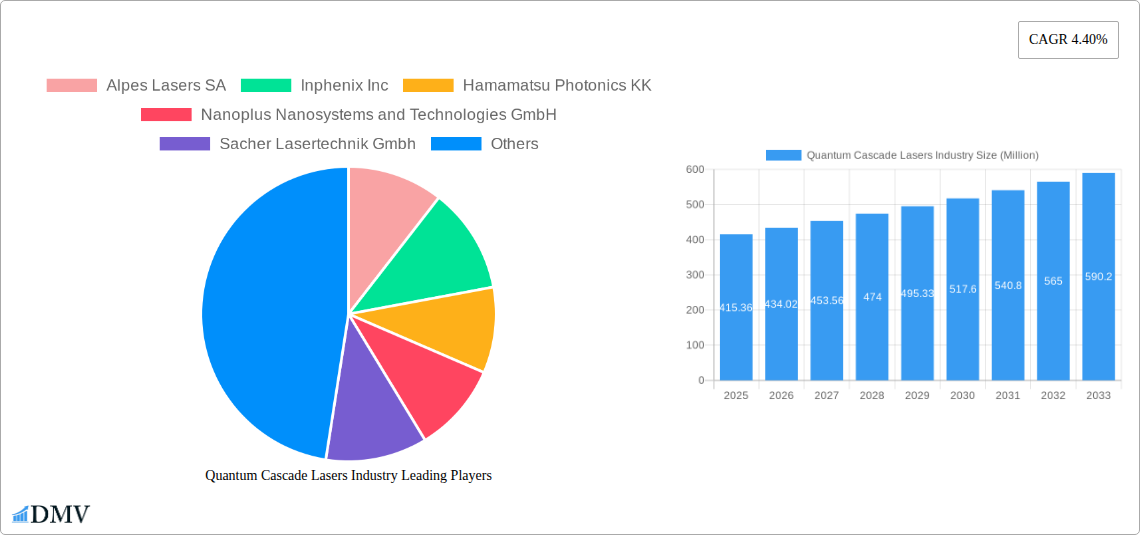
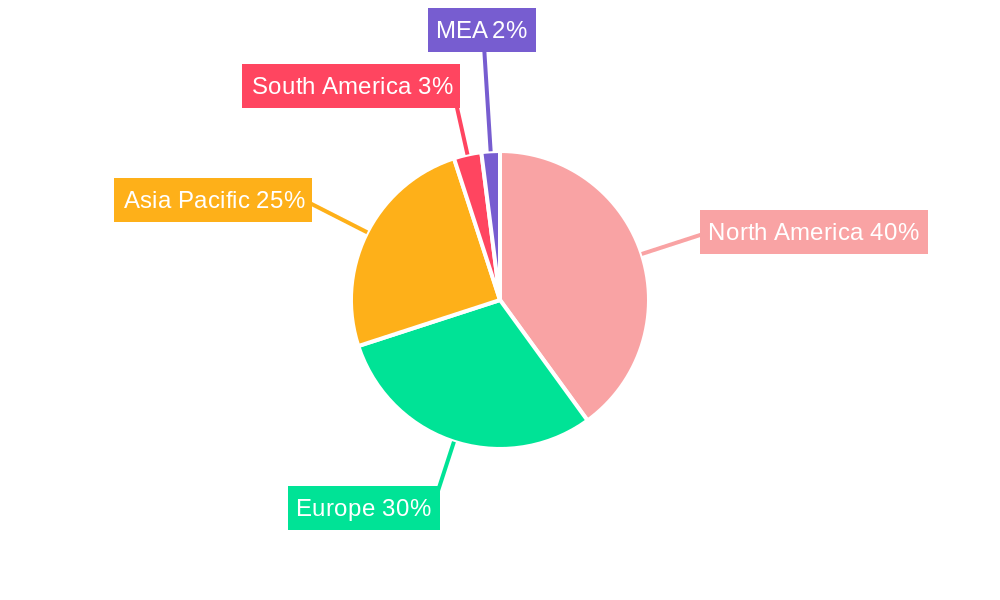
The Quantum Cascade Laser (QCL) market, valued at $415.36 million in 2025, is projected to experience robust growth, driven by increasing demand across diverse sectors. A compound annual growth rate (CAGR) of 4.40% from 2025 to 2033 indicates a substantial market expansion. Key drivers include the rising adoption of QCLs in gas sensing applications for environmental monitoring and industrial process control, the growing need for high-precision medical diagnostics and therapeutic devices, and the increasing sophistication of military and defense technologies. Furthermore, advancements in laser technology leading to enhanced performance characteristics, such as higher power output and improved wavelength tunability, are fueling market expansion. The market segmentation reveals Fabry-Perot lasers currently hold a significant market share, followed by Distributed Feedback lasers. Continuous wave operation dominates the operational segment, showcasing the prevalent application requirements. The industrial sector is a major end-user, followed by the medical and telecommunication sectors. North America currently commands a considerable market share, reflecting the region's strong technological advancements and adoption rates, while Asia-Pacific is expected to witness significant growth during the forecast period driven by increasing industrialization and technological investments in emerging economies like China and India.
Despite promising growth, the QCL market faces certain restraints. High manufacturing costs associated with advanced QCL technology could limit broader adoption, particularly in price-sensitive sectors. Moreover, the technological complexities involved in QCL design and integration can potentially hinder wider market penetration. However, ongoing research and development efforts focused on cost reduction and improved manufacturing processes are expected to mitigate these limitations over the forecast period. Leading companies like Alpes Lasers SA, Inphenix Inc., and Thorlabs Inc. are actively contributing to market growth through innovative product development and strategic partnerships. Competitive landscape analysis suggests a trend toward increased mergers and acquisitions, aiming to strengthen market positions and expand product portfolios. The market's future trajectory is positive, with advancements in miniaturization and integration of QCLs into compact and portable devices further fostering widespread adoption across various applications.
Quantum Cascade Lasers (QCL) Industry Market Report: 2019-2033
This comprehensive report provides an in-depth analysis of the Quantum Cascade Lasers (QCL) industry, offering a detailed market overview, competitive landscape, and future growth projections from 2019 to 2033. The study covers key segments, technological advancements, and major players shaping this dynamic market expected to reach xx Million by 2033. This report is invaluable for stakeholders seeking to understand the current state and future trajectory of the QCL market.
Quantum Cascade Lasers Industry Market Composition & Trends
This section delves into the market concentration, analyzing the market share distribution among key players like Alpes Lasers SA, Inphenix Inc, Hamamatsu Photonics KK, Nanoplus Nanosystems and Technologies GmbH, Sacher Lasertechnik GmbH, Leonardo DRS Inc, Block Engineering Inc, Mirsense SAS, Thorlabs Inc, and Adtech Optics Inc. We examine the innovative forces driving market evolution, including advancements in materials science and laser design. The regulatory landscape, potential substitute products, and end-user profiles across diverse sectors (Industrial, Medical, Military & Defense, Telecommunication, Food & Beverage, and Others) are also rigorously analyzed. The report further explores mergers and acquisitions (M&A) activities within the industry, providing insights into deal values and their impact on market dynamics. Data on market share distribution for 2025 indicates a fragmented market, with no single company commanding more than xx% share. M&A activity in the historical period (2019-2024) totalled approximately xx Million, with an average deal value of xx Million.
- Market Concentration: Moderately fragmented.
- Innovation Catalysts: Advancements in materials science, miniaturization technologies.
- Regulatory Landscape: Analysis of relevant regulations and their impact on market growth.
- Substitute Products: Assessment of alternative technologies and their competitive threat.
- End-User Profiles: Detailed analysis of application across various end-user industries.
- M&A Activity: Detailed analysis of completed deals, including deal values and strategic implications.
Quantum Cascade Lasers Industry Industry Evolution
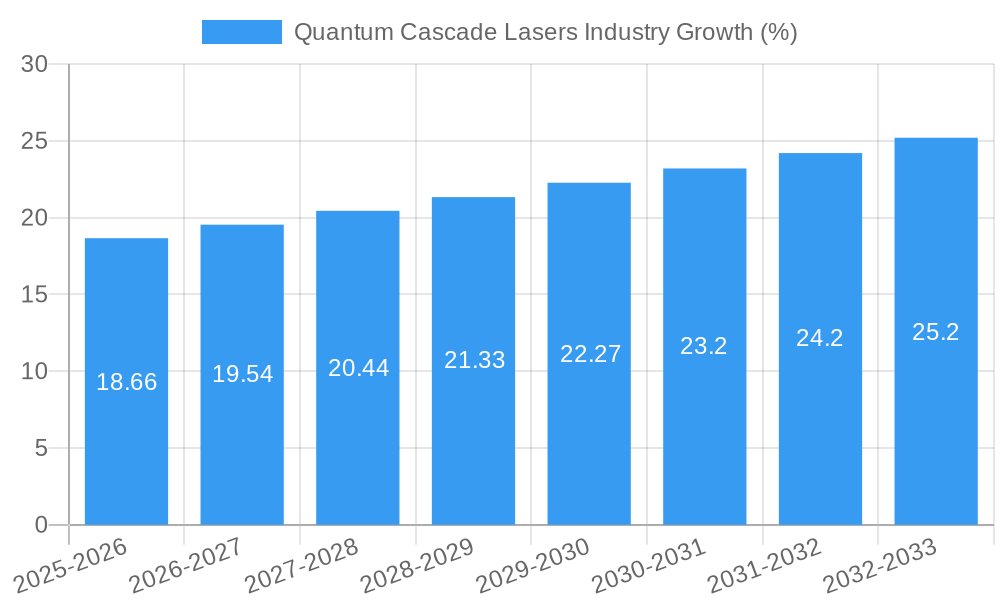
This section provides a comprehensive analysis of the QCL industry's evolutionary trajectory from 2019 to 2033. We examine market growth trajectories, charting Compound Annual Growth Rates (CAGRs) for different segments and analyzing factors influencing market expansion. We detail significant technological advancements in QCL technology, such as improvements in power efficiency, wavelength tunability, and miniaturization. The analysis also considers shifting consumer demands, exploring how evolving applications and technological capabilities shape market trends. Specific data points, such as growth rates for Fabry-Perot lasers (xx% CAGR from 2025-2033) and adoption rates of pulsed wave QCLs in the medical sector (xx% increase from 2025 to 2030), are provided. The analysis will also encompass shifts in demand across various end-user segments driven by factors like increasing automation in industries and growth of specific medical applications.
Leading Regions, Countries, or Segments in Quantum Cascade Lasers Industry
This section identifies the dominant regions, countries, or segments within the QCL market, focusing on By Type (Fabry-Perot, Distributed Feedback, Tunable External Cavity), By Operation (Continuous Wave, Pulsed Wave), and By End-user Industry (Industrial, Medical, Military & Defense, Telecommunication, Food & Beverage, and Others). We pinpoint key drivers behind this dominance, analyzing investment trends, regulatory support, and other factors.
- By Type: Distributed Feedback (DFB) lasers are projected to hold the largest market share by 2033 due to their superior performance characteristics.
- By Operation: Continuous Wave (CW) lasers dominate due to their versatility in various applications.
- By End-user Industry: The Medical and Military & Defence sectors are projected to be the leading end-users due to high demand and technological advancements.
Dominance Factors: The dominance of specific regions/segments is analyzed in detail, focusing on factors like strong government support, presence of major players, and higher adoption rates.
Quantum Cascade Lasers Industry Product Innovations
Recent product innovations in the QCL industry focus on enhancing performance metrics such as power output, wavelength range, and beam quality. New designs incorporating advanced materials and fabrication techniques deliver superior efficiency and extended operational lifetimes. Unique selling propositions include improved thermal management solutions for higher power applications, and advancements in tunability for precision spectroscopy. These innovations are driving expansion into new applications and higher performance requirements within existing sectors.
Propelling Factors for Quantum Cascade Lasers Industry Growth
Several factors are driving the growth of the QCL industry. Technological advancements such as improved efficiency and miniaturization are expanding applications across various sectors. Economic factors, including increasing R&D investments and government incentives, fuel market expansion. Favorable regulatory environments in certain regions further encourage market development. For instance, government investments in quantum technology initiatives like PROQCIMA in France are creating a strong demand for QCL technology.
Obstacles in the Quantum Cascade Lasers Industry Market
Despite the significant growth potential, several obstacles exist. Stringent regulatory requirements, particularly concerning safety and environmental impact, can increase production costs. Supply chain disruptions related to specialized materials can impact production efficiency. Intense competition from established players and emerging technologies poses a significant challenge. These factors can negatively impact market growth and profitability, potentially slowing down the industry's expansion.
Future Opportunities in Quantum Cascade Lasers Industry
The QCL market offers several promising opportunities. Expansion into new markets, such as environmental monitoring and industrial process control, represents substantial growth potential. Development of new applications leveraging improved performance characteristics will open up new avenues. Emerging technologies like quantum sensing and quantum computing create exciting possibilities for future growth, especially given initiatives such as PROQCIMA.
Major Players in the Quantum Cascade Lasers Industry Ecosystem
- Alpes Lasers SA
- Inphenix Inc
- Hamamatsu Photonics KK
- Nanoplus Nanosystems and Technologies GmbH
- Sacher Lasertechnik GmbH
- Leonardo DRS Inc
- Block Engineering Inc
- Mirsense SAS
- Thorlabs Inc
- Adtech Optics Inc
Key Developments in Quantum Cascade Lasers Industry Industry
- October 2023: Nanoplus Nanosystems and Technologies GmbH launched new single-mode continuous-wave QCLs, expanding its portfolio for ultra-sensitive applications.
- March 2024: The French government's PROQCIMA initiative aims to develop universal quantum computers by 2030, potentially boosting demand for QCL technology.
Strategic Quantum Cascade Lasers Industry Market Forecast
The Quantum Cascade Laser industry is poised for substantial growth fueled by continuous technological advancements, expanding applications, and supportive government initiatives. The forecast period (2025-2033) anticipates robust expansion driven by the increasing adoption of QCLs across diverse sectors, primarily medical, military, and industrial applications. The anticipated growth reflects both the inherent capabilities of QCL technology and proactive strategies by key market players to capture emerging opportunities. We anticipate substantial market expansion, achieving xx Million by 2033.
Quantum Cascade Lasers Industry Segmentation
-
1. Type
- 1.1. Fabry-Perot Lasers
- 1.2. Distributed Feedback Lasers
- 1.3. Tunable External Cavity Lasers
-
2. Operation
- 2.1. Continuous Wave
- 2.2. Pulsed Wave
-
3. End-user Industry
- 3.1. Industrial
- 3.2. Medical
- 3.3. Military and Defense
- 3.4. Telecommunication
- 3.5. Food and Beverage
- 3.6. Other End-user Industries
Quantum Cascade Lasers Industry Segmentation By Geography
-
1. North America
- 1.1. United States
- 1.2. Canada
-
2. Europe
- 2.1. United Kingdom
- 2.2. Germany
- 2.3. France
-
3. Asia
- 3.1. China
- 3.2. Japan
- 3.3. South Korea
- 3.4. India
- 4. Australia and New Zealand
- 5. Latin America
- 6. Middle East and Africa
Quantum Cascade Lasers Industry REPORT HIGHLIGHTS
| Aspects | Details |
|---|---|
| Study Period | 2019-2033 |
| Base Year | 2024 |
| Estimated Year | 2025 |
| Forecast Period | 2025-2033 |
| Historical Period | 2019-2024 |
| Growth Rate | CAGR of 4.40% from 2019-2033 |
| Segmentation |
|
Table of Contents
- 1. Introduction
- 1.1. Research Scope
- 1.2. Market Segmentation
- 1.3. Research Methodology
- 1.4. Definitions and Assumptions
- 2. Executive Summary
- 2.1. Introduction
- 3. Market Dynamics
- 3.1. Introduction
- 3.2. Market Drivers
- 3.2.1. Growing Need For Precision in the Medical Activities; Increased Demand of Gas Sensing and Chemical Detection Applications in the Military and Defense
- 3.3. Market Restrains
- 3.3.1. Cost and Absence of Standardization of pH Sensor Devices
- 3.4. Market Trends
- 3.4.1. Industrial End-User Industry to Hold Significant Market Share
- 4. Market Factor Analysis
- 4.1. Porters Five Forces
- 4.2. Supply/Value Chain
- 4.3. PESTEL analysis
- 4.4. Market Entropy
- 4.5. Patent/Trademark Analysis
- 5. Global Quantum Cascade Lasers Industry Analysis, Insights and Forecast, 2019-2031
- 5.1. Market Analysis, Insights and Forecast - by Type
- 5.1.1. Fabry-Perot Lasers
- 5.1.2. Distributed Feedback Lasers
- 5.1.3. Tunable External Cavity Lasers
- 5.2. Market Analysis, Insights and Forecast - by Operation
- 5.2.1. Continuous Wave
- 5.2.2. Pulsed Wave
- 5.3. Market Analysis, Insights and Forecast - by End-user Industry
- 5.3.1. Industrial
- 5.3.2. Medical
- 5.3.3. Military and Defense
- 5.3.4. Telecommunication
- 5.3.5. Food and Beverage
- 5.3.6. Other End-user Industries
- 5.4. Market Analysis, Insights and Forecast - by Region
- 5.4.1. North America
- 5.4.2. Europe
- 5.4.3. Asia
- 5.4.4. Australia and New Zealand
- 5.4.5. Latin America
- 5.4.6. Middle East and Africa
- 5.1. Market Analysis, Insights and Forecast - by Type
- 6. North America Quantum Cascade Lasers Industry Analysis, Insights and Forecast, 2019-2031
- 6.1. Market Analysis, Insights and Forecast - by Type
- 6.1.1. Fabry-Perot Lasers
- 6.1.2. Distributed Feedback Lasers
- 6.1.3. Tunable External Cavity Lasers
- 6.2. Market Analysis, Insights and Forecast - by Operation
- 6.2.1. Continuous Wave
- 6.2.2. Pulsed Wave
- 6.3. Market Analysis, Insights and Forecast - by End-user Industry
- 6.3.1. Industrial
- 6.3.2. Medical
- 6.3.3. Military and Defense
- 6.3.4. Telecommunication
- 6.3.5. Food and Beverage
- 6.3.6. Other End-user Industries
- 6.1. Market Analysis, Insights and Forecast - by Type
- 7. Europe Quantum Cascade Lasers Industry Analysis, Insights and Forecast, 2019-2031
- 7.1. Market Analysis, Insights and Forecast - by Type
- 7.1.1. Fabry-Perot Lasers
- 7.1.2. Distributed Feedback Lasers
- 7.1.3. Tunable External Cavity Lasers
- 7.2. Market Analysis, Insights and Forecast - by Operation
- 7.2.1. Continuous Wave
- 7.2.2. Pulsed Wave
- 7.3. Market Analysis, Insights and Forecast - by End-user Industry
- 7.3.1. Industrial
- 7.3.2. Medical
- 7.3.3. Military and Defense
- 7.3.4. Telecommunication
- 7.3.5. Food and Beverage
- 7.3.6. Other End-user Industries
- 7.1. Market Analysis, Insights and Forecast - by Type
- 8. Asia Quantum Cascade Lasers Industry Analysis, Insights and Forecast, 2019-2031
- 8.1. Market Analysis, Insights and Forecast - by Type
- 8.1.1. Fabry-Perot Lasers
- 8.1.2. Distributed Feedback Lasers
- 8.1.3. Tunable External Cavity Lasers
- 8.2. Market Analysis, Insights and Forecast - by Operation
- 8.2.1. Continuous Wave
- 8.2.2. Pulsed Wave
- 8.3. Market Analysis, Insights and Forecast - by End-user Industry
- 8.3.1. Industrial
- 8.3.2. Medical
- 8.3.3. Military and Defense
- 8.3.4. Telecommunication
- 8.3.5. Food and Beverage
- 8.3.6. Other End-user Industries
- 8.1. Market Analysis, Insights and Forecast - by Type
- 9. Australia and New Zealand Quantum Cascade Lasers Industry Analysis, Insights and Forecast, 2019-2031
- 9.1. Market Analysis, Insights and Forecast - by Type
- 9.1.1. Fabry-Perot Lasers
- 9.1.2. Distributed Feedback Lasers
- 9.1.3. Tunable External Cavity Lasers
- 9.2. Market Analysis, Insights and Forecast - by Operation
- 9.2.1. Continuous Wave
- 9.2.2. Pulsed Wave
- 9.3. Market Analysis, Insights and Forecast - by End-user Industry
- 9.3.1. Industrial
- 9.3.2. Medical
- 9.3.3. Military and Defense
- 9.3.4. Telecommunication
- 9.3.5. Food and Beverage
- 9.3.6. Other End-user Industries
- 9.1. Market Analysis, Insights and Forecast - by Type
- 10. Latin America Quantum Cascade Lasers Industry Analysis, Insights and Forecast, 2019-2031
- 10.1. Market Analysis, Insights and Forecast - by Type
- 10.1.1. Fabry-Perot Lasers
- 10.1.2. Distributed Feedback Lasers
- 10.1.3. Tunable External Cavity Lasers
- 10.2. Market Analysis, Insights and Forecast - by Operation
- 10.2.1. Continuous Wave
- 10.2.2. Pulsed Wave
- 10.3. Market Analysis, Insights and Forecast - by End-user Industry
- 10.3.1. Industrial
- 10.3.2. Medical
- 10.3.3. Military and Defense
- 10.3.4. Telecommunication
- 10.3.5. Food and Beverage
- 10.3.6. Other End-user Industries
- 10.1. Market Analysis, Insights and Forecast - by Type
- 11. Middle East and Africa Quantum Cascade Lasers Industry Analysis, Insights and Forecast, 2019-2031
- 11.1. Market Analysis, Insights and Forecast - by Type
- 11.1.1. Fabry-Perot Lasers
- 11.1.2. Distributed Feedback Lasers
- 11.1.3. Tunable External Cavity Lasers
- 11.2. Market Analysis, Insights and Forecast - by Operation
- 11.2.1. Continuous Wave
- 11.2.2. Pulsed Wave
- 11.3. Market Analysis, Insights and Forecast - by End-user Industry
- 11.3.1. Industrial
- 11.3.2. Medical
- 11.3.3. Military and Defense
- 11.3.4. Telecommunication
- 11.3.5. Food and Beverage
- 11.3.6. Other End-user Industries
- 11.1. Market Analysis, Insights and Forecast - by Type
- 12. North America Quantum Cascade Lasers Industry Analysis, Insights and Forecast, 2019-2031
- 12.1. Market Analysis, Insights and Forecast - By Country/Sub-region
- 12.1.1 United States
- 12.1.2 Canada
- 12.1.3 Mexico
- 13. Europe Quantum Cascade Lasers Industry Analysis, Insights and Forecast, 2019-2031
- 13.1. Market Analysis, Insights and Forecast - By Country/Sub-region
- 13.1.1 Germany
- 13.1.2 United Kingdom
- 13.1.3 France
- 13.1.4 Spain
- 13.1.5 Italy
- 13.1.6 Spain
- 13.1.7 Belgium
- 13.1.8 Netherland
- 13.1.9 Nordics
- 13.1.10 Rest of Europe
- 14. Asia Pacific Quantum Cascade Lasers Industry Analysis, Insights and Forecast, 2019-2031
- 14.1. Market Analysis, Insights and Forecast - By Country/Sub-region
- 14.1.1 China
- 14.1.2 Japan
- 14.1.3 India
- 14.1.4 South Korea
- 14.1.5 Southeast Asia
- 14.1.6 Australia
- 14.1.7 Indonesia
- 14.1.8 Phillipes
- 14.1.9 Singapore
- 14.1.10 Thailandc
- 14.1.11 Rest of Asia Pacific
- 15. South America Quantum Cascade Lasers Industry Analysis, Insights and Forecast, 2019-2031
- 15.1. Market Analysis, Insights and Forecast - By Country/Sub-region
- 15.1.1 Brazil
- 15.1.2 Argentina
- 15.1.3 Peru
- 15.1.4 Chile
- 15.1.5 Colombia
- 15.1.6 Ecuador
- 15.1.7 Venezuela
- 15.1.8 Rest of South America
- 16. North America Quantum Cascade Lasers Industry Analysis, Insights and Forecast, 2019-2031
- 16.1. Market Analysis, Insights and Forecast - By Country/Sub-region
- 16.1.1 United States
- 16.1.2 Canada
- 16.1.3 Mexico
- 17. MEA Quantum Cascade Lasers Industry Analysis, Insights and Forecast, 2019-2031
- 17.1. Market Analysis, Insights and Forecast - By Country/Sub-region
- 17.1.1 United Arab Emirates
- 17.1.2 Saudi Arabia
- 17.1.3 South Africa
- 17.1.4 Rest of Middle East and Africa
- 18. Competitive Analysis
- 18.1. Global Market Share Analysis 2024
- 18.2. Company Profiles
- 18.2.1 Alpes Lasers SA
- 18.2.1.1. Overview
- 18.2.1.2. Products
- 18.2.1.3. SWOT Analysis
- 18.2.1.4. Recent Developments
- 18.2.1.5. Financials (Based on Availability)
- 18.2.2 Inphenix Inc
- 18.2.2.1. Overview
- 18.2.2.2. Products
- 18.2.2.3. SWOT Analysis
- 18.2.2.4. Recent Developments
- 18.2.2.5. Financials (Based on Availability)
- 18.2.3 Hamamatsu Photonics KK
- 18.2.3.1. Overview
- 18.2.3.2. Products
- 18.2.3.3. SWOT Analysis
- 18.2.3.4. Recent Developments
- 18.2.3.5. Financials (Based on Availability)
- 18.2.4 Nanoplus Nanosystems and Technologies GmbH
- 18.2.4.1. Overview
- 18.2.4.2. Products
- 18.2.4.3. SWOT Analysis
- 18.2.4.4. Recent Developments
- 18.2.4.5. Financials (Based on Availability)
- 18.2.5 Sacher Lasertechnik Gmbh
- 18.2.5.1. Overview
- 18.2.5.2. Products
- 18.2.5.3. SWOT Analysis
- 18.2.5.4. Recent Developments
- 18.2.5.5. Financials (Based on Availability)
- 18.2.6 Leonardo Drs Inc
- 18.2.6.1. Overview
- 18.2.6.2. Products
- 18.2.6.3. SWOT Analysis
- 18.2.6.4. Recent Developments
- 18.2.6.5. Financials (Based on Availability)
- 18.2.7 Block Engineering Inc
- 18.2.7.1. Overview
- 18.2.7.2. Products
- 18.2.7.3. SWOT Analysis
- 18.2.7.4. Recent Developments
- 18.2.7.5. Financials (Based on Availability)
- 18.2.8 Mirsense SAS
- 18.2.8.1. Overview
- 18.2.8.2. Products
- 18.2.8.3. SWOT Analysis
- 18.2.8.4. Recent Developments
- 18.2.8.5. Financials (Based on Availability)
- 18.2.9 Thorlabs Inc
- 18.2.9.1. Overview
- 18.2.9.2. Products
- 18.2.9.3. SWOT Analysis
- 18.2.9.4. Recent Developments
- 18.2.9.5. Financials (Based on Availability)
- 18.2.10 Adtech Optics Inc
- 18.2.10.1. Overview
- 18.2.10.2. Products
- 18.2.10.3. SWOT Analysis
- 18.2.10.4. Recent Developments
- 18.2.10.5. Financials (Based on Availability)
- 18.2.1 Alpes Lasers SA
List of Figures
- Figure 1: Global Quantum Cascade Lasers Industry Revenue Breakdown (Million, %) by Region 2024 & 2032
- Figure 2: North America Quantum Cascade Lasers Industry Revenue (Million), by Country 2024 & 2032
- Figure 3: North America Quantum Cascade Lasers Industry Revenue Share (%), by Country 2024 & 2032
- Figure 4: Europe Quantum Cascade Lasers Industry Revenue (Million), by Country 2024 & 2032
- Figure 5: Europe Quantum Cascade Lasers Industry Revenue Share (%), by Country 2024 & 2032
- Figure 6: Asia Pacific Quantum Cascade Lasers Industry Revenue (Million), by Country 2024 & 2032
- Figure 7: Asia Pacific Quantum Cascade Lasers Industry Revenue Share (%), by Country 2024 & 2032
- Figure 8: South America Quantum Cascade Lasers Industry Revenue (Million), by Country 2024 & 2032
- Figure 9: South America Quantum Cascade Lasers Industry Revenue Share (%), by Country 2024 & 2032
- Figure 10: North America Quantum Cascade Lasers Industry Revenue (Million), by Country 2024 & 2032
- Figure 11: North America Quantum Cascade Lasers Industry Revenue Share (%), by Country 2024 & 2032
- Figure 12: MEA Quantum Cascade Lasers Industry Revenue (Million), by Country 2024 & 2032
- Figure 13: MEA Quantum Cascade Lasers Industry Revenue Share (%), by Country 2024 & 2032
- Figure 14: North America Quantum Cascade Lasers Industry Revenue (Million), by Type 2024 & 2032
- Figure 15: North America Quantum Cascade Lasers Industry Revenue Share (%), by Type 2024 & 2032
- Figure 16: North America Quantum Cascade Lasers Industry Revenue (Million), by Operation 2024 & 2032
- Figure 17: North America Quantum Cascade Lasers Industry Revenue Share (%), by Operation 2024 & 2032
- Figure 18: North America Quantum Cascade Lasers Industry Revenue (Million), by End-user Industry 2024 & 2032
- Figure 19: North America Quantum Cascade Lasers Industry Revenue Share (%), by End-user Industry 2024 & 2032
- Figure 20: North America Quantum Cascade Lasers Industry Revenue (Million), by Country 2024 & 2032
- Figure 21: North America Quantum Cascade Lasers Industry Revenue Share (%), by Country 2024 & 2032
- Figure 22: Europe Quantum Cascade Lasers Industry Revenue (Million), by Type 2024 & 2032
- Figure 23: Europe Quantum Cascade Lasers Industry Revenue Share (%), by Type 2024 & 2032
- Figure 24: Europe Quantum Cascade Lasers Industry Revenue (Million), by Operation 2024 & 2032
- Figure 25: Europe Quantum Cascade Lasers Industry Revenue Share (%), by Operation 2024 & 2032
- Figure 26: Europe Quantum Cascade Lasers Industry Revenue (Million), by End-user Industry 2024 & 2032
- Figure 27: Europe Quantum Cascade Lasers Industry Revenue Share (%), by End-user Industry 2024 & 2032
- Figure 28: Europe Quantum Cascade Lasers Industry Revenue (Million), by Country 2024 & 2032
- Figure 29: Europe Quantum Cascade Lasers Industry Revenue Share (%), by Country 2024 & 2032
- Figure 30: Asia Quantum Cascade Lasers Industry Revenue (Million), by Type 2024 & 2032
- Figure 31: Asia Quantum Cascade Lasers Industry Revenue Share (%), by Type 2024 & 2032
- Figure 32: Asia Quantum Cascade Lasers Industry Revenue (Million), by Operation 2024 & 2032
- Figure 33: Asia Quantum Cascade Lasers Industry Revenue Share (%), by Operation 2024 & 2032
- Figure 34: Asia Quantum Cascade Lasers Industry Revenue (Million), by End-user Industry 2024 & 2032
- Figure 35: Asia Quantum Cascade Lasers Industry Revenue Share (%), by End-user Industry 2024 & 2032
- Figure 36: Asia Quantum Cascade Lasers Industry Revenue (Million), by Country 2024 & 2032
- Figure 37: Asia Quantum Cascade Lasers Industry Revenue Share (%), by Country 2024 & 2032
- Figure 38: Australia and New Zealand Quantum Cascade Lasers Industry Revenue (Million), by Type 2024 & 2032
- Figure 39: Australia and New Zealand Quantum Cascade Lasers Industry Revenue Share (%), by Type 2024 & 2032
- Figure 40: Australia and New Zealand Quantum Cascade Lasers Industry Revenue (Million), by Operation 2024 & 2032
- Figure 41: Australia and New Zealand Quantum Cascade Lasers Industry Revenue Share (%), by Operation 2024 & 2032
- Figure 42: Australia and New Zealand Quantum Cascade Lasers Industry Revenue (Million), by End-user Industry 2024 & 2032
- Figure 43: Australia and New Zealand Quantum Cascade Lasers Industry Revenue Share (%), by End-user Industry 2024 & 2032
- Figure 44: Australia and New Zealand Quantum Cascade Lasers Industry Revenue (Million), by Country 2024 & 2032
- Figure 45: Australia and New Zealand Quantum Cascade Lasers Industry Revenue Share (%), by Country 2024 & 2032
- Figure 46: Latin America Quantum Cascade Lasers Industry Revenue (Million), by Type 2024 & 2032
- Figure 47: Latin America Quantum Cascade Lasers Industry Revenue Share (%), by Type 2024 & 2032
- Figure 48: Latin America Quantum Cascade Lasers Industry Revenue (Million), by Operation 2024 & 2032
- Figure 49: Latin America Quantum Cascade Lasers Industry Revenue Share (%), by Operation 2024 & 2032
- Figure 50: Latin America Quantum Cascade Lasers Industry Revenue (Million), by End-user Industry 2024 & 2032
- Figure 51: Latin America Quantum Cascade Lasers Industry Revenue Share (%), by End-user Industry 2024 & 2032
- Figure 52: Latin America Quantum Cascade Lasers Industry Revenue (Million), by Country 2024 & 2032
- Figure 53: Latin America Quantum Cascade Lasers Industry Revenue Share (%), by Country 2024 & 2032
- Figure 54: Middle East and Africa Quantum Cascade Lasers Industry Revenue (Million), by Type 2024 & 2032
- Figure 55: Middle East and Africa Quantum Cascade Lasers Industry Revenue Share (%), by Type 2024 & 2032
- Figure 56: Middle East and Africa Quantum Cascade Lasers Industry Revenue (Million), by Operation 2024 & 2032
- Figure 57: Middle East and Africa Quantum Cascade Lasers Industry Revenue Share (%), by Operation 2024 & 2032
- Figure 58: Middle East and Africa Quantum Cascade Lasers Industry Revenue (Million), by End-user Industry 2024 & 2032
- Figure 59: Middle East and Africa Quantum Cascade Lasers Industry Revenue Share (%), by End-user Industry 2024 & 2032
- Figure 60: Middle East and Africa Quantum Cascade Lasers Industry Revenue (Million), by Country 2024 & 2032
- Figure 61: Middle East and Africa Quantum Cascade Lasers Industry Revenue Share (%), by Country 2024 & 2032
List of Tables
- Table 1: Global Quantum Cascade Lasers Industry Revenue Million Forecast, by Region 2019 & 2032
- Table 2: Global Quantum Cascade Lasers Industry Revenue Million Forecast, by Type 2019 & 2032
- Table 3: Global Quantum Cascade Lasers Industry Revenue Million Forecast, by Operation 2019 & 2032
- Table 4: Global Quantum Cascade Lasers Industry Revenue Million Forecast, by End-user Industry 2019 & 2032
- Table 5: Global Quantum Cascade Lasers Industry Revenue Million Forecast, by Region 2019 & 2032
- Table 6: Global Quantum Cascade Lasers Industry Revenue Million Forecast, by Country 2019 & 2032
- Table 7: United States Quantum Cascade Lasers Industry Revenue (Million) Forecast, by Application 2019 & 2032
- Table 8: Canada Quantum Cascade Lasers Industry Revenue (Million) Forecast, by Application 2019 & 2032
- Table 9: Mexico Quantum Cascade Lasers Industry Revenue (Million) Forecast, by Application 2019 & 2032
- Table 10: Global Quantum Cascade Lasers Industry Revenue Million Forecast, by Country 2019 & 2032
- Table 11: Germany Quantum Cascade Lasers Industry Revenue (Million) Forecast, by Application 2019 & 2032
- Table 12: United Kingdom Quantum Cascade Lasers Industry Revenue (Million) Forecast, by Application 2019 & 2032
- Table 13: France Quantum Cascade Lasers Industry Revenue (Million) Forecast, by Application 2019 & 2032
- Table 14: Spain Quantum Cascade Lasers Industry Revenue (Million) Forecast, by Application 2019 & 2032
- Table 15: Italy Quantum Cascade Lasers Industry Revenue (Million) Forecast, by Application 2019 & 2032
- Table 16: Spain Quantum Cascade Lasers Industry Revenue (Million) Forecast, by Application 2019 & 2032
- Table 17: Belgium Quantum Cascade Lasers Industry Revenue (Million) Forecast, by Application 2019 & 2032
- Table 18: Netherland Quantum Cascade Lasers Industry Revenue (Million) Forecast, by Application 2019 & 2032
- Table 19: Nordics Quantum Cascade Lasers Industry Revenue (Million) Forecast, by Application 2019 & 2032
- Table 20: Rest of Europe Quantum Cascade Lasers Industry Revenue (Million) Forecast, by Application 2019 & 2032
- Table 21: Global Quantum Cascade Lasers Industry Revenue Million Forecast, by Country 2019 & 2032
- Table 22: China Quantum Cascade Lasers Industry Revenue (Million) Forecast, by Application 2019 & 2032
- Table 23: Japan Quantum Cascade Lasers Industry Revenue (Million) Forecast, by Application 2019 & 2032
- Table 24: India Quantum Cascade Lasers Industry Revenue (Million) Forecast, by Application 2019 & 2032
- Table 25: South Korea Quantum Cascade Lasers Industry Revenue (Million) Forecast, by Application 2019 & 2032
- Table 26: Southeast Asia Quantum Cascade Lasers Industry Revenue (Million) Forecast, by Application 2019 & 2032
- Table 27: Australia Quantum Cascade Lasers Industry Revenue (Million) Forecast, by Application 2019 & 2032
- Table 28: Indonesia Quantum Cascade Lasers Industry Revenue (Million) Forecast, by Application 2019 & 2032
- Table 29: Phillipes Quantum Cascade Lasers Industry Revenue (Million) Forecast, by Application 2019 & 2032
- Table 30: Singapore Quantum Cascade Lasers Industry Revenue (Million) Forecast, by Application 2019 & 2032
- Table 31: Thailandc Quantum Cascade Lasers Industry Revenue (Million) Forecast, by Application 2019 & 2032
- Table 32: Rest of Asia Pacific Quantum Cascade Lasers Industry Revenue (Million) Forecast, by Application 2019 & 2032
- Table 33: Global Quantum Cascade Lasers Industry Revenue Million Forecast, by Country 2019 & 2032
- Table 34: Brazil Quantum Cascade Lasers Industry Revenue (Million) Forecast, by Application 2019 & 2032
- Table 35: Argentina Quantum Cascade Lasers Industry Revenue (Million) Forecast, by Application 2019 & 2032
- Table 36: Peru Quantum Cascade Lasers Industry Revenue (Million) Forecast, by Application 2019 & 2032
- Table 37: Chile Quantum Cascade Lasers Industry Revenue (Million) Forecast, by Application 2019 & 2032
- Table 38: Colombia Quantum Cascade Lasers Industry Revenue (Million) Forecast, by Application 2019 & 2032
- Table 39: Ecuador Quantum Cascade Lasers Industry Revenue (Million) Forecast, by Application 2019 & 2032
- Table 40: Venezuela Quantum Cascade Lasers Industry Revenue (Million) Forecast, by Application 2019 & 2032
- Table 41: Rest of South America Quantum Cascade Lasers Industry Revenue (Million) Forecast, by Application 2019 & 2032
- Table 42: Global Quantum Cascade Lasers Industry Revenue Million Forecast, by Country 2019 & 2032
- Table 43: United States Quantum Cascade Lasers Industry Revenue (Million) Forecast, by Application 2019 & 2032
- Table 44: Canada Quantum Cascade Lasers Industry Revenue (Million) Forecast, by Application 2019 & 2032
- Table 45: Mexico Quantum Cascade Lasers Industry Revenue (Million) Forecast, by Application 2019 & 2032
- Table 46: Global Quantum Cascade Lasers Industry Revenue Million Forecast, by Country 2019 & 2032
- Table 47: United Arab Emirates Quantum Cascade Lasers Industry Revenue (Million) Forecast, by Application 2019 & 2032
- Table 48: Saudi Arabia Quantum Cascade Lasers Industry Revenue (Million) Forecast, by Application 2019 & 2032
- Table 49: South Africa Quantum Cascade Lasers Industry Revenue (Million) Forecast, by Application 2019 & 2032
- Table 50: Rest of Middle East and Africa Quantum Cascade Lasers Industry Revenue (Million) Forecast, by Application 2019 & 2032
- Table 51: Global Quantum Cascade Lasers Industry Revenue Million Forecast, by Type 2019 & 2032
- Table 52: Global Quantum Cascade Lasers Industry Revenue Million Forecast, by Operation 2019 & 2032
- Table 53: Global Quantum Cascade Lasers Industry Revenue Million Forecast, by End-user Industry 2019 & 2032
- Table 54: Global Quantum Cascade Lasers Industry Revenue Million Forecast, by Country 2019 & 2032
- Table 55: United States Quantum Cascade Lasers Industry Revenue (Million) Forecast, by Application 2019 & 2032
- Table 56: Canada Quantum Cascade Lasers Industry Revenue (Million) Forecast, by Application 2019 & 2032
- Table 57: Global Quantum Cascade Lasers Industry Revenue Million Forecast, by Type 2019 & 2032
- Table 58: Global Quantum Cascade Lasers Industry Revenue Million Forecast, by Operation 2019 & 2032
- Table 59: Global Quantum Cascade Lasers Industry Revenue Million Forecast, by End-user Industry 2019 & 2032
- Table 60: Global Quantum Cascade Lasers Industry Revenue Million Forecast, by Country 2019 & 2032
- Table 61: United Kingdom Quantum Cascade Lasers Industry Revenue (Million) Forecast, by Application 2019 & 2032
- Table 62: Germany Quantum Cascade Lasers Industry Revenue (Million) Forecast, by Application 2019 & 2032
- Table 63: France Quantum Cascade Lasers Industry Revenue (Million) Forecast, by Application 2019 & 2032
- Table 64: Global Quantum Cascade Lasers Industry Revenue Million Forecast, by Type 2019 & 2032
- Table 65: Global Quantum Cascade Lasers Industry Revenue Million Forecast, by Operation 2019 & 2032
- Table 66: Global Quantum Cascade Lasers Industry Revenue Million Forecast, by End-user Industry 2019 & 2032
- Table 67: Global Quantum Cascade Lasers Industry Revenue Million Forecast, by Country 2019 & 2032
- Table 68: China Quantum Cascade Lasers Industry Revenue (Million) Forecast, by Application 2019 & 2032
- Table 69: Japan Quantum Cascade Lasers Industry Revenue (Million) Forecast, by Application 2019 & 2032
- Table 70: South Korea Quantum Cascade Lasers Industry Revenue (Million) Forecast, by Application 2019 & 2032
- Table 71: India Quantum Cascade Lasers Industry Revenue (Million) Forecast, by Application 2019 & 2032
- Table 72: Global Quantum Cascade Lasers Industry Revenue Million Forecast, by Type 2019 & 2032
- Table 73: Global Quantum Cascade Lasers Industry Revenue Million Forecast, by Operation 2019 & 2032
- Table 74: Global Quantum Cascade Lasers Industry Revenue Million Forecast, by End-user Industry 2019 & 2032
- Table 75: Global Quantum Cascade Lasers Industry Revenue Million Forecast, by Country 2019 & 2032
- Table 76: Global Quantum Cascade Lasers Industry Revenue Million Forecast, by Type 2019 & 2032
- Table 77: Global Quantum Cascade Lasers Industry Revenue Million Forecast, by Operation 2019 & 2032
- Table 78: Global Quantum Cascade Lasers Industry Revenue Million Forecast, by End-user Industry 2019 & 2032
- Table 79: Global Quantum Cascade Lasers Industry Revenue Million Forecast, by Country 2019 & 2032
- Table 80: Global Quantum Cascade Lasers Industry Revenue Million Forecast, by Type 2019 & 2032
- Table 81: Global Quantum Cascade Lasers Industry Revenue Million Forecast, by Operation 2019 & 2032
- Table 82: Global Quantum Cascade Lasers Industry Revenue Million Forecast, by End-user Industry 2019 & 2032
- Table 83: Global Quantum Cascade Lasers Industry Revenue Million Forecast, by Country 2019 & 2032
Frequently Asked Questions
1. What is the projected Compound Annual Growth Rate (CAGR) of the Quantum Cascade Lasers Industry?
The projected CAGR is approximately 4.40%.
2. Which companies are prominent players in the Quantum Cascade Lasers Industry?
Key companies in the market include Alpes Lasers SA, Inphenix Inc, Hamamatsu Photonics KK, Nanoplus Nanosystems and Technologies GmbH, Sacher Lasertechnik Gmbh, Leonardo Drs Inc, Block Engineering Inc, Mirsense SAS, Thorlabs Inc, Adtech Optics Inc.
3. What are the main segments of the Quantum Cascade Lasers Industry?
The market segments include Type, Operation, End-user Industry.
4. Can you provide details about the market size?
The market size is estimated to be USD 415.36 Million as of 2022.
5. What are some drivers contributing to market growth?
Growing Need For Precision in the Medical Activities; Increased Demand of Gas Sensing and Chemical Detection Applications in the Military and Defense.
6. What are the notable trends driving market growth?
Industrial End-User Industry to Hold Significant Market Share.
7. Are there any restraints impacting market growth?
Cost and Absence of Standardization of pH Sensor Devices.
8. Can you provide examples of recent developments in the market?
March 2024 - The members of the French quantum ecosystem reviewed the results of the national quantum strategy three years after its launch by President Emmanuel Macron. They also announced the launch of PROQCIMA, which aims to have two prototypes of universal quantum computers of French design by 2030. The plan is structured around strategic objectives that include the development of quantum computing, quantum sensing, quantum cryptography, and quantum communication strategies. Such initiatives may create a demand for QCL technology in the forecasted period.
9. What pricing options are available for accessing the report?
Pricing options include single-user, multi-user, and enterprise licenses priced at USD 4750, USD 5250, and USD 8750 respectively.
10. Is the market size provided in terms of value or volume?
The market size is provided in terms of value, measured in Million.
11. Are there any specific market keywords associated with the report?
Yes, the market keyword associated with the report is "Quantum Cascade Lasers Industry," which aids in identifying and referencing the specific market segment covered.
12. How do I determine which pricing option suits my needs best?
The pricing options vary based on user requirements and access needs. Individual users may opt for single-user licenses, while businesses requiring broader access may choose multi-user or enterprise licenses for cost-effective access to the report.
13. Are there any additional resources or data provided in the Quantum Cascade Lasers Industry report?
While the report offers comprehensive insights, it's advisable to review the specific contents or supplementary materials provided to ascertain if additional resources or data are available.
14. How can I stay updated on further developments or reports in the Quantum Cascade Lasers Industry?
To stay informed about further developments, trends, and reports in the Quantum Cascade Lasers Industry, consider subscribing to industry newsletters, following relevant companies and organizations, or regularly checking reputable industry news sources and publications.
Methodology
Step 1 - Identification of Relevant Samples Size from Population Database


Step 2 - Approaches for Defining Global Market Size (Value, Volume* & Price*)

Note*: In applicable scenarios
Step 3 - Data Sources
Primary Research
- Web Analytics
- Survey Reports
- Research Institute
- Latest Research Reports
- Opinion Leaders
Secondary Research
- Annual Reports
- White Paper
- Latest Press Release
- Industry Association
- Paid Database
- Investor Presentations

Step 4 - Data Triangulation
Involves using different sources of information in order to increase the validity of a study
These sources are likely to be stakeholders in a program - participants, other researchers, program staff, other community members, and so on.
Then we put all data in single framework & apply various statistical tools to find out the dynamic on the market.
During the analysis stage, feedback from the stakeholder groups would be compared to determine areas of agreement as well as areas of divergence
