

Key Insights
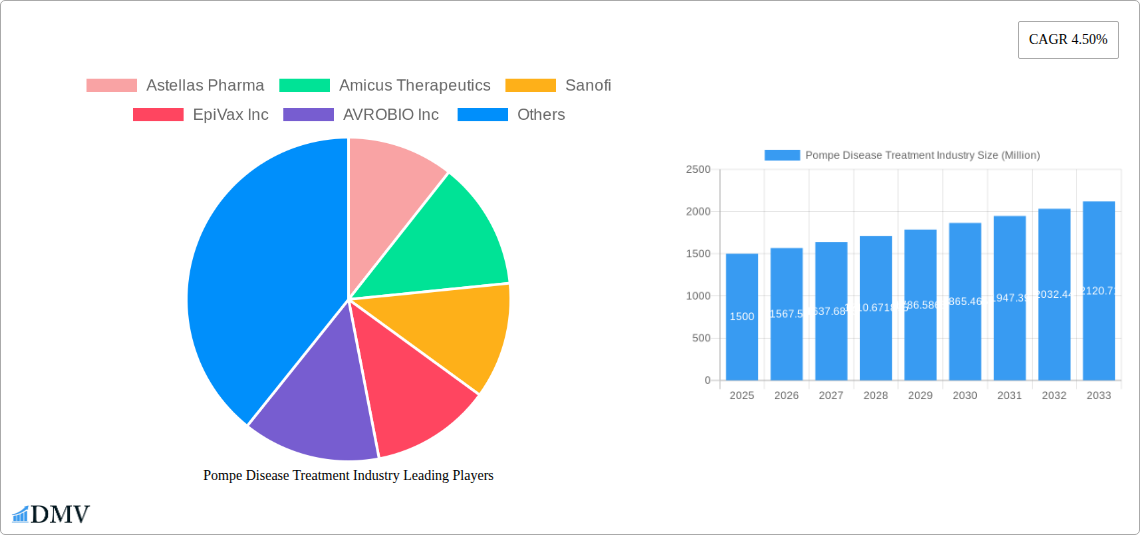
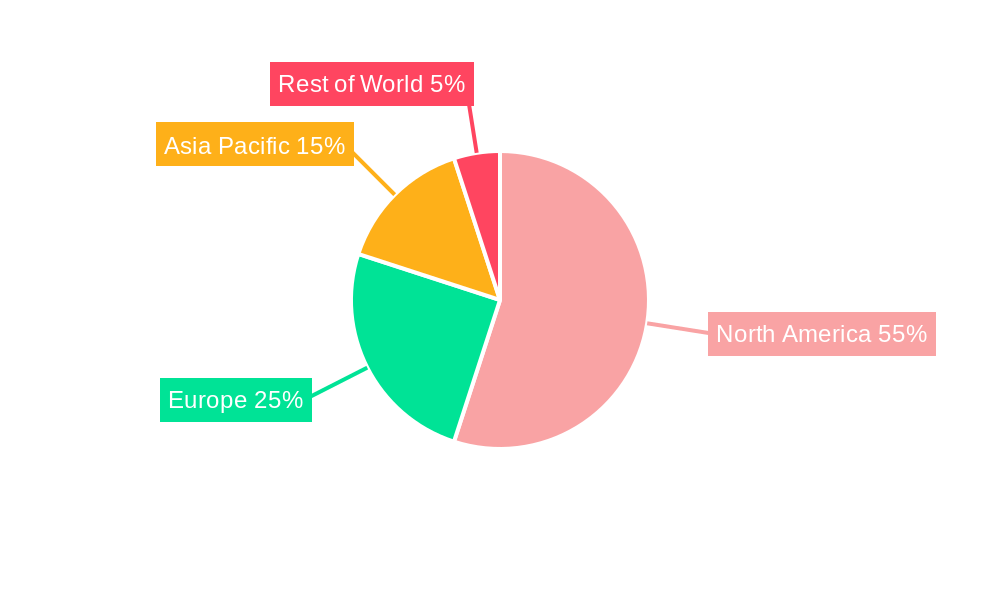
The Pompe Disease Treatment market, valued at approximately $1.5 billion in 2025, is projected to experience robust growth, exhibiting a compound annual growth rate (CAGR) of 4.50% from 2025 to 2033. This expansion is driven by several key factors. The rising prevalence of Pompe disease globally, coupled with an aging population susceptible to the condition, fuels increased demand for effective therapies. Furthermore, continuous advancements in treatment modalities, including the development of more effective and tolerable enzyme replacement therapies (ERT) and substrate reduction therapies (SRT), are significantly contributing to market growth. Increased research and development efforts focused on gene therapy and other novel approaches also promise to further enhance treatment options and improve patient outcomes, thus boosting market expansion. The market is segmented by route of administration (oral and parenteral), treatment type (ERT and SRT), and end-user (hospitals, ambulatory surgical centers, and others). While the parenteral route currently dominates, oral therapies are gaining traction, fueled by improved patient convenience and compliance. The North American region currently holds the largest market share, due to higher healthcare spending and greater disease awareness. However, emerging markets in Asia-Pacific and other regions are anticipated to show significant growth potential in the coming years, driven by increased healthcare infrastructure development and rising disposable incomes. Market restraints include the high cost of therapies, limited access to treatment in certain regions, and potential side effects associated with current treatments. Despite these challenges, the overall outlook for the Pompe Disease Treatment market remains positive, driven by continuous innovation and unmet medical needs.
The competitive landscape is characterized by a mix of established pharmaceutical companies and emerging biotech firms. Key players like Astellas Pharma, Amicus Therapeutics, Sanofi, and others are actively engaged in developing and marketing Pompe disease treatments. The competitive intensity is expected to intensify further as new therapies enter the market and companies strive to maintain their market share through strategic partnerships, acquisitions, and clinical trials. Future market success will hinge on companies' ability to innovate, offer cost-effective treatments, and effectively address patient access challenges in different geographical regions. The focus will likely shift towards personalized medicine approaches, incorporating genetic factors to optimize treatment strategies and improve patient outcomes. This personalized approach will further contribute to the market's continued growth and expansion.
Pompe Disease Treatment Industry Market Report: 2019-2033
This comprehensive report provides a detailed analysis of the Pompe Disease Treatment industry, encompassing market size, growth drivers, competitive landscape, and future outlook. The study period covers 2019-2033, with 2025 as the base and estimated year, and a forecast period of 2025-2033. The report offers invaluable insights for stakeholders, including pharmaceutical companies, investors, and healthcare professionals. The global Pompe Disease Treatment market is projected to reach xx Million by 2033.
Pompe Disease Treatment Industry Market Composition & Trends
The Pompe Disease Treatment market is characterized by a moderately concentrated landscape, with key players like Astellas Pharma, Amicus Therapeutics, and Sanofi holding significant market share. However, the emergence of smaller biotech companies focusing on innovative therapies, such as Substrate Reduction Therapy (SRT) and novel Enzyme Replacement Therapies (ERTs), is increasing competition and driving innovation. The regulatory landscape, particularly concerning the approval of orphan drugs, plays a crucial role in market dynamics. While Enzyme Replacement Therapy (ERT) currently dominates, the potential of SRT and other emerging treatment types is a significant factor influencing future market growth. Mergers and acquisitions (M&A) activities have been relatively moderate, with deal values ranging from xx Million to xx Million in recent years, primarily driven by strategic expansion into this niche therapeutic area.
- Market Concentration: Moderately concentrated, with top 3 players holding approximately xx% market share in 2024.
- Innovation Catalysts: Development of SRT and next-generation ERTs.
- Regulatory Landscape: Stringent approval processes for orphan drugs, influencing market entry.
- Substitute Products: Limited viable substitutes currently available.
- End-User Profiles: Hospitals and Ambulatory Surgical Centers are primary end-users.
- M&A Activities: Moderate activity, focused on strategic expansion and technology acquisition. Average deal value: xx Million.
Pompe Disease Treatment Industry Industry Evolution
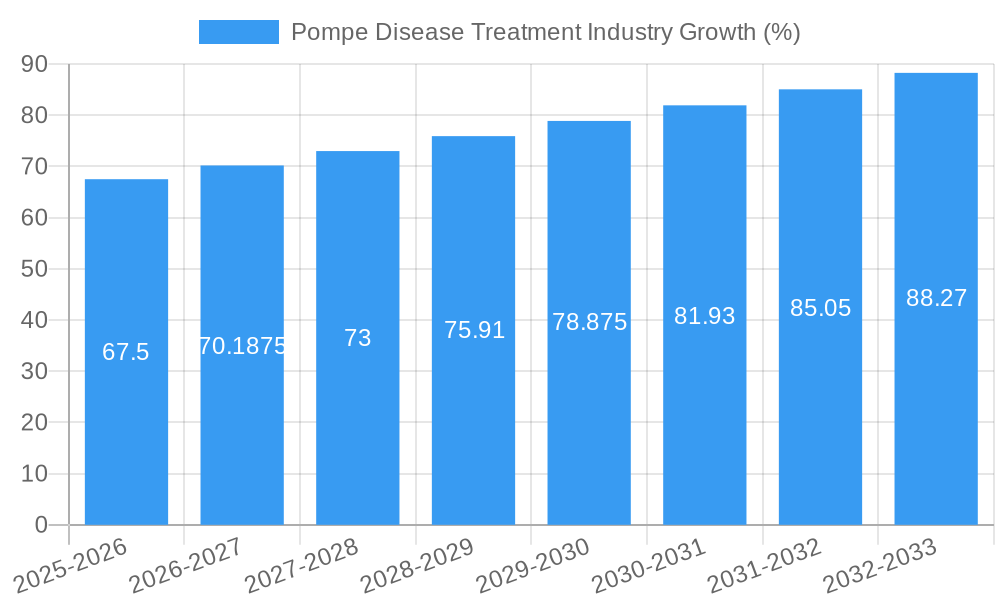
The Pompe Disease Treatment market has witnessed substantial evolution, driven primarily by advancements in ERT and the emergence of SRT. From 2019 to 2024, the market experienced a Compound Annual Growth Rate (CAGR) of approximately xx%, fueled by increasing awareness of Pompe disease, improved diagnostic capabilities, and the launch of newer, more effective therapies. The shift towards personalized medicine and the growing focus on improving patient outcomes are significant factors. Technological advancements, such as targeted drug delivery systems and improved manufacturing processes for enzyme replacement therapy, have enhanced treatment efficacy and patient compliance. Furthermore, changing consumer demands, with an increased emphasis on less invasive treatment options and improved quality of life, are shaping future market trends. The market is anticipated to maintain a healthy growth trajectory in the forecast period (2025-2033) with a projected CAGR of xx%.
Leading Regions, Countries, or Segments in Pompe Disease Treatment Industry
Dominant Region: North America currently holds the largest market share due to high healthcare expenditure, well-established healthcare infrastructure, and a relatively high prevalence of Pompe disease. Europe follows closely, with significant growth potential in emerging markets.
Dominant End-User: Hospitals are the dominant end-users, owing to their infrastructure and expertise in managing complex treatments.
Dominant Route of Administration: Parenteral administration (IV infusions) currently dominates due to the nature of ERT.
Dominant Treatment Type: Enzyme Replacement Therapy (ERT) holds the largest market share due to its established efficacy.
Key Drivers:
- North America: High healthcare expenditure, advanced healthcare infrastructure, and strong regulatory support.
- Europe: Growing awareness of Pompe disease, increasing investments in healthcare R&D, and expanding access to advanced therapies.
- ERT: Established efficacy and widespread adoption.
- Hospitals: Expertise in managing complex treatments and well-established infrastructure.
Pompe Disease Treatment Industry Product Innovations
Recent years have witnessed significant product innovation in the Pompe Disease Treatment space, focusing on improving efficacy, reducing side effects, and broadening treatment options. Novel ERT formulations with enhanced stability and targeted delivery systems are emerging, alongside the exciting development of SRTs offering alternative approaches to managing the disease. These advancements represent significant improvements over earlier generations of ERTs, resulting in better patient outcomes and reduced treatment burden.
Propelling Factors for Pompe Disease Treatment Industry Growth
Several factors contribute to the growth of the Pompe Disease Treatment market: increasing prevalence of Pompe disease globally, continuous technological advancements resulting in more effective therapies, supportive government initiatives and regulatory approvals of new treatments, and rising healthcare expenditure, particularly in developed nations. The expansion of diagnostic capabilities and enhanced awareness campaigns also play significant roles in increasing market growth.
Obstacles in the Pompe Disease Treatment Industry Market
Challenges include the high cost of treatment, limiting accessibility for many patients, especially in lower-income countries. The complexity of manufacturing and delivering ERTs can lead to supply chain disruptions. Furthermore, the competitive landscape with emerging therapies necessitates ongoing innovation to maintain a market advantage. Regulatory hurdles and lengthy approval processes can also slow down market penetration.
Future Opportunities in Pompe Disease Treatment Industry
Future opportunities lie in the development of more efficient and accessible SRTs, gene therapy, and improved diagnostic tools. Expansion into emerging markets with significant unmet medical needs and the development of personalized therapies that target specific patient subgroups offer further growth potential.
Major Players in the Pompe Disease Treatment Industry Ecosystem
- Astellas Pharma
- Amicus Therapeutics
- Sanofi
- EpiVax Inc
- AVROBIO Inc
- Genethon
- Oxyrane
Key Developments in Pompe Disease Treatment Industry Industry
- June 2022: The European Commission granted marketing authorization for Nexvia Dyme (alglucosidase alfa), expanding treatment options for both late-onset and infantile-onset Pompe disease and significantly impacting market dynamics.
- February 2022: Maze Therapeutics' preclinical data on MZE001 showcased a novel approach to treating Pompe disease, potentially paving the way for new therapeutic strategies.
Strategic Pompe Disease Treatment Industry Market Forecast
The Pompe Disease Treatment market is poised for robust growth driven by continued innovation in therapies, increasing awareness and diagnosis, and expanding access to treatment, especially in developing nations. The market is expected to witness significant expansion in the forecast period due to the introduction of novel therapies and a growing demand for better treatment options. The focus on improving patient outcomes and streamlining treatment processes will also contribute to positive growth momentum in the coming years.
Pompe Disease Treatment Industry Segmentation
-
1. Route of Administration
- 1.1. Oral
- 1.2. Parenteral
-
2. Treatment Type
- 2.1. Substrate Reduction Therapy (SRT)
- 2.2. Enzyme Replacement Therapy (ERT)
- 2.3. Other Treatment Types
-
3. End-User
- 3.1. Hospitals
- 3.2. Ambulatory Surgical Centers
- 3.3. Other End-Users
Pompe Disease Treatment Industry Segmentation By Geography
-
1. North America
- 1.1. United States
- 1.2. Canada
- 1.3. Mexico
-
2. Europe
- 2.1. Germany
- 2.2. United Kingdom
- 2.3. France
- 2.4. Italy
- 2.5. Spain
- 2.6. Rest of Europe
-
3. Asia Pacific
- 3.1. China
- 3.2. Japan
- 3.3. India
- 3.4. Australia
- 3.5. South Korea
- 3.6. Rest of Asia Pacific
-
4. Middle East and Africa
- 4.1. GCC
- 4.2. South Africa
- 4.3. Rest of Middle East and Africa
-
5. South America
- 5.1. Brazil
- 5.2. Argentina
- 5.3. Rest of South America
Pompe Disease Treatment Industry REPORT HIGHLIGHTS
| Aspects | Details |
|---|---|
| Study Period | 2019-2033 |
| Base Year | 2024 |
| Estimated Year | 2025 |
| Forecast Period | 2025-2033 |
| Historical Period | 2019-2024 |
| Growth Rate | CAGR of 4.50% from 2019-2033 |
| Segmentation |
|
Table of Contents
- 1. Introduction
- 1.1. Research Scope
- 1.2. Market Segmentation
- 1.3. Research Methodology
- 1.4. Definitions and Assumptions
- 2. Executive Summary
- 2.1. Introduction
- 3. Market Dynamics
- 3.1. Introduction
- 3.2. Market Drivers
- 3.2.1. Launch of Novel Drugs; Continued Uptake of Long Term Therapies
- 3.3. Market Restrains
- 3.3.1. High Treatment Cost
- 3.4. Market Trends
- 3.4.1. Enzyme Replacement Therapy (ERT) Segment is Estimated to Witness a Considerable Growth Over the Forecast Period
- 4. Market Factor Analysis
- 4.1. Porters Five Forces
- 4.2. Supply/Value Chain
- 4.3. PESTEL analysis
- 4.4. Market Entropy
- 4.5. Patent/Trademark Analysis
- 5. Global Pompe Disease Treatment Industry Analysis, Insights and Forecast, 2019-2031
- 5.1. Market Analysis, Insights and Forecast - by Route of Administration
- 5.1.1. Oral
- 5.1.2. Parenteral
- 5.2. Market Analysis, Insights and Forecast - by Treatment Type
- 5.2.1. Substrate Reduction Therapy (SRT)
- 5.2.2. Enzyme Replacement Therapy (ERT)
- 5.2.3. Other Treatment Types
- 5.3. Market Analysis, Insights and Forecast - by End-User
- 5.3.1. Hospitals
- 5.3.2. Ambulatory Surgical Centers
- 5.3.3. Other End-Users
- 5.4. Market Analysis, Insights and Forecast - by Region
- 5.4.1. North America
- 5.4.2. Europe
- 5.4.3. Asia Pacific
- 5.4.4. Middle East and Africa
- 5.4.5. South America
- 5.1. Market Analysis, Insights and Forecast - by Route of Administration
- 6. North America Pompe Disease Treatment Industry Analysis, Insights and Forecast, 2019-2031
- 6.1. Market Analysis, Insights and Forecast - by Route of Administration
- 6.1.1. Oral
- 6.1.2. Parenteral
- 6.2. Market Analysis, Insights and Forecast - by Treatment Type
- 6.2.1. Substrate Reduction Therapy (SRT)
- 6.2.2. Enzyme Replacement Therapy (ERT)
- 6.2.3. Other Treatment Types
- 6.3. Market Analysis, Insights and Forecast - by End-User
- 6.3.1. Hospitals
- 6.3.2. Ambulatory Surgical Centers
- 6.3.3. Other End-Users
- 6.1. Market Analysis, Insights and Forecast - by Route of Administration
- 7. Europe Pompe Disease Treatment Industry Analysis, Insights and Forecast, 2019-2031
- 7.1. Market Analysis, Insights and Forecast - by Route of Administration
- 7.1.1. Oral
- 7.1.2. Parenteral
- 7.2. Market Analysis, Insights and Forecast - by Treatment Type
- 7.2.1. Substrate Reduction Therapy (SRT)
- 7.2.2. Enzyme Replacement Therapy (ERT)
- 7.2.3. Other Treatment Types
- 7.3. Market Analysis, Insights and Forecast - by End-User
- 7.3.1. Hospitals
- 7.3.2. Ambulatory Surgical Centers
- 7.3.3. Other End-Users
- 7.1. Market Analysis, Insights and Forecast - by Route of Administration
- 8. Asia Pacific Pompe Disease Treatment Industry Analysis, Insights and Forecast, 2019-2031
- 8.1. Market Analysis, Insights and Forecast - by Route of Administration
- 8.1.1. Oral
- 8.1.2. Parenteral
- 8.2. Market Analysis, Insights and Forecast - by Treatment Type
- 8.2.1. Substrate Reduction Therapy (SRT)
- 8.2.2. Enzyme Replacement Therapy (ERT)
- 8.2.3. Other Treatment Types
- 8.3. Market Analysis, Insights and Forecast - by End-User
- 8.3.1. Hospitals
- 8.3.2. Ambulatory Surgical Centers
- 8.3.3. Other End-Users
- 8.1. Market Analysis, Insights and Forecast - by Route of Administration
- 9. Middle East and Africa Pompe Disease Treatment Industry Analysis, Insights and Forecast, 2019-2031
- 9.1. Market Analysis, Insights and Forecast - by Route of Administration
- 9.1.1. Oral
- 9.1.2. Parenteral
- 9.2. Market Analysis, Insights and Forecast - by Treatment Type
- 9.2.1. Substrate Reduction Therapy (SRT)
- 9.2.2. Enzyme Replacement Therapy (ERT)
- 9.2.3. Other Treatment Types
- 9.3. Market Analysis, Insights and Forecast - by End-User
- 9.3.1. Hospitals
- 9.3.2. Ambulatory Surgical Centers
- 9.3.3. Other End-Users
- 9.1. Market Analysis, Insights and Forecast - by Route of Administration
- 10. South America Pompe Disease Treatment Industry Analysis, Insights and Forecast, 2019-2031
- 10.1. Market Analysis, Insights and Forecast - by Route of Administration
- 10.1.1. Oral
- 10.1.2. Parenteral
- 10.2. Market Analysis, Insights and Forecast - by Treatment Type
- 10.2.1. Substrate Reduction Therapy (SRT)
- 10.2.2. Enzyme Replacement Therapy (ERT)
- 10.2.3. Other Treatment Types
- 10.3. Market Analysis, Insights and Forecast - by End-User
- 10.3.1. Hospitals
- 10.3.2. Ambulatory Surgical Centers
- 10.3.3. Other End-Users
- 10.1. Market Analysis, Insights and Forecast - by Route of Administration
- 11. North America Pompe Disease Treatment Industry Analysis, Insights and Forecast, 2019-2031
- 11.1. Market Analysis, Insights and Forecast - By Country/Sub-region
- 11.1.1 United States
- 11.1.2 Canada
- 11.1.3 Mexico
- 12. Europe Pompe Disease Treatment Industry Analysis, Insights and Forecast, 2019-2031
- 12.1. Market Analysis, Insights and Forecast - By Country/Sub-region
- 12.1.1 Germany
- 12.1.2 United Kingdom
- 12.1.3 France
- 12.1.4 Italy
- 12.1.5 Spain
- 12.1.6 Rest of Europe
- 13. Asia Pacific Pompe Disease Treatment Industry Analysis, Insights and Forecast, 2019-2031
- 13.1. Market Analysis, Insights and Forecast - By Country/Sub-region
- 13.1.1 China
- 13.1.2 Japan
- 13.1.3 India
- 13.1.4 Australia
- 13.1.5 South Korea
- 13.1.6 Rest of Asia Pacific
- 14. Middle East and Africa Pompe Disease Treatment Industry Analysis, Insights and Forecast, 2019-2031
- 14.1. Market Analysis, Insights and Forecast - By Country/Sub-region
- 14.1.1 GCC
- 14.1.2 South Africa
- 14.1.3 Rest of Middle East and Africa
- 15. South America Pompe Disease Treatment Industry Analysis, Insights and Forecast, 2019-2031
- 15.1. Market Analysis, Insights and Forecast - By Country/Sub-region
- 15.1.1 Brazil
- 15.1.2 Argentina
- 15.1.3 Rest of South America
- 16. Competitive Analysis
- 16.1. Global Market Share Analysis 2024
- 16.2. Company Profiles
- 16.2.1 Astellas Pharma
- 16.2.1.1. Overview
- 16.2.1.2. Products
- 16.2.1.3. SWOT Analysis
- 16.2.1.4. Recent Developments
- 16.2.1.5. Financials (Based on Availability)
- 16.2.2 Amicus Therapeutics
- 16.2.2.1. Overview
- 16.2.2.2. Products
- 16.2.2.3. SWOT Analysis
- 16.2.2.4. Recent Developments
- 16.2.2.5. Financials (Based on Availability)
- 16.2.3 Sanofi
- 16.2.3.1. Overview
- 16.2.3.2. Products
- 16.2.3.3. SWOT Analysis
- 16.2.3.4. Recent Developments
- 16.2.3.5. Financials (Based on Availability)
- 16.2.4 EpiVax Inc
- 16.2.4.1. Overview
- 16.2.4.2. Products
- 16.2.4.3. SWOT Analysis
- 16.2.4.4. Recent Developments
- 16.2.4.5. Financials (Based on Availability)
- 16.2.5 AVROBIO Inc
- 16.2.5.1. Overview
- 16.2.5.2. Products
- 16.2.5.3. SWOT Analysis
- 16.2.5.4. Recent Developments
- 16.2.5.5. Financials (Based on Availability)
- 16.2.6 Genethon
- 16.2.6.1. Overview
- 16.2.6.2. Products
- 16.2.6.3. SWOT Analysis
- 16.2.6.4. Recent Developments
- 16.2.6.5. Financials (Based on Availability)
- 16.2.7 Oxyrane
- 16.2.7.1. Overview
- 16.2.7.2. Products
- 16.2.7.3. SWOT Analysis
- 16.2.7.4. Recent Developments
- 16.2.7.5. Financials (Based on Availability)
- 16.2.1 Astellas Pharma
List of Figures
- Figure 1: Global Pompe Disease Treatment Industry Revenue Breakdown (Million, %) by Region 2024 & 2032
- Figure 2: Global Pompe Disease Treatment Industry Volume Breakdown (K Unit, %) by Region 2024 & 2032
- Figure 3: North America Pompe Disease Treatment Industry Revenue (Million), by Country 2024 & 2032
- Figure 4: North America Pompe Disease Treatment Industry Volume (K Unit), by Country 2024 & 2032
- Figure 5: North America Pompe Disease Treatment Industry Revenue Share (%), by Country 2024 & 2032
- Figure 6: North America Pompe Disease Treatment Industry Volume Share (%), by Country 2024 & 2032
- Figure 7: Europe Pompe Disease Treatment Industry Revenue (Million), by Country 2024 & 2032
- Figure 8: Europe Pompe Disease Treatment Industry Volume (K Unit), by Country 2024 & 2032
- Figure 9: Europe Pompe Disease Treatment Industry Revenue Share (%), by Country 2024 & 2032
- Figure 10: Europe Pompe Disease Treatment Industry Volume Share (%), by Country 2024 & 2032
- Figure 11: Asia Pacific Pompe Disease Treatment Industry Revenue (Million), by Country 2024 & 2032
- Figure 12: Asia Pacific Pompe Disease Treatment Industry Volume (K Unit), by Country 2024 & 2032
- Figure 13: Asia Pacific Pompe Disease Treatment Industry Revenue Share (%), by Country 2024 & 2032
- Figure 14: Asia Pacific Pompe Disease Treatment Industry Volume Share (%), by Country 2024 & 2032
- Figure 15: Middle East and Africa Pompe Disease Treatment Industry Revenue (Million), by Country 2024 & 2032
- Figure 16: Middle East and Africa Pompe Disease Treatment Industry Volume (K Unit), by Country 2024 & 2032
- Figure 17: Middle East and Africa Pompe Disease Treatment Industry Revenue Share (%), by Country 2024 & 2032
- Figure 18: Middle East and Africa Pompe Disease Treatment Industry Volume Share (%), by Country 2024 & 2032
- Figure 19: South America Pompe Disease Treatment Industry Revenue (Million), by Country 2024 & 2032
- Figure 20: South America Pompe Disease Treatment Industry Volume (K Unit), by Country 2024 & 2032
- Figure 21: South America Pompe Disease Treatment Industry Revenue Share (%), by Country 2024 & 2032
- Figure 22: South America Pompe Disease Treatment Industry Volume Share (%), by Country 2024 & 2032
- Figure 23: North America Pompe Disease Treatment Industry Revenue (Million), by Route of Administration 2024 & 2032
- Figure 24: North America Pompe Disease Treatment Industry Volume (K Unit), by Route of Administration 2024 & 2032
- Figure 25: North America Pompe Disease Treatment Industry Revenue Share (%), by Route of Administration 2024 & 2032
- Figure 26: North America Pompe Disease Treatment Industry Volume Share (%), by Route of Administration 2024 & 2032
- Figure 27: North America Pompe Disease Treatment Industry Revenue (Million), by Treatment Type 2024 & 2032
- Figure 28: North America Pompe Disease Treatment Industry Volume (K Unit), by Treatment Type 2024 & 2032
- Figure 29: North America Pompe Disease Treatment Industry Revenue Share (%), by Treatment Type 2024 & 2032
- Figure 30: North America Pompe Disease Treatment Industry Volume Share (%), by Treatment Type 2024 & 2032
- Figure 31: North America Pompe Disease Treatment Industry Revenue (Million), by End-User 2024 & 2032
- Figure 32: North America Pompe Disease Treatment Industry Volume (K Unit), by End-User 2024 & 2032
- Figure 33: North America Pompe Disease Treatment Industry Revenue Share (%), by End-User 2024 & 2032
- Figure 34: North America Pompe Disease Treatment Industry Volume Share (%), by End-User 2024 & 2032
- Figure 35: North America Pompe Disease Treatment Industry Revenue (Million), by Country 2024 & 2032
- Figure 36: North America Pompe Disease Treatment Industry Volume (K Unit), by Country 2024 & 2032
- Figure 37: North America Pompe Disease Treatment Industry Revenue Share (%), by Country 2024 & 2032
- Figure 38: North America Pompe Disease Treatment Industry Volume Share (%), by Country 2024 & 2032
- Figure 39: Europe Pompe Disease Treatment Industry Revenue (Million), by Route of Administration 2024 & 2032
- Figure 40: Europe Pompe Disease Treatment Industry Volume (K Unit), by Route of Administration 2024 & 2032
- Figure 41: Europe Pompe Disease Treatment Industry Revenue Share (%), by Route of Administration 2024 & 2032
- Figure 42: Europe Pompe Disease Treatment Industry Volume Share (%), by Route of Administration 2024 & 2032
- Figure 43: Europe Pompe Disease Treatment Industry Revenue (Million), by Treatment Type 2024 & 2032
- Figure 44: Europe Pompe Disease Treatment Industry Volume (K Unit), by Treatment Type 2024 & 2032
- Figure 45: Europe Pompe Disease Treatment Industry Revenue Share (%), by Treatment Type 2024 & 2032
- Figure 46: Europe Pompe Disease Treatment Industry Volume Share (%), by Treatment Type 2024 & 2032
- Figure 47: Europe Pompe Disease Treatment Industry Revenue (Million), by End-User 2024 & 2032
- Figure 48: Europe Pompe Disease Treatment Industry Volume (K Unit), by End-User 2024 & 2032
- Figure 49: Europe Pompe Disease Treatment Industry Revenue Share (%), by End-User 2024 & 2032
- Figure 50: Europe Pompe Disease Treatment Industry Volume Share (%), by End-User 2024 & 2032
- Figure 51: Europe Pompe Disease Treatment Industry Revenue (Million), by Country 2024 & 2032
- Figure 52: Europe Pompe Disease Treatment Industry Volume (K Unit), by Country 2024 & 2032
- Figure 53: Europe Pompe Disease Treatment Industry Revenue Share (%), by Country 2024 & 2032
- Figure 54: Europe Pompe Disease Treatment Industry Volume Share (%), by Country 2024 & 2032
- Figure 55: Asia Pacific Pompe Disease Treatment Industry Revenue (Million), by Route of Administration 2024 & 2032
- Figure 56: Asia Pacific Pompe Disease Treatment Industry Volume (K Unit), by Route of Administration 2024 & 2032
- Figure 57: Asia Pacific Pompe Disease Treatment Industry Revenue Share (%), by Route of Administration 2024 & 2032
- Figure 58: Asia Pacific Pompe Disease Treatment Industry Volume Share (%), by Route of Administration 2024 & 2032
- Figure 59: Asia Pacific Pompe Disease Treatment Industry Revenue (Million), by Treatment Type 2024 & 2032
- Figure 60: Asia Pacific Pompe Disease Treatment Industry Volume (K Unit), by Treatment Type 2024 & 2032
- Figure 61: Asia Pacific Pompe Disease Treatment Industry Revenue Share (%), by Treatment Type 2024 & 2032
- Figure 62: Asia Pacific Pompe Disease Treatment Industry Volume Share (%), by Treatment Type 2024 & 2032
- Figure 63: Asia Pacific Pompe Disease Treatment Industry Revenue (Million), by End-User 2024 & 2032
- Figure 64: Asia Pacific Pompe Disease Treatment Industry Volume (K Unit), by End-User 2024 & 2032
- Figure 65: Asia Pacific Pompe Disease Treatment Industry Revenue Share (%), by End-User 2024 & 2032
- Figure 66: Asia Pacific Pompe Disease Treatment Industry Volume Share (%), by End-User 2024 & 2032
- Figure 67: Asia Pacific Pompe Disease Treatment Industry Revenue (Million), by Country 2024 & 2032
- Figure 68: Asia Pacific Pompe Disease Treatment Industry Volume (K Unit), by Country 2024 & 2032
- Figure 69: Asia Pacific Pompe Disease Treatment Industry Revenue Share (%), by Country 2024 & 2032
- Figure 70: Asia Pacific Pompe Disease Treatment Industry Volume Share (%), by Country 2024 & 2032
- Figure 71: Middle East and Africa Pompe Disease Treatment Industry Revenue (Million), by Route of Administration 2024 & 2032
- Figure 72: Middle East and Africa Pompe Disease Treatment Industry Volume (K Unit), by Route of Administration 2024 & 2032
- Figure 73: Middle East and Africa Pompe Disease Treatment Industry Revenue Share (%), by Route of Administration 2024 & 2032
- Figure 74: Middle East and Africa Pompe Disease Treatment Industry Volume Share (%), by Route of Administration 2024 & 2032
- Figure 75: Middle East and Africa Pompe Disease Treatment Industry Revenue (Million), by Treatment Type 2024 & 2032
- Figure 76: Middle East and Africa Pompe Disease Treatment Industry Volume (K Unit), by Treatment Type 2024 & 2032
- Figure 77: Middle East and Africa Pompe Disease Treatment Industry Revenue Share (%), by Treatment Type 2024 & 2032
- Figure 78: Middle East and Africa Pompe Disease Treatment Industry Volume Share (%), by Treatment Type 2024 & 2032
- Figure 79: Middle East and Africa Pompe Disease Treatment Industry Revenue (Million), by End-User 2024 & 2032
- Figure 80: Middle East and Africa Pompe Disease Treatment Industry Volume (K Unit), by End-User 2024 & 2032
- Figure 81: Middle East and Africa Pompe Disease Treatment Industry Revenue Share (%), by End-User 2024 & 2032
- Figure 82: Middle East and Africa Pompe Disease Treatment Industry Volume Share (%), by End-User 2024 & 2032
- Figure 83: Middle East and Africa Pompe Disease Treatment Industry Revenue (Million), by Country 2024 & 2032
- Figure 84: Middle East and Africa Pompe Disease Treatment Industry Volume (K Unit), by Country 2024 & 2032
- Figure 85: Middle East and Africa Pompe Disease Treatment Industry Revenue Share (%), by Country 2024 & 2032
- Figure 86: Middle East and Africa Pompe Disease Treatment Industry Volume Share (%), by Country 2024 & 2032
- Figure 87: South America Pompe Disease Treatment Industry Revenue (Million), by Route of Administration 2024 & 2032
- Figure 88: South America Pompe Disease Treatment Industry Volume (K Unit), by Route of Administration 2024 & 2032
- Figure 89: South America Pompe Disease Treatment Industry Revenue Share (%), by Route of Administration 2024 & 2032
- Figure 90: South America Pompe Disease Treatment Industry Volume Share (%), by Route of Administration 2024 & 2032
- Figure 91: South America Pompe Disease Treatment Industry Revenue (Million), by Treatment Type 2024 & 2032
- Figure 92: South America Pompe Disease Treatment Industry Volume (K Unit), by Treatment Type 2024 & 2032
- Figure 93: South America Pompe Disease Treatment Industry Revenue Share (%), by Treatment Type 2024 & 2032
- Figure 94: South America Pompe Disease Treatment Industry Volume Share (%), by Treatment Type 2024 & 2032
- Figure 95: South America Pompe Disease Treatment Industry Revenue (Million), by End-User 2024 & 2032
- Figure 96: South America Pompe Disease Treatment Industry Volume (K Unit), by End-User 2024 & 2032
- Figure 97: South America Pompe Disease Treatment Industry Revenue Share (%), by End-User 2024 & 2032
- Figure 98: South America Pompe Disease Treatment Industry Volume Share (%), by End-User 2024 & 2032
- Figure 99: South America Pompe Disease Treatment Industry Revenue (Million), by Country 2024 & 2032
- Figure 100: South America Pompe Disease Treatment Industry Volume (K Unit), by Country 2024 & 2032
- Figure 101: South America Pompe Disease Treatment Industry Revenue Share (%), by Country 2024 & 2032
- Figure 102: South America Pompe Disease Treatment Industry Volume Share (%), by Country 2024 & 2032
List of Tables
- Table 1: Global Pompe Disease Treatment Industry Revenue Million Forecast, by Region 2019 & 2032
- Table 2: Global Pompe Disease Treatment Industry Volume K Unit Forecast, by Region 2019 & 2032
- Table 3: Global Pompe Disease Treatment Industry Revenue Million Forecast, by Route of Administration 2019 & 2032
- Table 4: Global Pompe Disease Treatment Industry Volume K Unit Forecast, by Route of Administration 2019 & 2032
- Table 5: Global Pompe Disease Treatment Industry Revenue Million Forecast, by Treatment Type 2019 & 2032
- Table 6: Global Pompe Disease Treatment Industry Volume K Unit Forecast, by Treatment Type 2019 & 2032
- Table 7: Global Pompe Disease Treatment Industry Revenue Million Forecast, by End-User 2019 & 2032
- Table 8: Global Pompe Disease Treatment Industry Volume K Unit Forecast, by End-User 2019 & 2032
- Table 9: Global Pompe Disease Treatment Industry Revenue Million Forecast, by Region 2019 & 2032
- Table 10: Global Pompe Disease Treatment Industry Volume K Unit Forecast, by Region 2019 & 2032
- Table 11: Global Pompe Disease Treatment Industry Revenue Million Forecast, by Country 2019 & 2032
- Table 12: Global Pompe Disease Treatment Industry Volume K Unit Forecast, by Country 2019 & 2032
- Table 13: United States Pompe Disease Treatment Industry Revenue (Million) Forecast, by Application 2019 & 2032
- Table 14: United States Pompe Disease Treatment Industry Volume (K Unit) Forecast, by Application 2019 & 2032
- Table 15: Canada Pompe Disease Treatment Industry Revenue (Million) Forecast, by Application 2019 & 2032
- Table 16: Canada Pompe Disease Treatment Industry Volume (K Unit) Forecast, by Application 2019 & 2032
- Table 17: Mexico Pompe Disease Treatment Industry Revenue (Million) Forecast, by Application 2019 & 2032
- Table 18: Mexico Pompe Disease Treatment Industry Volume (K Unit) Forecast, by Application 2019 & 2032
- Table 19: Global Pompe Disease Treatment Industry Revenue Million Forecast, by Country 2019 & 2032
- Table 20: Global Pompe Disease Treatment Industry Volume K Unit Forecast, by Country 2019 & 2032
- Table 21: Germany Pompe Disease Treatment Industry Revenue (Million) Forecast, by Application 2019 & 2032
- Table 22: Germany Pompe Disease Treatment Industry Volume (K Unit) Forecast, by Application 2019 & 2032
- Table 23: United Kingdom Pompe Disease Treatment Industry Revenue (Million) Forecast, by Application 2019 & 2032
- Table 24: United Kingdom Pompe Disease Treatment Industry Volume (K Unit) Forecast, by Application 2019 & 2032
- Table 25: France Pompe Disease Treatment Industry Revenue (Million) Forecast, by Application 2019 & 2032
- Table 26: France Pompe Disease Treatment Industry Volume (K Unit) Forecast, by Application 2019 & 2032
- Table 27: Italy Pompe Disease Treatment Industry Revenue (Million) Forecast, by Application 2019 & 2032
- Table 28: Italy Pompe Disease Treatment Industry Volume (K Unit) Forecast, by Application 2019 & 2032
- Table 29: Spain Pompe Disease Treatment Industry Revenue (Million) Forecast, by Application 2019 & 2032
- Table 30: Spain Pompe Disease Treatment Industry Volume (K Unit) Forecast, by Application 2019 & 2032
- Table 31: Rest of Europe Pompe Disease Treatment Industry Revenue (Million) Forecast, by Application 2019 & 2032
- Table 32: Rest of Europe Pompe Disease Treatment Industry Volume (K Unit) Forecast, by Application 2019 & 2032
- Table 33: Global Pompe Disease Treatment Industry Revenue Million Forecast, by Country 2019 & 2032
- Table 34: Global Pompe Disease Treatment Industry Volume K Unit Forecast, by Country 2019 & 2032
- Table 35: China Pompe Disease Treatment Industry Revenue (Million) Forecast, by Application 2019 & 2032
- Table 36: China Pompe Disease Treatment Industry Volume (K Unit) Forecast, by Application 2019 & 2032
- Table 37: Japan Pompe Disease Treatment Industry Revenue (Million) Forecast, by Application 2019 & 2032
- Table 38: Japan Pompe Disease Treatment Industry Volume (K Unit) Forecast, by Application 2019 & 2032
- Table 39: India Pompe Disease Treatment Industry Revenue (Million) Forecast, by Application 2019 & 2032
- Table 40: India Pompe Disease Treatment Industry Volume (K Unit) Forecast, by Application 2019 & 2032
- Table 41: Australia Pompe Disease Treatment Industry Revenue (Million) Forecast, by Application 2019 & 2032
- Table 42: Australia Pompe Disease Treatment Industry Volume (K Unit) Forecast, by Application 2019 & 2032
- Table 43: South Korea Pompe Disease Treatment Industry Revenue (Million) Forecast, by Application 2019 & 2032
- Table 44: South Korea Pompe Disease Treatment Industry Volume (K Unit) Forecast, by Application 2019 & 2032
- Table 45: Rest of Asia Pacific Pompe Disease Treatment Industry Revenue (Million) Forecast, by Application 2019 & 2032
- Table 46: Rest of Asia Pacific Pompe Disease Treatment Industry Volume (K Unit) Forecast, by Application 2019 & 2032
- Table 47: Global Pompe Disease Treatment Industry Revenue Million Forecast, by Country 2019 & 2032
- Table 48: Global Pompe Disease Treatment Industry Volume K Unit Forecast, by Country 2019 & 2032
- Table 49: GCC Pompe Disease Treatment Industry Revenue (Million) Forecast, by Application 2019 & 2032
- Table 50: GCC Pompe Disease Treatment Industry Volume (K Unit) Forecast, by Application 2019 & 2032
- Table 51: South Africa Pompe Disease Treatment Industry Revenue (Million) Forecast, by Application 2019 & 2032
- Table 52: South Africa Pompe Disease Treatment Industry Volume (K Unit) Forecast, by Application 2019 & 2032
- Table 53: Rest of Middle East and Africa Pompe Disease Treatment Industry Revenue (Million) Forecast, by Application 2019 & 2032
- Table 54: Rest of Middle East and Africa Pompe Disease Treatment Industry Volume (K Unit) Forecast, by Application 2019 & 2032
- Table 55: Global Pompe Disease Treatment Industry Revenue Million Forecast, by Country 2019 & 2032
- Table 56: Global Pompe Disease Treatment Industry Volume K Unit Forecast, by Country 2019 & 2032
- Table 57: Brazil Pompe Disease Treatment Industry Revenue (Million) Forecast, by Application 2019 & 2032
- Table 58: Brazil Pompe Disease Treatment Industry Volume (K Unit) Forecast, by Application 2019 & 2032
- Table 59: Argentina Pompe Disease Treatment Industry Revenue (Million) Forecast, by Application 2019 & 2032
- Table 60: Argentina Pompe Disease Treatment Industry Volume (K Unit) Forecast, by Application 2019 & 2032
- Table 61: Rest of South America Pompe Disease Treatment Industry Revenue (Million) Forecast, by Application 2019 & 2032
- Table 62: Rest of South America Pompe Disease Treatment Industry Volume (K Unit) Forecast, by Application 2019 & 2032
- Table 63: Global Pompe Disease Treatment Industry Revenue Million Forecast, by Route of Administration 2019 & 2032
- Table 64: Global Pompe Disease Treatment Industry Volume K Unit Forecast, by Route of Administration 2019 & 2032
- Table 65: Global Pompe Disease Treatment Industry Revenue Million Forecast, by Treatment Type 2019 & 2032
- Table 66: Global Pompe Disease Treatment Industry Volume K Unit Forecast, by Treatment Type 2019 & 2032
- Table 67: Global Pompe Disease Treatment Industry Revenue Million Forecast, by End-User 2019 & 2032
- Table 68: Global Pompe Disease Treatment Industry Volume K Unit Forecast, by End-User 2019 & 2032
- Table 69: Global Pompe Disease Treatment Industry Revenue Million Forecast, by Country 2019 & 2032
- Table 70: Global Pompe Disease Treatment Industry Volume K Unit Forecast, by Country 2019 & 2032
- Table 71: United States Pompe Disease Treatment Industry Revenue (Million) Forecast, by Application 2019 & 2032
- Table 72: United States Pompe Disease Treatment Industry Volume (K Unit) Forecast, by Application 2019 & 2032
- Table 73: Canada Pompe Disease Treatment Industry Revenue (Million) Forecast, by Application 2019 & 2032
- Table 74: Canada Pompe Disease Treatment Industry Volume (K Unit) Forecast, by Application 2019 & 2032
- Table 75: Mexico Pompe Disease Treatment Industry Revenue (Million) Forecast, by Application 2019 & 2032
- Table 76: Mexico Pompe Disease Treatment Industry Volume (K Unit) Forecast, by Application 2019 & 2032
- Table 77: Global Pompe Disease Treatment Industry Revenue Million Forecast, by Route of Administration 2019 & 2032
- Table 78: Global Pompe Disease Treatment Industry Volume K Unit Forecast, by Route of Administration 2019 & 2032
- Table 79: Global Pompe Disease Treatment Industry Revenue Million Forecast, by Treatment Type 2019 & 2032
- Table 80: Global Pompe Disease Treatment Industry Volume K Unit Forecast, by Treatment Type 2019 & 2032
- Table 81: Global Pompe Disease Treatment Industry Revenue Million Forecast, by End-User 2019 & 2032
- Table 82: Global Pompe Disease Treatment Industry Volume K Unit Forecast, by End-User 2019 & 2032
- Table 83: Global Pompe Disease Treatment Industry Revenue Million Forecast, by Country 2019 & 2032
- Table 84: Global Pompe Disease Treatment Industry Volume K Unit Forecast, by Country 2019 & 2032
- Table 85: Germany Pompe Disease Treatment Industry Revenue (Million) Forecast, by Application 2019 & 2032
- Table 86: Germany Pompe Disease Treatment Industry Volume (K Unit) Forecast, by Application 2019 & 2032
- Table 87: United Kingdom Pompe Disease Treatment Industry Revenue (Million) Forecast, by Application 2019 & 2032
- Table 88: United Kingdom Pompe Disease Treatment Industry Volume (K Unit) Forecast, by Application 2019 & 2032
- Table 89: France Pompe Disease Treatment Industry Revenue (Million) Forecast, by Application 2019 & 2032
- Table 90: France Pompe Disease Treatment Industry Volume (K Unit) Forecast, by Application 2019 & 2032
- Table 91: Italy Pompe Disease Treatment Industry Revenue (Million) Forecast, by Application 2019 & 2032
- Table 92: Italy Pompe Disease Treatment Industry Volume (K Unit) Forecast, by Application 2019 & 2032
- Table 93: Spain Pompe Disease Treatment Industry Revenue (Million) Forecast, by Application 2019 & 2032
- Table 94: Spain Pompe Disease Treatment Industry Volume (K Unit) Forecast, by Application 2019 & 2032
- Table 95: Rest of Europe Pompe Disease Treatment Industry Revenue (Million) Forecast, by Application 2019 & 2032
- Table 96: Rest of Europe Pompe Disease Treatment Industry Volume (K Unit) Forecast, by Application 2019 & 2032
- Table 97: Global Pompe Disease Treatment Industry Revenue Million Forecast, by Route of Administration 2019 & 2032
- Table 98: Global Pompe Disease Treatment Industry Volume K Unit Forecast, by Route of Administration 2019 & 2032
- Table 99: Global Pompe Disease Treatment Industry Revenue Million Forecast, by Treatment Type 2019 & 2032
- Table 100: Global Pompe Disease Treatment Industry Volume K Unit Forecast, by Treatment Type 2019 & 2032
- Table 101: Global Pompe Disease Treatment Industry Revenue Million Forecast, by End-User 2019 & 2032
- Table 102: Global Pompe Disease Treatment Industry Volume K Unit Forecast, by End-User 2019 & 2032
- Table 103: Global Pompe Disease Treatment Industry Revenue Million Forecast, by Country 2019 & 2032
- Table 104: Global Pompe Disease Treatment Industry Volume K Unit Forecast, by Country 2019 & 2032
- Table 105: China Pompe Disease Treatment Industry Revenue (Million) Forecast, by Application 2019 & 2032
- Table 106: China Pompe Disease Treatment Industry Volume (K Unit) Forecast, by Application 2019 & 2032
- Table 107: Japan Pompe Disease Treatment Industry Revenue (Million) Forecast, by Application 2019 & 2032
- Table 108: Japan Pompe Disease Treatment Industry Volume (K Unit) Forecast, by Application 2019 & 2032
- Table 109: India Pompe Disease Treatment Industry Revenue (Million) Forecast, by Application 2019 & 2032
- Table 110: India Pompe Disease Treatment Industry Volume (K Unit) Forecast, by Application 2019 & 2032
- Table 111: Australia Pompe Disease Treatment Industry Revenue (Million) Forecast, by Application 2019 & 2032
- Table 112: Australia Pompe Disease Treatment Industry Volume (K Unit) Forecast, by Application 2019 & 2032
- Table 113: South Korea Pompe Disease Treatment Industry Revenue (Million) Forecast, by Application 2019 & 2032
- Table 114: South Korea Pompe Disease Treatment Industry Volume (K Unit) Forecast, by Application 2019 & 2032
- Table 115: Rest of Asia Pacific Pompe Disease Treatment Industry Revenue (Million) Forecast, by Application 2019 & 2032
- Table 116: Rest of Asia Pacific Pompe Disease Treatment Industry Volume (K Unit) Forecast, by Application 2019 & 2032
- Table 117: Global Pompe Disease Treatment Industry Revenue Million Forecast, by Route of Administration 2019 & 2032
- Table 118: Global Pompe Disease Treatment Industry Volume K Unit Forecast, by Route of Administration 2019 & 2032
- Table 119: Global Pompe Disease Treatment Industry Revenue Million Forecast, by Treatment Type 2019 & 2032
- Table 120: Global Pompe Disease Treatment Industry Volume K Unit Forecast, by Treatment Type 2019 & 2032
- Table 121: Global Pompe Disease Treatment Industry Revenue Million Forecast, by End-User 2019 & 2032
- Table 122: Global Pompe Disease Treatment Industry Volume K Unit Forecast, by End-User 2019 & 2032
- Table 123: Global Pompe Disease Treatment Industry Revenue Million Forecast, by Country 2019 & 2032
- Table 124: Global Pompe Disease Treatment Industry Volume K Unit Forecast, by Country 2019 & 2032
- Table 125: GCC Pompe Disease Treatment Industry Revenue (Million) Forecast, by Application 2019 & 2032
- Table 126: GCC Pompe Disease Treatment Industry Volume (K Unit) Forecast, by Application 2019 & 2032
- Table 127: South Africa Pompe Disease Treatment Industry Revenue (Million) Forecast, by Application 2019 & 2032
- Table 128: South Africa Pompe Disease Treatment Industry Volume (K Unit) Forecast, by Application 2019 & 2032
- Table 129: Rest of Middle East and Africa Pompe Disease Treatment Industry Revenue (Million) Forecast, by Application 2019 & 2032
- Table 130: Rest of Middle East and Africa Pompe Disease Treatment Industry Volume (K Unit) Forecast, by Application 2019 & 2032
- Table 131: Global Pompe Disease Treatment Industry Revenue Million Forecast, by Route of Administration 2019 & 2032
- Table 132: Global Pompe Disease Treatment Industry Volume K Unit Forecast, by Route of Administration 2019 & 2032
- Table 133: Global Pompe Disease Treatment Industry Revenue Million Forecast, by Treatment Type 2019 & 2032
- Table 134: Global Pompe Disease Treatment Industry Volume K Unit Forecast, by Treatment Type 2019 & 2032
- Table 135: Global Pompe Disease Treatment Industry Revenue Million Forecast, by End-User 2019 & 2032
- Table 136: Global Pompe Disease Treatment Industry Volume K Unit Forecast, by End-User 2019 & 2032
- Table 137: Global Pompe Disease Treatment Industry Revenue Million Forecast, by Country 2019 & 2032
- Table 138: Global Pompe Disease Treatment Industry Volume K Unit Forecast, by Country 2019 & 2032
- Table 139: Brazil Pompe Disease Treatment Industry Revenue (Million) Forecast, by Application 2019 & 2032
- Table 140: Brazil Pompe Disease Treatment Industry Volume (K Unit) Forecast, by Application 2019 & 2032
- Table 141: Argentina Pompe Disease Treatment Industry Revenue (Million) Forecast, by Application 2019 & 2032
- Table 142: Argentina Pompe Disease Treatment Industry Volume (K Unit) Forecast, by Application 2019 & 2032
- Table 143: Rest of South America Pompe Disease Treatment Industry Revenue (Million) Forecast, by Application 2019 & 2032
- Table 144: Rest of South America Pompe Disease Treatment Industry Volume (K Unit) Forecast, by Application 2019 & 2032
Frequently Asked Questions
1. What is the projected Compound Annual Growth Rate (CAGR) of the Pompe Disease Treatment Industry?
The projected CAGR is approximately 4.50%.
2. Which companies are prominent players in the Pompe Disease Treatment Industry?
Key companies in the market include Astellas Pharma, Amicus Therapeutics, Sanofi, EpiVax Inc, AVROBIO Inc , Genethon, Oxyrane.
3. What are the main segments of the Pompe Disease Treatment Industry?
The market segments include Route of Administration, Treatment Type, End-User.
4. Can you provide details about the market size?
The market size is estimated to be USD XX Million as of 2022.
5. What are some drivers contributing to market growth?
Launch of Novel Drugs; Continued Uptake of Long Term Therapies.
6. What are the notable trends driving market growth?
Enzyme Replacement Therapy (ERT) Segment is Estimated to Witness a Considerable Growth Over the Forecast Period.
7. Are there any restraints impacting market growth?
High Treatment Cost.
8. Can you provide examples of recent developments in the market?
June 2022: The European Commission granted marketing authorization for Nexvia Dyme (alglucosidase alfa), an enzyme replacement therapy (ERT) for the long-term treatment of both late-onset and infantile-onset Pompe disease, a rare, progressive, and debilitating muscle disorder.
9. What pricing options are available for accessing the report?
Pricing options include single-user, multi-user, and enterprise licenses priced at USD 4750, USD 5250, and USD 8750 respectively.
10. Is the market size provided in terms of value or volume?
The market size is provided in terms of value, measured in Million and volume, measured in K Unit.
11. Are there any specific market keywords associated with the report?
Yes, the market keyword associated with the report is "Pompe Disease Treatment Industry," which aids in identifying and referencing the specific market segment covered.
12. How do I determine which pricing option suits my needs best?
The pricing options vary based on user requirements and access needs. Individual users may opt for single-user licenses, while businesses requiring broader access may choose multi-user or enterprise licenses for cost-effective access to the report.
13. Are there any additional resources or data provided in the Pompe Disease Treatment Industry report?
While the report offers comprehensive insights, it's advisable to review the specific contents or supplementary materials provided to ascertain if additional resources or data are available.
14. How can I stay updated on further developments or reports in the Pompe Disease Treatment Industry?
To stay informed about further developments, trends, and reports in the Pompe Disease Treatment Industry, consider subscribing to industry newsletters, following relevant companies and organizations, or regularly checking reputable industry news sources and publications.
Methodology
Step 1 - Identification of Relevant Samples Size from Population Database


Step 2 - Approaches for Defining Global Market Size (Value, Volume* & Price*)

Note*: In applicable scenarios
Step 3 - Data Sources
Primary Research
- Web Analytics
- Survey Reports
- Research Institute
- Latest Research Reports
- Opinion Leaders
Secondary Research
- Annual Reports
- White Paper
- Latest Press Release
- Industry Association
- Paid Database
- Investor Presentations

Step 4 - Data Triangulation
Involves using different sources of information in order to increase the validity of a study
These sources are likely to be stakeholders in a program - participants, other researchers, program staff, other community members, and so on.
Then we put all data in single framework & apply various statistical tools to find out the dynamic on the market.
During the analysis stage, feedback from the stakeholder groups would be compared to determine areas of agreement as well as areas of divergence
