

Key Insights
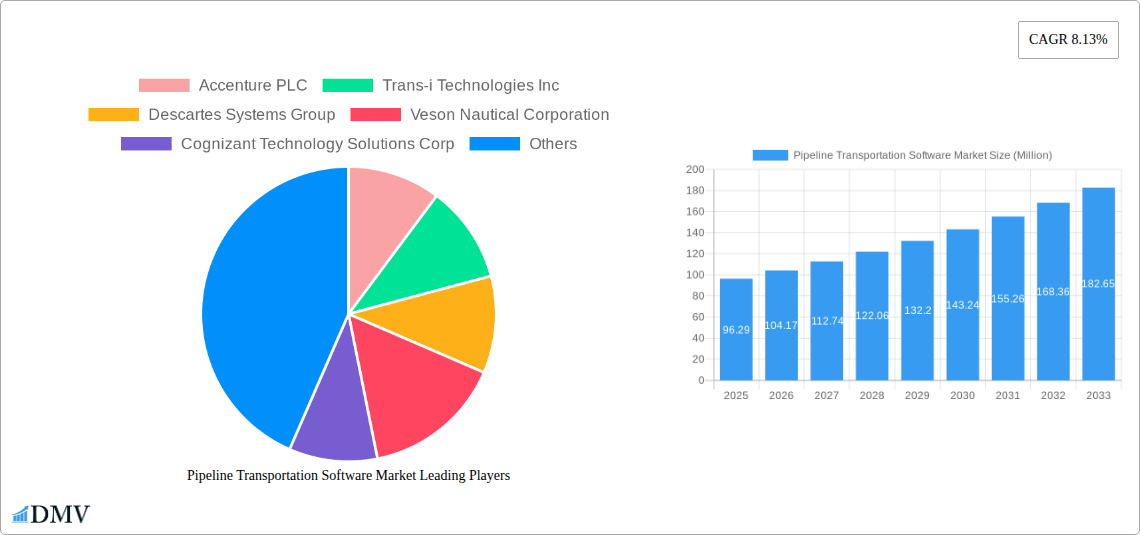
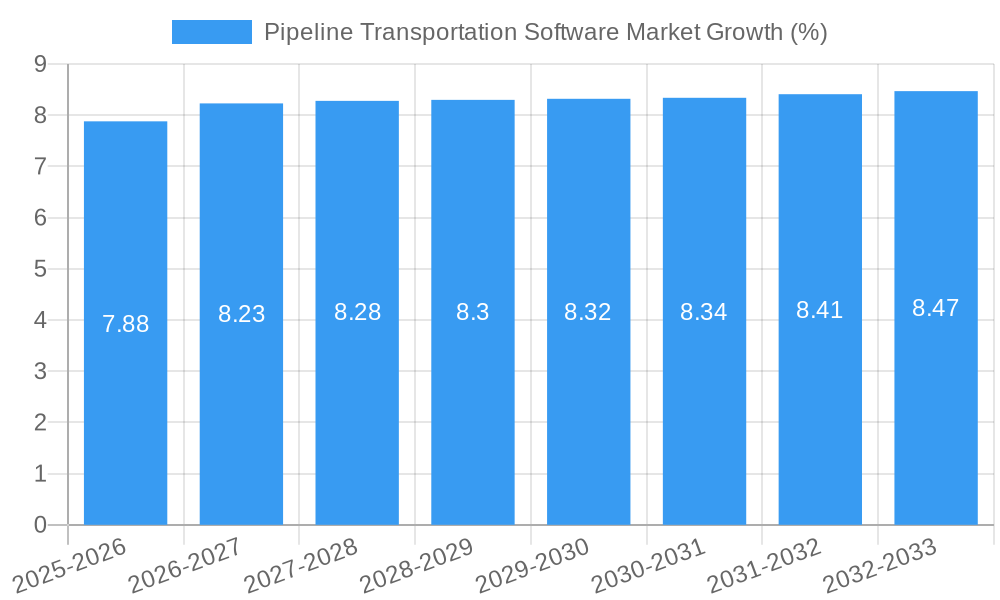
The Pipeline Transportation Software market is experiencing robust growth, projected to reach a valuation of $96.29 million in 2025 and maintain a Compound Annual Growth Rate (CAGR) of 8.13% from 2025 to 2033. This expansion is driven by several key factors. Firstly, the increasing need for efficient and secure pipeline operations necessitates sophisticated software solutions for monitoring, managing, and optimizing transportation. Secondly, stringent government regulations regarding pipeline safety and environmental protection are pushing companies to adopt advanced software for compliance and risk mitigation. Thirdly, the integration of technologies like IoT (Internet of Things), AI (Artificial Intelligence), and machine learning is enhancing the capabilities of pipeline transportation software, leading to improved operational efficiency and predictive maintenance. Finally, the growing demand for real-time data analytics and improved decision-making across various end-user verticals, including oil and gas, chemical, and manufacturing, is further fueling market growth.
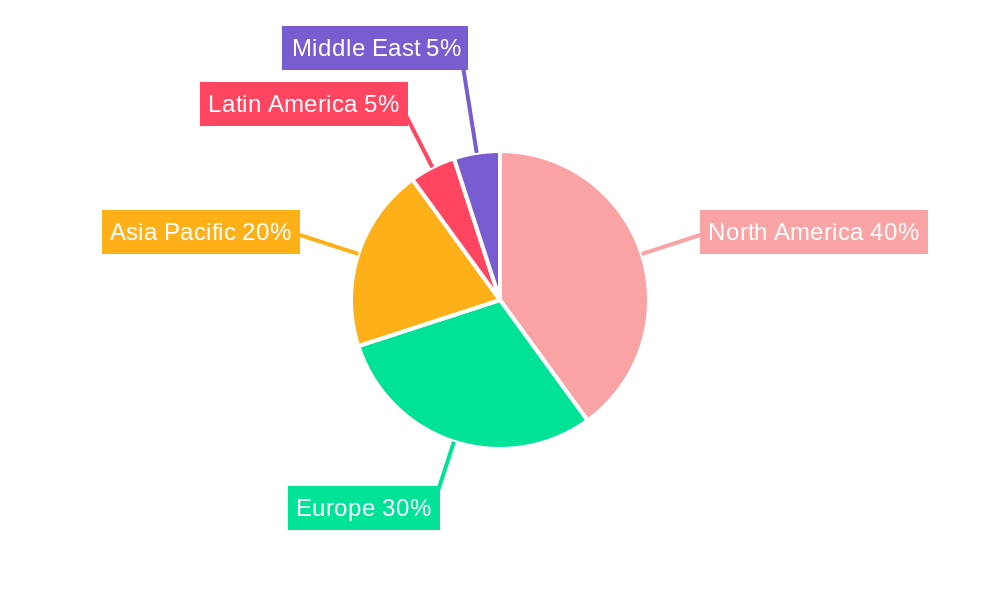
The market is segmented by deployment (on-premise, cloud, hybrid) and end-user vertical (retail, oil and gas, manufacturing and industrial, aerospace and defense, chemical, construction, healthcare, food and beverage, and others). The cloud deployment model is anticipated to dominate due to its scalability, cost-effectiveness, and accessibility. Within end-user verticals, the oil and gas sector currently holds the largest market share, owing to the critical nature of pipeline operations in this industry. However, increasing adoption across other sectors, particularly manufacturing and industrial, is expected to contribute significantly to the market's future growth. Competition is intense, with major players like Accenture PLC, Descartes Systems Group, and SAP SE vying for market share. The strategic partnerships, mergers, and acquisitions observed in the recent past indicate the market's dynamic nature and the drive for technological innovation. Geographical growth will likely see strong performance in North America and Europe initially, followed by increasing adoption in the Asia-Pacific region driven by infrastructure development and industrialization.
Pipeline Transportation Software Market: A Comprehensive Report (2019-2033)
This insightful report provides a detailed analysis of the Pipeline Transportation Software Market, offering a comprehensive overview of its current state, future trajectory, and key players. Covering the period from 2019 to 2033, with a base year of 2025 and a forecast period spanning 2025-2033, this report is an invaluable resource for stakeholders seeking to understand and capitalize on the opportunities within this dynamic market. The market is projected to reach xx Million USD by 2033.
Pipeline Transportation Software Market Composition & Trends
This section dissects the competitive landscape of the pipeline transportation software market, examining market concentration, innovation drivers, regulatory frameworks, substitute products, end-user profiles, and merger & acquisition (M&A) activities. We analyze market share distribution among key players, revealing the dominance of established firms and the emergence of new competitors. The report also quantifies M&A deal values, identifying trends in strategic partnerships and consolidation within the industry.
- Market Concentration: The market exhibits a moderately concentrated structure, with a few major players holding significant market share. The Herfindahl-Hirschman Index (HHI) is estimated to be xx, indicating a [description of market concentration based on the calculated HHI].
- Innovation Catalysts: Technological advancements, such as AI and IoT integration, are driving innovation, leading to improved efficiency and real-time monitoring capabilities.
- Regulatory Landscape: Stringent regulations concerning data security and pipeline safety are shaping the market's trajectory, driving the adoption of compliant software solutions.
- Substitute Products: Limited substitutes exist, primarily legacy systems, but their functionalities are often insufficient compared to modern pipeline transportation software.
- End-User Profiles: The key end-user verticals include Oil and Gas, Chemical, Manufacturing and Industrial, and others, each with unique software requirements.
- M&A Activities: The past five years have witnessed xx M&A deals valued at approximately xx Million USD, indicating significant consolidation within the market. This activity is largely driven by the desire to expand market share and access new technologies.
Pipeline Transportation Software Market Industry Evolution
This section explores the market's growth trajectory, driven by factors such as increasing demand for efficient pipeline management, technological advancements, and evolving consumer needs. We analyze historical and projected growth rates, adoption metrics across different regions and segments, and the impact of industry trends. The market has shown a CAGR of xx% during 2019-2024. Technological innovations like AI-powered predictive maintenance, blockchain for enhanced security, and cloud-based deployment models have significantly accelerated market growth. Furthermore, changing consumer demands for real-time data analytics and improved safety protocols are driving market expansion.
Leading Regions, Countries, or Segments in Pipeline Transportation Software Market
This section identifies the dominant regions, countries, and segments within the pipeline transportation software market. The analysis considers factors driving regional dominance, including investment trends and regulatory support. The Oil and Gas sector currently holds the largest market share followed by the Chemical industry.
- By Deployment: The Cloud segment is witnessing the fastest growth due to its scalability, cost-effectiveness, and accessibility.
- By End-user Vertical: The Oil and Gas sector remains the dominant end-user due to stringent safety regulations and the need for real-time pipeline monitoring.
- Key Drivers (By Region/Segment):
- North America: High adoption rates of advanced technologies and robust regulatory frameworks drive market growth.
- Europe: Increasing government investments in pipeline infrastructure development fuel market expansion.
- Asia-Pacific: Rapid industrialization and growing energy demand in countries like India and China are key growth drivers.
Pipeline Transportation Software Market Product Innovations
The pipeline transportation software market is characterized by continuous product innovation, with new features focusing on enhanced security, improved efficiency, and data analytics capabilities. Recent advancements include AI-powered predictive maintenance, real-time monitoring dashboards, and integrated data visualization tools. These innovations are driving efficiency gains, reducing operational costs, and enhancing safety protocols. Unique selling propositions often center around specialized features catering to specific industry needs or superior integration capabilities with existing pipeline management systems.
Propelling Factors for Pipeline Transportation Software Market Growth
Several factors are driving the growth of the pipeline transportation software market. Firstly, the increasing need for efficient and safe pipeline management is paramount. Secondly, technological advancements, such as the integration of AI and IoT, offer enhanced monitoring and predictive maintenance capabilities. Lastly, supportive government regulations that mandate improved pipeline safety and data management are propelling market expansion.
Obstacles in the Pipeline Transportation Software Market
The market faces challenges including high initial investment costs for software implementation, the complexity of integrating with legacy systems, and the need for specialized expertise to operate and maintain the software. Furthermore, concerns about data security and compliance with stringent regulations can create barriers to market entry. Supply chain disruptions and skilled labor shortages are also affecting growth.
Future Opportunities in Pipeline Transportation Software Market
Future opportunities lie in the expansion into new geographic markets, particularly in developing economies with burgeoning pipeline infrastructure. Moreover, emerging technologies like blockchain for enhanced security and the development of integrated solutions across the entire pipeline value chain present significant growth potential. The integration of AR/VR for enhanced maintenance and training is another promising avenue.
Major Players in the Pipeline Transportation Software Market Ecosystem
- Accenture PLC
- Trans-i Technologies Inc
- Descartes Systems Group
- Veson Nautical Corporation
- Cognizant Technology Solutions Corp
- HighJump Software Inc
- Bass Software Ltd
- SAP SE
- DNV GL (GL Maritime Software GmbH)
- Aljex Software Inc
Key Developments in Pipeline Transportation Software Market Industry
- April 2023: Serbia's government investment of USD 30.6 Million in river transport infrastructure development under the "Sail Through Serbia" initiative creates significant growth opportunities for pipeline transportation software.
- January 2023: The USD 131 Million loan secured by NSFTPL and ADB for upgrading the Jawaharlal Nehru Port Container Terminal in India enhances logistics infrastructure, positively impacting the market.
Strategic Pipeline Transportation Software Market Forecast
The pipeline transportation software market is poised for strong growth, driven by increasing investment in pipeline infrastructure, technological advancements, and the growing need for enhanced safety and efficiency. The market is expected to witness significant expansion in the coming years, presenting substantial opportunities for both established players and new entrants. Continued innovation in areas such as AI, IoT, and blockchain will further fuel market expansion.
Pipeline Transportation Software Market Segmentation
-
1. Deployment
- 1.1. On-premise
- 1.2. Cloud
- 1.3. Hybrid
-
2. End-user Vertical
- 2.1. Retail
- 2.2. Oil and Gas
- 2.3. Manufacturing and Industrial
- 2.4. Aerospace and Defense
- 2.5. Chemical
- 2.6. Construction
- 2.7. Healthcare
- 2.8. Food and Beverage
- 2.9. Other End-user Verticals
Pipeline Transportation Software Market Segmentation By Geography
- 1. North America
- 2. Europe
- 3. Asia Pacific
- 4. Latin America
- 5. Middle East
Pipeline Transportation Software Market REPORT HIGHLIGHTS
| Aspects | Details |
|---|---|
| Study Period | 2019-2033 |
| Base Year | 2024 |
| Estimated Year | 2025 |
| Forecast Period | 2025-2033 |
| Historical Period | 2019-2024 |
| Growth Rate | CAGR of 8.13% from 2019-2033 |
| Segmentation |
|
Table of Contents
- 1. Introduction
- 1.1. Research Scope
- 1.2. Market Segmentation
- 1.3. Research Methodology
- 1.4. Definitions and Assumptions
- 2. Executive Summary
- 2.1. Introduction
- 3. Market Dynamics
- 3.1. Introduction
- 3.2. Market Drivers
- 3.2.1. Increasing Volume of Cargo; Establishment of New Ports in Developing Countries
- 3.3. Market Restrains
- 3.3.1. Stringent Emission Laws and Policies
- 3.4. Market Trends
- 3.4.1. Establishment of New Ports in Developing Countries is Expected to Drive the Market
- 4. Market Factor Analysis
- 4.1. Porters Five Forces
- 4.2. Supply/Value Chain
- 4.3. PESTEL analysis
- 4.4. Market Entropy
- 4.5. Patent/Trademark Analysis
- 5. Global Pipeline Transportation Software Market Analysis, Insights and Forecast, 2019-2031
- 5.1. Market Analysis, Insights and Forecast - by Deployment
- 5.1.1. On-premise
- 5.1.2. Cloud
- 5.1.3. Hybrid
- 5.2. Market Analysis, Insights and Forecast - by End-user Vertical
- 5.2.1. Retail
- 5.2.2. Oil and Gas
- 5.2.3. Manufacturing and Industrial
- 5.2.4. Aerospace and Defense
- 5.2.5. Chemical
- 5.2.6. Construction
- 5.2.7. Healthcare
- 5.2.8. Food and Beverage
- 5.2.9. Other End-user Verticals
- 5.3. Market Analysis, Insights and Forecast - by Region
- 5.3.1. North America
- 5.3.2. Europe
- 5.3.3. Asia Pacific
- 5.3.4. Latin America
- 5.3.5. Middle East
- 5.1. Market Analysis, Insights and Forecast - by Deployment
- 6. North America Pipeline Transportation Software Market Analysis, Insights and Forecast, 2019-2031
- 6.1. Market Analysis, Insights and Forecast - by Deployment
- 6.1.1. On-premise
- 6.1.2. Cloud
- 6.1.3. Hybrid
- 6.2. Market Analysis, Insights and Forecast - by End-user Vertical
- 6.2.1. Retail
- 6.2.2. Oil and Gas
- 6.2.3. Manufacturing and Industrial
- 6.2.4. Aerospace and Defense
- 6.2.5. Chemical
- 6.2.6. Construction
- 6.2.7. Healthcare
- 6.2.8. Food and Beverage
- 6.2.9. Other End-user Verticals
- 6.1. Market Analysis, Insights and Forecast - by Deployment
- 7. Europe Pipeline Transportation Software Market Analysis, Insights and Forecast, 2019-2031
- 7.1. Market Analysis, Insights and Forecast - by Deployment
- 7.1.1. On-premise
- 7.1.2. Cloud
- 7.1.3. Hybrid
- 7.2. Market Analysis, Insights and Forecast - by End-user Vertical
- 7.2.1. Retail
- 7.2.2. Oil and Gas
- 7.2.3. Manufacturing and Industrial
- 7.2.4. Aerospace and Defense
- 7.2.5. Chemical
- 7.2.6. Construction
- 7.2.7. Healthcare
- 7.2.8. Food and Beverage
- 7.2.9. Other End-user Verticals
- 7.1. Market Analysis, Insights and Forecast - by Deployment
- 8. Asia Pacific Pipeline Transportation Software Market Analysis, Insights and Forecast, 2019-2031
- 8.1. Market Analysis, Insights and Forecast - by Deployment
- 8.1.1. On-premise
- 8.1.2. Cloud
- 8.1.3. Hybrid
- 8.2. Market Analysis, Insights and Forecast - by End-user Vertical
- 8.2.1. Retail
- 8.2.2. Oil and Gas
- 8.2.3. Manufacturing and Industrial
- 8.2.4. Aerospace and Defense
- 8.2.5. Chemical
- 8.2.6. Construction
- 8.2.7. Healthcare
- 8.2.8. Food and Beverage
- 8.2.9. Other End-user Verticals
- 8.1. Market Analysis, Insights and Forecast - by Deployment
- 9. Latin America Pipeline Transportation Software Market Analysis, Insights and Forecast, 2019-2031
- 9.1. Market Analysis, Insights and Forecast - by Deployment
- 9.1.1. On-premise
- 9.1.2. Cloud
- 9.1.3. Hybrid
- 9.2. Market Analysis, Insights and Forecast - by End-user Vertical
- 9.2.1. Retail
- 9.2.2. Oil and Gas
- 9.2.3. Manufacturing and Industrial
- 9.2.4. Aerospace and Defense
- 9.2.5. Chemical
- 9.2.6. Construction
- 9.2.7. Healthcare
- 9.2.8. Food and Beverage
- 9.2.9. Other End-user Verticals
- 9.1. Market Analysis, Insights and Forecast - by Deployment
- 10. Middle East Pipeline Transportation Software Market Analysis, Insights and Forecast, 2019-2031
- 10.1. Market Analysis, Insights and Forecast - by Deployment
- 10.1.1. On-premise
- 10.1.2. Cloud
- 10.1.3. Hybrid
- 10.2. Market Analysis, Insights and Forecast - by End-user Vertical
- 10.2.1. Retail
- 10.2.2. Oil and Gas
- 10.2.3. Manufacturing and Industrial
- 10.2.4. Aerospace and Defense
- 10.2.5. Chemical
- 10.2.6. Construction
- 10.2.7. Healthcare
- 10.2.8. Food and Beverage
- 10.2.9. Other End-user Verticals
- 10.1. Market Analysis, Insights and Forecast - by Deployment
- 11. North America Pipeline Transportation Software Market Analysis, Insights and Forecast, 2019-2031
- 11.1. Market Analysis, Insights and Forecast - By Country/Sub-region
- 11.1.1.
- 12. Europe Pipeline Transportation Software Market Analysis, Insights and Forecast, 2019-2031
- 12.1. Market Analysis, Insights and Forecast - By Country/Sub-region
- 12.1.1.
- 13. Asia Pacific Pipeline Transportation Software Market Analysis, Insights and Forecast, 2019-2031
- 13.1. Market Analysis, Insights and Forecast - By Country/Sub-region
- 13.1.1.
- 14. Latin America Pipeline Transportation Software Market Analysis, Insights and Forecast, 2019-2031
- 14.1. Market Analysis, Insights and Forecast - By Country/Sub-region
- 14.1.1.
- 15. Middle East Pipeline Transportation Software Market Analysis, Insights and Forecast, 2019-2031
- 15.1. Market Analysis, Insights and Forecast - By Country/Sub-region
- 15.1.1.
- 16. Competitive Analysis
- 16.1. Global Market Share Analysis 2024
- 16.2. Company Profiles
- 16.2.1 Accenture PLC
- 16.2.1.1. Overview
- 16.2.1.2. Products
- 16.2.1.3. SWOT Analysis
- 16.2.1.4. Recent Developments
- 16.2.1.5. Financials (Based on Availability)
- 16.2.2 Trans-i Technologies Inc
- 16.2.2.1. Overview
- 16.2.2.2. Products
- 16.2.2.3. SWOT Analysis
- 16.2.2.4. Recent Developments
- 16.2.2.5. Financials (Based on Availability)
- 16.2.3 Descartes Systems Group
- 16.2.3.1. Overview
- 16.2.3.2. Products
- 16.2.3.3. SWOT Analysis
- 16.2.3.4. Recent Developments
- 16.2.3.5. Financials (Based on Availability)
- 16.2.4 Veson Nautical Corporation
- 16.2.4.1. Overview
- 16.2.4.2. Products
- 16.2.4.3. SWOT Analysis
- 16.2.4.4. Recent Developments
- 16.2.4.5. Financials (Based on Availability)
- 16.2.5 Cognizant Technology Solutions Corp
- 16.2.5.1. Overview
- 16.2.5.2. Products
- 16.2.5.3. SWOT Analysis
- 16.2.5.4. Recent Developments
- 16.2.5.5. Financials (Based on Availability)
- 16.2.6 HighJump Software Inc
- 16.2.6.1. Overview
- 16.2.6.2. Products
- 16.2.6.3. SWOT Analysis
- 16.2.6.4. Recent Developments
- 16.2.6.5. Financials (Based on Availability)
- 16.2.7 Bass Software Ltd *List Not Exhaustive
- 16.2.7.1. Overview
- 16.2.7.2. Products
- 16.2.7.3. SWOT Analysis
- 16.2.7.4. Recent Developments
- 16.2.7.5. Financials (Based on Availability)
- 16.2.8 SAP SE
- 16.2.8.1. Overview
- 16.2.8.2. Products
- 16.2.8.3. SWOT Analysis
- 16.2.8.4. Recent Developments
- 16.2.8.5. Financials (Based on Availability)
- 16.2.9 DNV GL (GL Maritime Software GmbH
- 16.2.9.1. Overview
- 16.2.9.2. Products
- 16.2.9.3. SWOT Analysis
- 16.2.9.4. Recent Developments
- 16.2.9.5. Financials (Based on Availability)
- 16.2.10 Aljex Software Inc
- 16.2.10.1. Overview
- 16.2.10.2. Products
- 16.2.10.3. SWOT Analysis
- 16.2.10.4. Recent Developments
- 16.2.10.5. Financials (Based on Availability)
- 16.2.1 Accenture PLC
List of Figures
- Figure 1: Global Pipeline Transportation Software Market Revenue Breakdown (Million, %) by Region 2024 & 2032
- Figure 2: North America Pipeline Transportation Software Market Revenue (Million), by Country 2024 & 2032
- Figure 3: North America Pipeline Transportation Software Market Revenue Share (%), by Country 2024 & 2032
- Figure 4: Europe Pipeline Transportation Software Market Revenue (Million), by Country 2024 & 2032
- Figure 5: Europe Pipeline Transportation Software Market Revenue Share (%), by Country 2024 & 2032
- Figure 6: Asia Pacific Pipeline Transportation Software Market Revenue (Million), by Country 2024 & 2032
- Figure 7: Asia Pacific Pipeline Transportation Software Market Revenue Share (%), by Country 2024 & 2032
- Figure 8: Latin America Pipeline Transportation Software Market Revenue (Million), by Country 2024 & 2032
- Figure 9: Latin America Pipeline Transportation Software Market Revenue Share (%), by Country 2024 & 2032
- Figure 10: Middle East Pipeline Transportation Software Market Revenue (Million), by Country 2024 & 2032
- Figure 11: Middle East Pipeline Transportation Software Market Revenue Share (%), by Country 2024 & 2032
- Figure 12: North America Pipeline Transportation Software Market Revenue (Million), by Deployment 2024 & 2032
- Figure 13: North America Pipeline Transportation Software Market Revenue Share (%), by Deployment 2024 & 2032
- Figure 14: North America Pipeline Transportation Software Market Revenue (Million), by End-user Vertical 2024 & 2032
- Figure 15: North America Pipeline Transportation Software Market Revenue Share (%), by End-user Vertical 2024 & 2032
- Figure 16: North America Pipeline Transportation Software Market Revenue (Million), by Country 2024 & 2032
- Figure 17: North America Pipeline Transportation Software Market Revenue Share (%), by Country 2024 & 2032
- Figure 18: Europe Pipeline Transportation Software Market Revenue (Million), by Deployment 2024 & 2032
- Figure 19: Europe Pipeline Transportation Software Market Revenue Share (%), by Deployment 2024 & 2032
- Figure 20: Europe Pipeline Transportation Software Market Revenue (Million), by End-user Vertical 2024 & 2032
- Figure 21: Europe Pipeline Transportation Software Market Revenue Share (%), by End-user Vertical 2024 & 2032
- Figure 22: Europe Pipeline Transportation Software Market Revenue (Million), by Country 2024 & 2032
- Figure 23: Europe Pipeline Transportation Software Market Revenue Share (%), by Country 2024 & 2032
- Figure 24: Asia Pacific Pipeline Transportation Software Market Revenue (Million), by Deployment 2024 & 2032
- Figure 25: Asia Pacific Pipeline Transportation Software Market Revenue Share (%), by Deployment 2024 & 2032
- Figure 26: Asia Pacific Pipeline Transportation Software Market Revenue (Million), by End-user Vertical 2024 & 2032
- Figure 27: Asia Pacific Pipeline Transportation Software Market Revenue Share (%), by End-user Vertical 2024 & 2032
- Figure 28: Asia Pacific Pipeline Transportation Software Market Revenue (Million), by Country 2024 & 2032
- Figure 29: Asia Pacific Pipeline Transportation Software Market Revenue Share (%), by Country 2024 & 2032
- Figure 30: Latin America Pipeline Transportation Software Market Revenue (Million), by Deployment 2024 & 2032
- Figure 31: Latin America Pipeline Transportation Software Market Revenue Share (%), by Deployment 2024 & 2032
- Figure 32: Latin America Pipeline Transportation Software Market Revenue (Million), by End-user Vertical 2024 & 2032
- Figure 33: Latin America Pipeline Transportation Software Market Revenue Share (%), by End-user Vertical 2024 & 2032
- Figure 34: Latin America Pipeline Transportation Software Market Revenue (Million), by Country 2024 & 2032
- Figure 35: Latin America Pipeline Transportation Software Market Revenue Share (%), by Country 2024 & 2032
- Figure 36: Middle East Pipeline Transportation Software Market Revenue (Million), by Deployment 2024 & 2032
- Figure 37: Middle East Pipeline Transportation Software Market Revenue Share (%), by Deployment 2024 & 2032
- Figure 38: Middle East Pipeline Transportation Software Market Revenue (Million), by End-user Vertical 2024 & 2032
- Figure 39: Middle East Pipeline Transportation Software Market Revenue Share (%), by End-user Vertical 2024 & 2032
- Figure 40: Middle East Pipeline Transportation Software Market Revenue (Million), by Country 2024 & 2032
- Figure 41: Middle East Pipeline Transportation Software Market Revenue Share (%), by Country 2024 & 2032
List of Tables
- Table 1: Global Pipeline Transportation Software Market Revenue Million Forecast, by Region 2019 & 2032
- Table 2: Global Pipeline Transportation Software Market Revenue Million Forecast, by Deployment 2019 & 2032
- Table 3: Global Pipeline Transportation Software Market Revenue Million Forecast, by End-user Vertical 2019 & 2032
- Table 4: Global Pipeline Transportation Software Market Revenue Million Forecast, by Region 2019 & 2032
- Table 5: Global Pipeline Transportation Software Market Revenue Million Forecast, by Country 2019 & 2032
- Table 6: Pipeline Transportation Software Market Revenue (Million) Forecast, by Application 2019 & 2032
- Table 7: Global Pipeline Transportation Software Market Revenue Million Forecast, by Country 2019 & 2032
- Table 8: Pipeline Transportation Software Market Revenue (Million) Forecast, by Application 2019 & 2032
- Table 9: Global Pipeline Transportation Software Market Revenue Million Forecast, by Country 2019 & 2032
- Table 10: Pipeline Transportation Software Market Revenue (Million) Forecast, by Application 2019 & 2032
- Table 11: Global Pipeline Transportation Software Market Revenue Million Forecast, by Country 2019 & 2032
- Table 12: Pipeline Transportation Software Market Revenue (Million) Forecast, by Application 2019 & 2032
- Table 13: Global Pipeline Transportation Software Market Revenue Million Forecast, by Country 2019 & 2032
- Table 14: Pipeline Transportation Software Market Revenue (Million) Forecast, by Application 2019 & 2032
- Table 15: Global Pipeline Transportation Software Market Revenue Million Forecast, by Deployment 2019 & 2032
- Table 16: Global Pipeline Transportation Software Market Revenue Million Forecast, by End-user Vertical 2019 & 2032
- Table 17: Global Pipeline Transportation Software Market Revenue Million Forecast, by Country 2019 & 2032
- Table 18: Global Pipeline Transportation Software Market Revenue Million Forecast, by Deployment 2019 & 2032
- Table 19: Global Pipeline Transportation Software Market Revenue Million Forecast, by End-user Vertical 2019 & 2032
- Table 20: Global Pipeline Transportation Software Market Revenue Million Forecast, by Country 2019 & 2032
- Table 21: Global Pipeline Transportation Software Market Revenue Million Forecast, by Deployment 2019 & 2032
- Table 22: Global Pipeline Transportation Software Market Revenue Million Forecast, by End-user Vertical 2019 & 2032
- Table 23: Global Pipeline Transportation Software Market Revenue Million Forecast, by Country 2019 & 2032
- Table 24: Global Pipeline Transportation Software Market Revenue Million Forecast, by Deployment 2019 & 2032
- Table 25: Global Pipeline Transportation Software Market Revenue Million Forecast, by End-user Vertical 2019 & 2032
- Table 26: Global Pipeline Transportation Software Market Revenue Million Forecast, by Country 2019 & 2032
- Table 27: Global Pipeline Transportation Software Market Revenue Million Forecast, by Deployment 2019 & 2032
- Table 28: Global Pipeline Transportation Software Market Revenue Million Forecast, by End-user Vertical 2019 & 2032
- Table 29: Global Pipeline Transportation Software Market Revenue Million Forecast, by Country 2019 & 2032
Frequently Asked Questions
1. What is the projected Compound Annual Growth Rate (CAGR) of the Pipeline Transportation Software Market?
The projected CAGR is approximately 8.13%.
2. Which companies are prominent players in the Pipeline Transportation Software Market?
Key companies in the market include Accenture PLC, Trans-i Technologies Inc, Descartes Systems Group, Veson Nautical Corporation, Cognizant Technology Solutions Corp, HighJump Software Inc, Bass Software Ltd *List Not Exhaustive, SAP SE, DNV GL (GL Maritime Software GmbH, Aljex Software Inc.
3. What are the main segments of the Pipeline Transportation Software Market?
The market segments include Deployment, End-user Vertical.
4. Can you provide details about the market size?
The market size is estimated to be USD 96.29 Million as of 2022.
5. What are some drivers contributing to market growth?
Increasing Volume of Cargo; Establishment of New Ports in Developing Countries.
6. What are the notable trends driving market growth?
Establishment of New Ports in Developing Countries is Expected to Drive the Market.
7. Are there any restraints impacting market growth?
Stringent Emission Laws and Policies.
8. Can you provide examples of recent developments in the market?
April 2023: Serbia's government announced to invest EUR 28 million (USD 30.6 million) in the overall development of river transport infrastructure all over the country as a crucial part of the Sail Through Serbia government initiative. The Sail Through Serbia initiative envisages the construction of new piers, marinas, and the increasing volume of river traffic throughout the country, thereby facilitating the market's growth opportunities.
9. What pricing options are available for accessing the report?
Pricing options include single-user, multi-user, and enterprise licenses priced at USD 4750, USD 5250, and USD 8750 respectively.
10. Is the market size provided in terms of value or volume?
The market size is provided in terms of value, measured in Million.
11. Are there any specific market keywords associated with the report?
Yes, the market keyword associated with the report is "Pipeline Transportation Software Market," which aids in identifying and referencing the specific market segment covered.
12. How do I determine which pricing option suits my needs best?
The pricing options vary based on user requirements and access needs. Individual users may opt for single-user licenses, while businesses requiring broader access may choose multi-user or enterprise licenses for cost-effective access to the report.
13. Are there any additional resources or data provided in the Pipeline Transportation Software Market report?
While the report offers comprehensive insights, it's advisable to review the specific contents or supplementary materials provided to ascertain if additional resources or data are available.
14. How can I stay updated on further developments or reports in the Pipeline Transportation Software Market?
To stay informed about further developments, trends, and reports in the Pipeline Transportation Software Market, consider subscribing to industry newsletters, following relevant companies and organizations, or regularly checking reputable industry news sources and publications.
Methodology
Step 1 - Identification of Relevant Samples Size from Population Database


Step 2 - Approaches for Defining Global Market Size (Value, Volume* & Price*)

Note*: In applicable scenarios
Step 3 - Data Sources
Primary Research
- Web Analytics
- Survey Reports
- Research Institute
- Latest Research Reports
- Opinion Leaders
Secondary Research
- Annual Reports
- White Paper
- Latest Press Release
- Industry Association
- Paid Database
- Investor Presentations

Step 4 - Data Triangulation
Involves using different sources of information in order to increase the validity of a study
These sources are likely to be stakeholders in a program - participants, other researchers, program staff, other community members, and so on.
Then we put all data in single framework & apply various statistical tools to find out the dynamic on the market.
During the analysis stage, feedback from the stakeholder groups would be compared to determine areas of agreement as well as areas of divergence
