

Key Insights
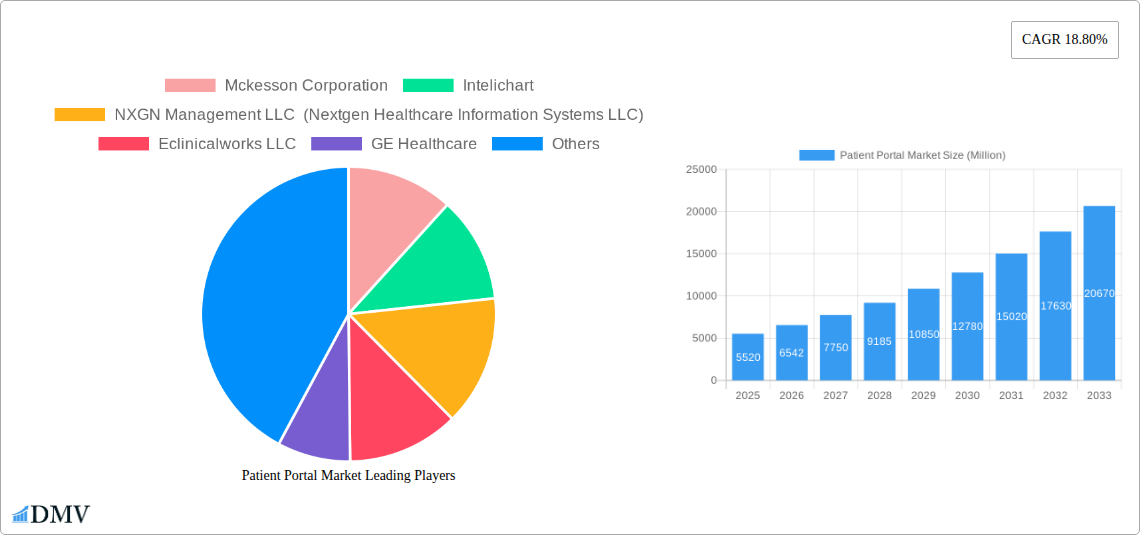
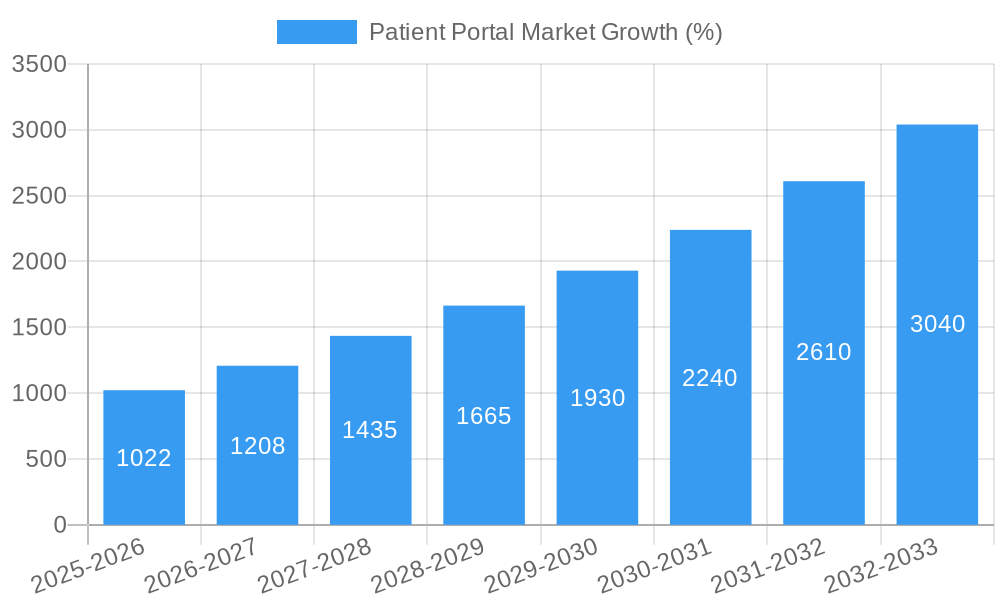
The global patient portal market is experiencing robust growth, projected to reach $5.52 billion in 2025 and maintain a Compound Annual Growth Rate (CAGR) of 18.80% from 2025 to 2033. This expansion is driven by several key factors. The increasing adoption of electronic health records (EHRs) and the rising demand for improved patient engagement and healthcare accessibility are significantly boosting market growth. Patients are increasingly seeking convenient methods to access their health information, schedule appointments, communicate with healthcare providers, and manage their medications, leading to higher demand for user-friendly patient portals. Furthermore, the growing emphasis on value-based care models and the need for better care coordination further propel market adoption. Government initiatives promoting telehealth and digital health solutions also contribute to the market's upward trajectory. The market is segmented by portal type (integrated and standalone), deployment mode (cloud-based, on-premise, and web-based), and end-user (hospitals and clinics, pharmacies, and other end-users). Cloud-based patient portals are gaining significant traction due to their scalability, cost-effectiveness, and accessibility.
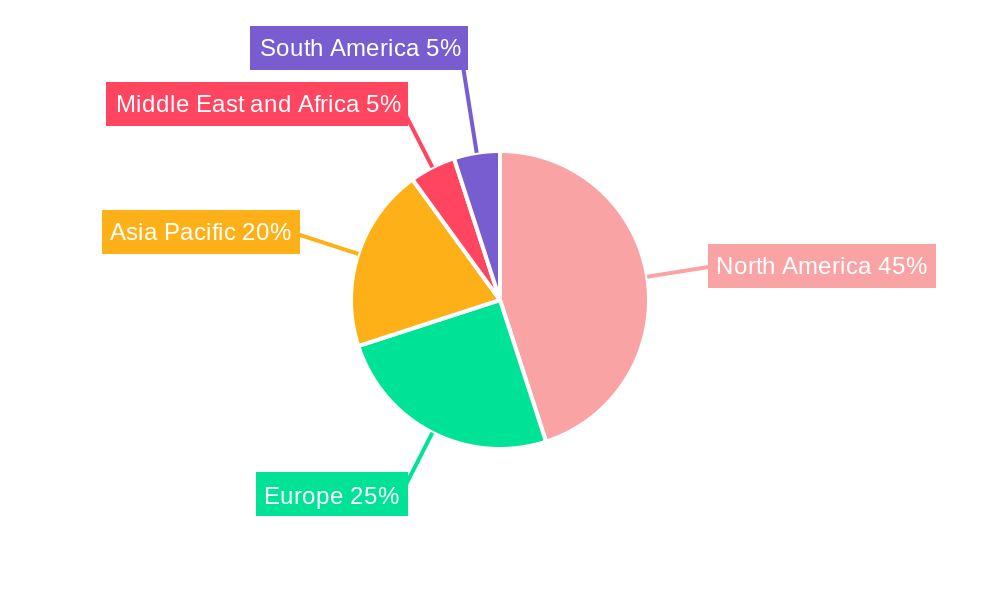
The North American region currently dominates the patient portal market, driven by high healthcare expenditure, advanced technological infrastructure, and early adoption of digital health technologies. However, the Asia-Pacific region is expected to witness substantial growth in the coming years due to increasing healthcare investment, rising smartphone penetration, and growing awareness of the benefits of patient portals. The competitive landscape is characterized by a mix of established players like McKesson Corporation, Epic Corporation Inc., and Cerner Corporation, and smaller, specialized providers. These companies are focusing on innovation, strategic partnerships, and acquisitions to enhance their market position and cater to evolving customer needs. The market is poised for continued expansion as healthcare providers and patients alike recognize the significant benefits of seamless, digital patient engagement. Factors like data security concerns and the digital literacy gap among certain patient populations represent potential restraints, but the overall market outlook remains highly positive.
Patient Portal Market: A Comprehensive Report (2019-2033)
This insightful report provides a detailed analysis of the Patient Portal Market, projecting significant growth from 2025 to 2033. The study covers market size, segmentation, leading players, technological advancements, and future opportunities, equipping stakeholders with the knowledge needed to navigate this dynamic sector. The report leverages data from the historical period (2019-2024), with 2025 serving as the base and estimated year, providing a robust forecast extending to 2033. The total market value is projected to reach xx Million by 2033.
Patient Portal Market Composition & Trends
The Patient Portal Market is experiencing robust growth, driven by increasing digital health adoption and the need for enhanced patient engagement. Market concentration is moderate, with several key players holding significant shares but not dominating completely. The market is characterized by continuous innovation, with companies investing heavily in user-friendly interfaces, advanced analytics, and seamless integrations with Electronic Health Records (EHR) systems. Regulatory landscapes, particularly HIPAA compliance in the US and GDPR in Europe, heavily influence market practices. Substitute products, such as traditional appointment scheduling and paper-based communication, are gradually losing market share to the convenience and efficiency offered by patient portals. End-users primarily include Hospitals and Clinics, Pharmacies, and other healthcare providers. M&A activity has been notable, with several significant deals valued at xx Million collectively over the past five years, reflecting the industry's consolidation trend.
- Market Share Distribution (2024): Mckesson Corporation (xx%), Epic Corporation Inc (xx%), Cerner Corporation (xx%), Allscripts Healthcare Solutions Inc (xx%), Others (xx%).
- M&A Deal Value (2019-2024): xx Million
Patient Portal Market Industry Evolution
The Patient Portal Market has witnessed exponential growth, transitioning from a niche technology to a mainstream healthcare solution. The Compound Annual Growth Rate (CAGR) from 2019 to 2024 was approximately xx%, driven primarily by increasing smartphone penetration, rising healthcare costs prompting efficiency improvements, and government initiatives promoting telehealth and digital health. Technological advancements, particularly in cloud computing, artificial intelligence, and mobile application development, have significantly enhanced patient portal functionality and accessibility. Consumer demand for convenient, secure, and personalized healthcare experiences fuels market expansion. The adoption rate of patient portals is steadily increasing, with xx% of patients in developed countries using them in 2024, and projections suggesting a further increase to xx% by 2033. Integration with wearable technology and remote patient monitoring systems is poised to further accelerate growth.
Leading Regions, Countries, or Segments in Patient Portal Market
The North American region holds the dominant position in the Patient Portal Market, driven by strong technological infrastructure, high healthcare spending, and advanced regulatory frameworks. Within this region, the United States contributes the largest share, followed by Canada. The European market is also experiencing significant growth, propelled by increasing government investments in digital health initiatives.
Dominant Segments:
- Portal: Integrated Patient Portals hold a larger market share due to their comprehensive functionality.
- Deployment Mode: Cloud-based deployments are rapidly gaining traction due to their scalability and cost-effectiveness.
- End-User: Hospitals and Clinics represent the largest segment, followed by Pharmacies.
Key Drivers:
- North America: High healthcare expenditure, robust IT infrastructure, and early adoption of digital health technologies.
- Europe: Growing government support for digital health, rising demand for patient-centric care, and stringent data privacy regulations driving secure solutions.
Patient Portal Market Product Innovations
Recent innovations focus on improving user experience, enhancing security, and expanding functionalities. Many portals now incorporate features such as appointment scheduling, medication reminders, secure messaging, telehealth capabilities, and personalized health information dashboards. Artificial intelligence is being integrated to enhance features like appointment optimization and risk stratification. Key performance indicators (KPIs) include user engagement rates, patient satisfaction scores, and reduction in no-show appointments. The emphasis is on creating intuitive and accessible portals that effectively facilitate communication and improve the overall patient experience.
Propelling Factors for Patient Portal Market Growth
Technological advancements, including cloud-based solutions and AI integration, are significantly driving market growth. Economic factors such as rising healthcare costs and the need for cost-effective solutions are also important. Government regulations promoting telehealth and interoperability are creating a favorable environment for adoption. For example, initiatives promoting electronic health records (EHR) adoption indirectly fuel demand for patient portals, which enhance the utility of EHR systems.
Obstacles in the Patient Portal Market
Barriers to market growth include high initial investment costs for implementation and integration, concerns about data security and privacy, and the need for comprehensive staff training. Interoperability challenges across different healthcare systems can hinder seamless data exchange. Competition among established vendors and emerging players creates a challenging market landscape.
Future Opportunities in Patient Portal Market
Expanding into emerging markets, particularly in Asia and Africa, presents significant growth potential. Integration with wearable devices and advancements in AI and machine learning will lead to new functionalities, such as predictive analytics and personalized health recommendations. The increasing adoption of remote patient monitoring will further fuel demand for portals capable of integrating these technologies. Focus on improving patient engagement with gamification and personalized content offers additional avenues for growth.
Major Players in the Patient Portal Market Ecosystem
- Mckesson Corporation
- Intelichart
- NXGN Management LLC (Nextgen Healthcare Information Systems LLC)
- Eclinicalworks LLC
- GE Healthcare
- Curemd Healthcare
- Epic Corporation Inc
- Greenway Health LLC
- Oracle (Cerner Corporation)
- Allscripts Healthcare Solutions Inc
- Athenahealth Inc
Key Developments in Patient Portal Market Industry
- March 2022: Tata Elxsi launched TEngage, a cloud-based digital health platform enhancing unified patient experience.
- November 2022: Valant launched MYIO, a behavioral health-specific patient engagement app improving operational efficiency.
Strategic Patient Portal Market Forecast
The Patient Portal Market is poised for continued growth, driven by the convergence of technological advancements, regulatory support, and increasing patient demand for convenient healthcare access. Expanding functionalities, improved integration capabilities, and the rising adoption of telehealth will propel market expansion throughout the forecast period. The market is expected to witness significant growth, exceeding xx Million by 2033, making it a compelling investment opportunity for both established and emerging players.
Patient Portal Market Segmentation
-
1. Portal
- 1.1. Integrated Patient Portal
- 1.2. Standalone Patient Portal
-
2. Deployment Mode
- 2.1. Cloud-based
- 2.2. On-Premise and Web-based
-
3. End-User
- 3.1. Hospitals and Clinics
- 3.2. Pharmacies
- 3.3. Other End-Users
Patient Portal Market Segmentation By Geography
-
1. North America
- 1.1. United States
- 1.2. Canada
- 1.3. Mexico
-
2. Europe
- 2.1. United Kingdom
- 2.2. Germany
- 2.3. France
- 2.4. Italy
- 2.5. Spain
- 2.6. Rest of Europe
-
3. Asia Pacific
- 3.1. China
- 3.2. Japan
- 3.3. India
- 3.4. Australia
- 3.5. South Korea
- 3.6. Rest of Asia Pacific
-
4. Middle East and Africa
- 4.1. GCC
- 4.2. South Africa
- 4.3. Rest of Middle East and Africa
-
5. South America
- 5.1. Brazil
- 5.2. Argentina
- 5.3. Rest of South America
Patient Portal Market REPORT HIGHLIGHTS
| Aspects | Details |
|---|---|
| Study Period | 2019-2033 |
| Base Year | 2024 |
| Estimated Year | 2025 |
| Forecast Period | 2025-2033 |
| Historical Period | 2019-2024 |
| Growth Rate | CAGR of 18.80% from 2019-2033 |
| Segmentation |
|
Table of Contents
- 1. Introduction
- 1.1. Research Scope
- 1.2. Market Segmentation
- 1.3. Research Methodology
- 1.4. Definitions and Assumptions
- 2. Executive Summary
- 2.1. Introduction
- 3. Market Dynamics
- 3.1. Introduction
- 3.2. Market Drivers
- 3.2.1. Increased Adoption of Patient-centric Approach by Healthcare Payers; Increase in the Demand for Electronic Health Records (EHRs); Favorable Government Funding Policies and Initiatives for Implementing Healthcare IT Solutions
- 3.3. Market Restrains
- 3.3.1. Data Privacy and Security Concerns; High Cost of Implementation and Deployment
- 3.4. Market Trends
- 3.4.1. Integrated Patient Portal Holds the Largest Share in the Portal Segment expected to hold a major market share in the Patient Portalmarket
- 4. Market Factor Analysis
- 4.1. Porters Five Forces
- 4.2. Supply/Value Chain
- 4.3. PESTEL analysis
- 4.4. Market Entropy
- 4.5. Patent/Trademark Analysis
- 5. Global Patient Portal Market Analysis, Insights and Forecast, 2019-2031
- 5.1. Market Analysis, Insights and Forecast - by Portal
- 5.1.1. Integrated Patient Portal
- 5.1.2. Standalone Patient Portal
- 5.2. Market Analysis, Insights and Forecast - by Deployment Mode
- 5.2.1. Cloud-based
- 5.2.2. On-Premise and Web-based
- 5.3. Market Analysis, Insights and Forecast - by End-User
- 5.3.1. Hospitals and Clinics
- 5.3.2. Pharmacies
- 5.3.3. Other End-Users
- 5.4. Market Analysis, Insights and Forecast - by Region
- 5.4.1. North America
- 5.4.2. Europe
- 5.4.3. Asia Pacific
- 5.4.4. Middle East and Africa
- 5.4.5. South America
- 5.1. Market Analysis, Insights and Forecast - by Portal
- 6. North America Patient Portal Market Analysis, Insights and Forecast, 2019-2031
- 6.1. Market Analysis, Insights and Forecast - by Portal
- 6.1.1. Integrated Patient Portal
- 6.1.2. Standalone Patient Portal
- 6.2. Market Analysis, Insights and Forecast - by Deployment Mode
- 6.2.1. Cloud-based
- 6.2.2. On-Premise and Web-based
- 6.3. Market Analysis, Insights and Forecast - by End-User
- 6.3.1. Hospitals and Clinics
- 6.3.2. Pharmacies
- 6.3.3. Other End-Users
- 6.1. Market Analysis, Insights and Forecast - by Portal
- 7. Europe Patient Portal Market Analysis, Insights and Forecast, 2019-2031
- 7.1. Market Analysis, Insights and Forecast - by Portal
- 7.1.1. Integrated Patient Portal
- 7.1.2. Standalone Patient Portal
- 7.2. Market Analysis, Insights and Forecast - by Deployment Mode
- 7.2.1. Cloud-based
- 7.2.2. On-Premise and Web-based
- 7.3. Market Analysis, Insights and Forecast - by End-User
- 7.3.1. Hospitals and Clinics
- 7.3.2. Pharmacies
- 7.3.3. Other End-Users
- 7.1. Market Analysis, Insights and Forecast - by Portal
- 8. Asia Pacific Patient Portal Market Analysis, Insights and Forecast, 2019-2031
- 8.1. Market Analysis, Insights and Forecast - by Portal
- 8.1.1. Integrated Patient Portal
- 8.1.2. Standalone Patient Portal
- 8.2. Market Analysis, Insights and Forecast - by Deployment Mode
- 8.2.1. Cloud-based
- 8.2.2. On-Premise and Web-based
- 8.3. Market Analysis, Insights and Forecast - by End-User
- 8.3.1. Hospitals and Clinics
- 8.3.2. Pharmacies
- 8.3.3. Other End-Users
- 8.1. Market Analysis, Insights and Forecast - by Portal
- 9. Middle East and Africa Patient Portal Market Analysis, Insights and Forecast, 2019-2031
- 9.1. Market Analysis, Insights and Forecast - by Portal
- 9.1.1. Integrated Patient Portal
- 9.1.2. Standalone Patient Portal
- 9.2. Market Analysis, Insights and Forecast - by Deployment Mode
- 9.2.1. Cloud-based
- 9.2.2. On-Premise and Web-based
- 9.3. Market Analysis, Insights and Forecast - by End-User
- 9.3.1. Hospitals and Clinics
- 9.3.2. Pharmacies
- 9.3.3. Other End-Users
- 9.1. Market Analysis, Insights and Forecast - by Portal
- 10. South America Patient Portal Market Analysis, Insights and Forecast, 2019-2031
- 10.1. Market Analysis, Insights and Forecast - by Portal
- 10.1.1. Integrated Patient Portal
- 10.1.2. Standalone Patient Portal
- 10.2. Market Analysis, Insights and Forecast - by Deployment Mode
- 10.2.1. Cloud-based
- 10.2.2. On-Premise and Web-based
- 10.3. Market Analysis, Insights and Forecast - by End-User
- 10.3.1. Hospitals and Clinics
- 10.3.2. Pharmacies
- 10.3.3. Other End-Users
- 10.1. Market Analysis, Insights and Forecast - by Portal
- 11. North America Patient Portal Market Analysis, Insights and Forecast, 2019-2031
- 11.1. Market Analysis, Insights and Forecast - By Country/Sub-region
- 11.1.1 United States
- 11.1.2 Canada
- 11.1.3 Mexico
- 12. Europe Patient Portal Market Analysis, Insights and Forecast, 2019-2031
- 12.1. Market Analysis, Insights and Forecast - By Country/Sub-region
- 12.1.1 United Kingdom
- 12.1.2 Germany
- 12.1.3 France
- 12.1.4 Italy
- 12.1.5 Spain
- 12.1.6 Rest of Europe
- 13. Asia Pacific Patient Portal Market Analysis, Insights and Forecast, 2019-2031
- 13.1. Market Analysis, Insights and Forecast - By Country/Sub-region
- 13.1.1 China
- 13.1.2 Japan
- 13.1.3 India
- 13.1.4 Australia
- 13.1.5 South Korea
- 13.1.6 Rest of Asia Pacific
- 14. Middle East and Africa Patient Portal Market Analysis, Insights and Forecast, 2019-2031
- 14.1. Market Analysis, Insights and Forecast - By Country/Sub-region
- 14.1.1 GCC
- 14.1.2 South Africa
- 14.1.3 Rest of Middle East and Africa
- 15. South America Patient Portal Market Analysis, Insights and Forecast, 2019-2031
- 15.1. Market Analysis, Insights and Forecast - By Country/Sub-region
- 15.1.1 Brazil
- 15.1.2 Argentina
- 15.1.3 Rest of South America
- 16. Competitive Analysis
- 16.1. Global Market Share Analysis 2024
- 16.2. Company Profiles
- 16.2.1 Mckesson Corporation
- 16.2.1.1. Overview
- 16.2.1.2. Products
- 16.2.1.3. SWOT Analysis
- 16.2.1.4. Recent Developments
- 16.2.1.5. Financials (Based on Availability)
- 16.2.2 Intelichart
- 16.2.2.1. Overview
- 16.2.2.2. Products
- 16.2.2.3. SWOT Analysis
- 16.2.2.4. Recent Developments
- 16.2.2.5. Financials (Based on Availability)
- 16.2.3 NXGN Management LLC (Nextgen Healthcare Information Systems LLC)
- 16.2.3.1. Overview
- 16.2.3.2. Products
- 16.2.3.3. SWOT Analysis
- 16.2.3.4. Recent Developments
- 16.2.3.5. Financials (Based on Availability)
- 16.2.4 Eclinicalworks LLC
- 16.2.4.1. Overview
- 16.2.4.2. Products
- 16.2.4.3. SWOT Analysis
- 16.2.4.4. Recent Developments
- 16.2.4.5. Financials (Based on Availability)
- 16.2.5 GE Healthcare
- 16.2.5.1. Overview
- 16.2.5.2. Products
- 16.2.5.3. SWOT Analysis
- 16.2.5.4. Recent Developments
- 16.2.5.5. Financials (Based on Availability)
- 16.2.6 Curemd Healthcare
- 16.2.6.1. Overview
- 16.2.6.2. Products
- 16.2.6.3. SWOT Analysis
- 16.2.6.4. Recent Developments
- 16.2.6.5. Financials (Based on Availability)
- 16.2.7 Epic Corporation Inc
- 16.2.7.1. Overview
- 16.2.7.2. Products
- 16.2.7.3. SWOT Analysis
- 16.2.7.4. Recent Developments
- 16.2.7.5. Financials (Based on Availability)
- 16.2.8 Greenway Health LLC
- 16.2.8.1. Overview
- 16.2.8.2. Products
- 16.2.8.3. SWOT Analysis
- 16.2.8.4. Recent Developments
- 16.2.8.5. Financials (Based on Availability)
- 16.2.9 Oracle (Cerner Corporation)
- 16.2.9.1. Overview
- 16.2.9.2. Products
- 16.2.9.3. SWOT Analysis
- 16.2.9.4. Recent Developments
- 16.2.9.5. Financials (Based on Availability)
- 16.2.10 Allscripts Healthcare Solutions Inc
- 16.2.10.1. Overview
- 16.2.10.2. Products
- 16.2.10.3. SWOT Analysis
- 16.2.10.4. Recent Developments
- 16.2.10.5. Financials (Based on Availability)
- 16.2.11 Athenahealth Inc
- 16.2.11.1. Overview
- 16.2.11.2. Products
- 16.2.11.3. SWOT Analysis
- 16.2.11.4. Recent Developments
- 16.2.11.5. Financials (Based on Availability)
- 16.2.1 Mckesson Corporation
List of Figures
- Figure 1: Global Patient Portal Market Revenue Breakdown (Million, %) by Region 2024 & 2032
- Figure 2: Global Patient Portal Market Volume Breakdown (K Unit, %) by Region 2024 & 2032
- Figure 3: North America Patient Portal Market Revenue (Million), by Country 2024 & 2032
- Figure 4: North America Patient Portal Market Volume (K Unit), by Country 2024 & 2032
- Figure 5: North America Patient Portal Market Revenue Share (%), by Country 2024 & 2032
- Figure 6: North America Patient Portal Market Volume Share (%), by Country 2024 & 2032
- Figure 7: Europe Patient Portal Market Revenue (Million), by Country 2024 & 2032
- Figure 8: Europe Patient Portal Market Volume (K Unit), by Country 2024 & 2032
- Figure 9: Europe Patient Portal Market Revenue Share (%), by Country 2024 & 2032
- Figure 10: Europe Patient Portal Market Volume Share (%), by Country 2024 & 2032
- Figure 11: Asia Pacific Patient Portal Market Revenue (Million), by Country 2024 & 2032
- Figure 12: Asia Pacific Patient Portal Market Volume (K Unit), by Country 2024 & 2032
- Figure 13: Asia Pacific Patient Portal Market Revenue Share (%), by Country 2024 & 2032
- Figure 14: Asia Pacific Patient Portal Market Volume Share (%), by Country 2024 & 2032
- Figure 15: Middle East and Africa Patient Portal Market Revenue (Million), by Country 2024 & 2032
- Figure 16: Middle East and Africa Patient Portal Market Volume (K Unit), by Country 2024 & 2032
- Figure 17: Middle East and Africa Patient Portal Market Revenue Share (%), by Country 2024 & 2032
- Figure 18: Middle East and Africa Patient Portal Market Volume Share (%), by Country 2024 & 2032
- Figure 19: South America Patient Portal Market Revenue (Million), by Country 2024 & 2032
- Figure 20: South America Patient Portal Market Volume (K Unit), by Country 2024 & 2032
- Figure 21: South America Patient Portal Market Revenue Share (%), by Country 2024 & 2032
- Figure 22: South America Patient Portal Market Volume Share (%), by Country 2024 & 2032
- Figure 23: North America Patient Portal Market Revenue (Million), by Portal 2024 & 2032
- Figure 24: North America Patient Portal Market Volume (K Unit), by Portal 2024 & 2032
- Figure 25: North America Patient Portal Market Revenue Share (%), by Portal 2024 & 2032
- Figure 26: North America Patient Portal Market Volume Share (%), by Portal 2024 & 2032
- Figure 27: North America Patient Portal Market Revenue (Million), by Deployment Mode 2024 & 2032
- Figure 28: North America Patient Portal Market Volume (K Unit), by Deployment Mode 2024 & 2032
- Figure 29: North America Patient Portal Market Revenue Share (%), by Deployment Mode 2024 & 2032
- Figure 30: North America Patient Portal Market Volume Share (%), by Deployment Mode 2024 & 2032
- Figure 31: North America Patient Portal Market Revenue (Million), by End-User 2024 & 2032
- Figure 32: North America Patient Portal Market Volume (K Unit), by End-User 2024 & 2032
- Figure 33: North America Patient Portal Market Revenue Share (%), by End-User 2024 & 2032
- Figure 34: North America Patient Portal Market Volume Share (%), by End-User 2024 & 2032
- Figure 35: North America Patient Portal Market Revenue (Million), by Country 2024 & 2032
- Figure 36: North America Patient Portal Market Volume (K Unit), by Country 2024 & 2032
- Figure 37: North America Patient Portal Market Revenue Share (%), by Country 2024 & 2032
- Figure 38: North America Patient Portal Market Volume Share (%), by Country 2024 & 2032
- Figure 39: Europe Patient Portal Market Revenue (Million), by Portal 2024 & 2032
- Figure 40: Europe Patient Portal Market Volume (K Unit), by Portal 2024 & 2032
- Figure 41: Europe Patient Portal Market Revenue Share (%), by Portal 2024 & 2032
- Figure 42: Europe Patient Portal Market Volume Share (%), by Portal 2024 & 2032
- Figure 43: Europe Patient Portal Market Revenue (Million), by Deployment Mode 2024 & 2032
- Figure 44: Europe Patient Portal Market Volume (K Unit), by Deployment Mode 2024 & 2032
- Figure 45: Europe Patient Portal Market Revenue Share (%), by Deployment Mode 2024 & 2032
- Figure 46: Europe Patient Portal Market Volume Share (%), by Deployment Mode 2024 & 2032
- Figure 47: Europe Patient Portal Market Revenue (Million), by End-User 2024 & 2032
- Figure 48: Europe Patient Portal Market Volume (K Unit), by End-User 2024 & 2032
- Figure 49: Europe Patient Portal Market Revenue Share (%), by End-User 2024 & 2032
- Figure 50: Europe Patient Portal Market Volume Share (%), by End-User 2024 & 2032
- Figure 51: Europe Patient Portal Market Revenue (Million), by Country 2024 & 2032
- Figure 52: Europe Patient Portal Market Volume (K Unit), by Country 2024 & 2032
- Figure 53: Europe Patient Portal Market Revenue Share (%), by Country 2024 & 2032
- Figure 54: Europe Patient Portal Market Volume Share (%), by Country 2024 & 2032
- Figure 55: Asia Pacific Patient Portal Market Revenue (Million), by Portal 2024 & 2032
- Figure 56: Asia Pacific Patient Portal Market Volume (K Unit), by Portal 2024 & 2032
- Figure 57: Asia Pacific Patient Portal Market Revenue Share (%), by Portal 2024 & 2032
- Figure 58: Asia Pacific Patient Portal Market Volume Share (%), by Portal 2024 & 2032
- Figure 59: Asia Pacific Patient Portal Market Revenue (Million), by Deployment Mode 2024 & 2032
- Figure 60: Asia Pacific Patient Portal Market Volume (K Unit), by Deployment Mode 2024 & 2032
- Figure 61: Asia Pacific Patient Portal Market Revenue Share (%), by Deployment Mode 2024 & 2032
- Figure 62: Asia Pacific Patient Portal Market Volume Share (%), by Deployment Mode 2024 & 2032
- Figure 63: Asia Pacific Patient Portal Market Revenue (Million), by End-User 2024 & 2032
- Figure 64: Asia Pacific Patient Portal Market Volume (K Unit), by End-User 2024 & 2032
- Figure 65: Asia Pacific Patient Portal Market Revenue Share (%), by End-User 2024 & 2032
- Figure 66: Asia Pacific Patient Portal Market Volume Share (%), by End-User 2024 & 2032
- Figure 67: Asia Pacific Patient Portal Market Revenue (Million), by Country 2024 & 2032
- Figure 68: Asia Pacific Patient Portal Market Volume (K Unit), by Country 2024 & 2032
- Figure 69: Asia Pacific Patient Portal Market Revenue Share (%), by Country 2024 & 2032
- Figure 70: Asia Pacific Patient Portal Market Volume Share (%), by Country 2024 & 2032
- Figure 71: Middle East and Africa Patient Portal Market Revenue (Million), by Portal 2024 & 2032
- Figure 72: Middle East and Africa Patient Portal Market Volume (K Unit), by Portal 2024 & 2032
- Figure 73: Middle East and Africa Patient Portal Market Revenue Share (%), by Portal 2024 & 2032
- Figure 74: Middle East and Africa Patient Portal Market Volume Share (%), by Portal 2024 & 2032
- Figure 75: Middle East and Africa Patient Portal Market Revenue (Million), by Deployment Mode 2024 & 2032
- Figure 76: Middle East and Africa Patient Portal Market Volume (K Unit), by Deployment Mode 2024 & 2032
- Figure 77: Middle East and Africa Patient Portal Market Revenue Share (%), by Deployment Mode 2024 & 2032
- Figure 78: Middle East and Africa Patient Portal Market Volume Share (%), by Deployment Mode 2024 & 2032
- Figure 79: Middle East and Africa Patient Portal Market Revenue (Million), by End-User 2024 & 2032
- Figure 80: Middle East and Africa Patient Portal Market Volume (K Unit), by End-User 2024 & 2032
- Figure 81: Middle East and Africa Patient Portal Market Revenue Share (%), by End-User 2024 & 2032
- Figure 82: Middle East and Africa Patient Portal Market Volume Share (%), by End-User 2024 & 2032
- Figure 83: Middle East and Africa Patient Portal Market Revenue (Million), by Country 2024 & 2032
- Figure 84: Middle East and Africa Patient Portal Market Volume (K Unit), by Country 2024 & 2032
- Figure 85: Middle East and Africa Patient Portal Market Revenue Share (%), by Country 2024 & 2032
- Figure 86: Middle East and Africa Patient Portal Market Volume Share (%), by Country 2024 & 2032
- Figure 87: South America Patient Portal Market Revenue (Million), by Portal 2024 & 2032
- Figure 88: South America Patient Portal Market Volume (K Unit), by Portal 2024 & 2032
- Figure 89: South America Patient Portal Market Revenue Share (%), by Portal 2024 & 2032
- Figure 90: South America Patient Portal Market Volume Share (%), by Portal 2024 & 2032
- Figure 91: South America Patient Portal Market Revenue (Million), by Deployment Mode 2024 & 2032
- Figure 92: South America Patient Portal Market Volume (K Unit), by Deployment Mode 2024 & 2032
- Figure 93: South America Patient Portal Market Revenue Share (%), by Deployment Mode 2024 & 2032
- Figure 94: South America Patient Portal Market Volume Share (%), by Deployment Mode 2024 & 2032
- Figure 95: South America Patient Portal Market Revenue (Million), by End-User 2024 & 2032
- Figure 96: South America Patient Portal Market Volume (K Unit), by End-User 2024 & 2032
- Figure 97: South America Patient Portal Market Revenue Share (%), by End-User 2024 & 2032
- Figure 98: South America Patient Portal Market Volume Share (%), by End-User 2024 & 2032
- Figure 99: South America Patient Portal Market Revenue (Million), by Country 2024 & 2032
- Figure 100: South America Patient Portal Market Volume (K Unit), by Country 2024 & 2032
- Figure 101: South America Patient Portal Market Revenue Share (%), by Country 2024 & 2032
- Figure 102: South America Patient Portal Market Volume Share (%), by Country 2024 & 2032
List of Tables
- Table 1: Global Patient Portal Market Revenue Million Forecast, by Region 2019 & 2032
- Table 2: Global Patient Portal Market Volume K Unit Forecast, by Region 2019 & 2032
- Table 3: Global Patient Portal Market Revenue Million Forecast, by Portal 2019 & 2032
- Table 4: Global Patient Portal Market Volume K Unit Forecast, by Portal 2019 & 2032
- Table 5: Global Patient Portal Market Revenue Million Forecast, by Deployment Mode 2019 & 2032
- Table 6: Global Patient Portal Market Volume K Unit Forecast, by Deployment Mode 2019 & 2032
- Table 7: Global Patient Portal Market Revenue Million Forecast, by End-User 2019 & 2032
- Table 8: Global Patient Portal Market Volume K Unit Forecast, by End-User 2019 & 2032
- Table 9: Global Patient Portal Market Revenue Million Forecast, by Region 2019 & 2032
- Table 10: Global Patient Portal Market Volume K Unit Forecast, by Region 2019 & 2032
- Table 11: Global Patient Portal Market Revenue Million Forecast, by Country 2019 & 2032
- Table 12: Global Patient Portal Market Volume K Unit Forecast, by Country 2019 & 2032
- Table 13: United States Patient Portal Market Revenue (Million) Forecast, by Application 2019 & 2032
- Table 14: United States Patient Portal Market Volume (K Unit) Forecast, by Application 2019 & 2032
- Table 15: Canada Patient Portal Market Revenue (Million) Forecast, by Application 2019 & 2032
- Table 16: Canada Patient Portal Market Volume (K Unit) Forecast, by Application 2019 & 2032
- Table 17: Mexico Patient Portal Market Revenue (Million) Forecast, by Application 2019 & 2032
- Table 18: Mexico Patient Portal Market Volume (K Unit) Forecast, by Application 2019 & 2032
- Table 19: Global Patient Portal Market Revenue Million Forecast, by Country 2019 & 2032
- Table 20: Global Patient Portal Market Volume K Unit Forecast, by Country 2019 & 2032
- Table 21: United Kingdom Patient Portal Market Revenue (Million) Forecast, by Application 2019 & 2032
- Table 22: United Kingdom Patient Portal Market Volume (K Unit) Forecast, by Application 2019 & 2032
- Table 23: Germany Patient Portal Market Revenue (Million) Forecast, by Application 2019 & 2032
- Table 24: Germany Patient Portal Market Volume (K Unit) Forecast, by Application 2019 & 2032
- Table 25: France Patient Portal Market Revenue (Million) Forecast, by Application 2019 & 2032
- Table 26: France Patient Portal Market Volume (K Unit) Forecast, by Application 2019 & 2032
- Table 27: Italy Patient Portal Market Revenue (Million) Forecast, by Application 2019 & 2032
- Table 28: Italy Patient Portal Market Volume (K Unit) Forecast, by Application 2019 & 2032
- Table 29: Spain Patient Portal Market Revenue (Million) Forecast, by Application 2019 & 2032
- Table 30: Spain Patient Portal Market Volume (K Unit) Forecast, by Application 2019 & 2032
- Table 31: Rest of Europe Patient Portal Market Revenue (Million) Forecast, by Application 2019 & 2032
- Table 32: Rest of Europe Patient Portal Market Volume (K Unit) Forecast, by Application 2019 & 2032
- Table 33: Global Patient Portal Market Revenue Million Forecast, by Country 2019 & 2032
- Table 34: Global Patient Portal Market Volume K Unit Forecast, by Country 2019 & 2032
- Table 35: China Patient Portal Market Revenue (Million) Forecast, by Application 2019 & 2032
- Table 36: China Patient Portal Market Volume (K Unit) Forecast, by Application 2019 & 2032
- Table 37: Japan Patient Portal Market Revenue (Million) Forecast, by Application 2019 & 2032
- Table 38: Japan Patient Portal Market Volume (K Unit) Forecast, by Application 2019 & 2032
- Table 39: India Patient Portal Market Revenue (Million) Forecast, by Application 2019 & 2032
- Table 40: India Patient Portal Market Volume (K Unit) Forecast, by Application 2019 & 2032
- Table 41: Australia Patient Portal Market Revenue (Million) Forecast, by Application 2019 & 2032
- Table 42: Australia Patient Portal Market Volume (K Unit) Forecast, by Application 2019 & 2032
- Table 43: South Korea Patient Portal Market Revenue (Million) Forecast, by Application 2019 & 2032
- Table 44: South Korea Patient Portal Market Volume (K Unit) Forecast, by Application 2019 & 2032
- Table 45: Rest of Asia Pacific Patient Portal Market Revenue (Million) Forecast, by Application 2019 & 2032
- Table 46: Rest of Asia Pacific Patient Portal Market Volume (K Unit) Forecast, by Application 2019 & 2032
- Table 47: Global Patient Portal Market Revenue Million Forecast, by Country 2019 & 2032
- Table 48: Global Patient Portal Market Volume K Unit Forecast, by Country 2019 & 2032
- Table 49: GCC Patient Portal Market Revenue (Million) Forecast, by Application 2019 & 2032
- Table 50: GCC Patient Portal Market Volume (K Unit) Forecast, by Application 2019 & 2032
- Table 51: South Africa Patient Portal Market Revenue (Million) Forecast, by Application 2019 & 2032
- Table 52: South Africa Patient Portal Market Volume (K Unit) Forecast, by Application 2019 & 2032
- Table 53: Rest of Middle East and Africa Patient Portal Market Revenue (Million) Forecast, by Application 2019 & 2032
- Table 54: Rest of Middle East and Africa Patient Portal Market Volume (K Unit) Forecast, by Application 2019 & 2032
- Table 55: Global Patient Portal Market Revenue Million Forecast, by Country 2019 & 2032
- Table 56: Global Patient Portal Market Volume K Unit Forecast, by Country 2019 & 2032
- Table 57: Brazil Patient Portal Market Revenue (Million) Forecast, by Application 2019 & 2032
- Table 58: Brazil Patient Portal Market Volume (K Unit) Forecast, by Application 2019 & 2032
- Table 59: Argentina Patient Portal Market Revenue (Million) Forecast, by Application 2019 & 2032
- Table 60: Argentina Patient Portal Market Volume (K Unit) Forecast, by Application 2019 & 2032
- Table 61: Rest of South America Patient Portal Market Revenue (Million) Forecast, by Application 2019 & 2032
- Table 62: Rest of South America Patient Portal Market Volume (K Unit) Forecast, by Application 2019 & 2032
- Table 63: Global Patient Portal Market Revenue Million Forecast, by Portal 2019 & 2032
- Table 64: Global Patient Portal Market Volume K Unit Forecast, by Portal 2019 & 2032
- Table 65: Global Patient Portal Market Revenue Million Forecast, by Deployment Mode 2019 & 2032
- Table 66: Global Patient Portal Market Volume K Unit Forecast, by Deployment Mode 2019 & 2032
- Table 67: Global Patient Portal Market Revenue Million Forecast, by End-User 2019 & 2032
- Table 68: Global Patient Portal Market Volume K Unit Forecast, by End-User 2019 & 2032
- Table 69: Global Patient Portal Market Revenue Million Forecast, by Country 2019 & 2032
- Table 70: Global Patient Portal Market Volume K Unit Forecast, by Country 2019 & 2032
- Table 71: United States Patient Portal Market Revenue (Million) Forecast, by Application 2019 & 2032
- Table 72: United States Patient Portal Market Volume (K Unit) Forecast, by Application 2019 & 2032
- Table 73: Canada Patient Portal Market Revenue (Million) Forecast, by Application 2019 & 2032
- Table 74: Canada Patient Portal Market Volume (K Unit) Forecast, by Application 2019 & 2032
- Table 75: Mexico Patient Portal Market Revenue (Million) Forecast, by Application 2019 & 2032
- Table 76: Mexico Patient Portal Market Volume (K Unit) Forecast, by Application 2019 & 2032
- Table 77: Global Patient Portal Market Revenue Million Forecast, by Portal 2019 & 2032
- Table 78: Global Patient Portal Market Volume K Unit Forecast, by Portal 2019 & 2032
- Table 79: Global Patient Portal Market Revenue Million Forecast, by Deployment Mode 2019 & 2032
- Table 80: Global Patient Portal Market Volume K Unit Forecast, by Deployment Mode 2019 & 2032
- Table 81: Global Patient Portal Market Revenue Million Forecast, by End-User 2019 & 2032
- Table 82: Global Patient Portal Market Volume K Unit Forecast, by End-User 2019 & 2032
- Table 83: Global Patient Portal Market Revenue Million Forecast, by Country 2019 & 2032
- Table 84: Global Patient Portal Market Volume K Unit Forecast, by Country 2019 & 2032
- Table 85: United Kingdom Patient Portal Market Revenue (Million) Forecast, by Application 2019 & 2032
- Table 86: United Kingdom Patient Portal Market Volume (K Unit) Forecast, by Application 2019 & 2032
- Table 87: Germany Patient Portal Market Revenue (Million) Forecast, by Application 2019 & 2032
- Table 88: Germany Patient Portal Market Volume (K Unit) Forecast, by Application 2019 & 2032
- Table 89: France Patient Portal Market Revenue (Million) Forecast, by Application 2019 & 2032
- Table 90: France Patient Portal Market Volume (K Unit) Forecast, by Application 2019 & 2032
- Table 91: Italy Patient Portal Market Revenue (Million) Forecast, by Application 2019 & 2032
- Table 92: Italy Patient Portal Market Volume (K Unit) Forecast, by Application 2019 & 2032
- Table 93: Spain Patient Portal Market Revenue (Million) Forecast, by Application 2019 & 2032
- Table 94: Spain Patient Portal Market Volume (K Unit) Forecast, by Application 2019 & 2032
- Table 95: Rest of Europe Patient Portal Market Revenue (Million) Forecast, by Application 2019 & 2032
- Table 96: Rest of Europe Patient Portal Market Volume (K Unit) Forecast, by Application 2019 & 2032
- Table 97: Global Patient Portal Market Revenue Million Forecast, by Portal 2019 & 2032
- Table 98: Global Patient Portal Market Volume K Unit Forecast, by Portal 2019 & 2032
- Table 99: Global Patient Portal Market Revenue Million Forecast, by Deployment Mode 2019 & 2032
- Table 100: Global Patient Portal Market Volume K Unit Forecast, by Deployment Mode 2019 & 2032
- Table 101: Global Patient Portal Market Revenue Million Forecast, by End-User 2019 & 2032
- Table 102: Global Patient Portal Market Volume K Unit Forecast, by End-User 2019 & 2032
- Table 103: Global Patient Portal Market Revenue Million Forecast, by Country 2019 & 2032
- Table 104: Global Patient Portal Market Volume K Unit Forecast, by Country 2019 & 2032
- Table 105: China Patient Portal Market Revenue (Million) Forecast, by Application 2019 & 2032
- Table 106: China Patient Portal Market Volume (K Unit) Forecast, by Application 2019 & 2032
- Table 107: Japan Patient Portal Market Revenue (Million) Forecast, by Application 2019 & 2032
- Table 108: Japan Patient Portal Market Volume (K Unit) Forecast, by Application 2019 & 2032
- Table 109: India Patient Portal Market Revenue (Million) Forecast, by Application 2019 & 2032
- Table 110: India Patient Portal Market Volume (K Unit) Forecast, by Application 2019 & 2032
- Table 111: Australia Patient Portal Market Revenue (Million) Forecast, by Application 2019 & 2032
- Table 112: Australia Patient Portal Market Volume (K Unit) Forecast, by Application 2019 & 2032
- Table 113: South Korea Patient Portal Market Revenue (Million) Forecast, by Application 2019 & 2032
- Table 114: South Korea Patient Portal Market Volume (K Unit) Forecast, by Application 2019 & 2032
- Table 115: Rest of Asia Pacific Patient Portal Market Revenue (Million) Forecast, by Application 2019 & 2032
- Table 116: Rest of Asia Pacific Patient Portal Market Volume (K Unit) Forecast, by Application 2019 & 2032
- Table 117: Global Patient Portal Market Revenue Million Forecast, by Portal 2019 & 2032
- Table 118: Global Patient Portal Market Volume K Unit Forecast, by Portal 2019 & 2032
- Table 119: Global Patient Portal Market Revenue Million Forecast, by Deployment Mode 2019 & 2032
- Table 120: Global Patient Portal Market Volume K Unit Forecast, by Deployment Mode 2019 & 2032
- Table 121: Global Patient Portal Market Revenue Million Forecast, by End-User 2019 & 2032
- Table 122: Global Patient Portal Market Volume K Unit Forecast, by End-User 2019 & 2032
- Table 123: Global Patient Portal Market Revenue Million Forecast, by Country 2019 & 2032
- Table 124: Global Patient Portal Market Volume K Unit Forecast, by Country 2019 & 2032
- Table 125: GCC Patient Portal Market Revenue (Million) Forecast, by Application 2019 & 2032
- Table 126: GCC Patient Portal Market Volume (K Unit) Forecast, by Application 2019 & 2032
- Table 127: South Africa Patient Portal Market Revenue (Million) Forecast, by Application 2019 & 2032
- Table 128: South Africa Patient Portal Market Volume (K Unit) Forecast, by Application 2019 & 2032
- Table 129: Rest of Middle East and Africa Patient Portal Market Revenue (Million) Forecast, by Application 2019 & 2032
- Table 130: Rest of Middle East and Africa Patient Portal Market Volume (K Unit) Forecast, by Application 2019 & 2032
- Table 131: Global Patient Portal Market Revenue Million Forecast, by Portal 2019 & 2032
- Table 132: Global Patient Portal Market Volume K Unit Forecast, by Portal 2019 & 2032
- Table 133: Global Patient Portal Market Revenue Million Forecast, by Deployment Mode 2019 & 2032
- Table 134: Global Patient Portal Market Volume K Unit Forecast, by Deployment Mode 2019 & 2032
- Table 135: Global Patient Portal Market Revenue Million Forecast, by End-User 2019 & 2032
- Table 136: Global Patient Portal Market Volume K Unit Forecast, by End-User 2019 & 2032
- Table 137: Global Patient Portal Market Revenue Million Forecast, by Country 2019 & 2032
- Table 138: Global Patient Portal Market Volume K Unit Forecast, by Country 2019 & 2032
- Table 139: Brazil Patient Portal Market Revenue (Million) Forecast, by Application 2019 & 2032
- Table 140: Brazil Patient Portal Market Volume (K Unit) Forecast, by Application 2019 & 2032
- Table 141: Argentina Patient Portal Market Revenue (Million) Forecast, by Application 2019 & 2032
- Table 142: Argentina Patient Portal Market Volume (K Unit) Forecast, by Application 2019 & 2032
- Table 143: Rest of South America Patient Portal Market Revenue (Million) Forecast, by Application 2019 & 2032
- Table 144: Rest of South America Patient Portal Market Volume (K Unit) Forecast, by Application 2019 & 2032
Frequently Asked Questions
1. What is the projected Compound Annual Growth Rate (CAGR) of the Patient Portal Market?
The projected CAGR is approximately 18.80%.
2. Which companies are prominent players in the Patient Portal Market?
Key companies in the market include Mckesson Corporation, Intelichart, NXGN Management LLC (Nextgen Healthcare Information Systems LLC), Eclinicalworks LLC, GE Healthcare, Curemd Healthcare, Epic Corporation Inc, Greenway Health LLC, Oracle (Cerner Corporation), Allscripts Healthcare Solutions Inc, Athenahealth Inc.
3. What are the main segments of the Patient Portal Market?
The market segments include Portal, Deployment Mode, End-User.
4. Can you provide details about the market size?
The market size is estimated to be USD 5.52 Million as of 2022.
5. What are some drivers contributing to market growth?
Increased Adoption of Patient-centric Approach by Healthcare Payers; Increase in the Demand for Electronic Health Records (EHRs); Favorable Government Funding Policies and Initiatives for Implementing Healthcare IT Solutions.
6. What are the notable trends driving market growth?
Integrated Patient Portal Holds the Largest Share in the Portal Segment expected to hold a major market share in the Patient Portalmarket.
7. Are there any restraints impacting market growth?
Data Privacy and Security Concerns; High Cost of Implementation and Deployment.
8. Can you provide examples of recent developments in the market?
November 2022- Valant launched MYIO, the first all-in-one behavioral health-specific patient engagement mobile app. By eliminating the need for manual patient data entry into numerous systems, MYIO assists behavioral healthcare practices in increasing operational effectiveness.
9. What pricing options are available for accessing the report?
Pricing options include single-user, multi-user, and enterprise licenses priced at USD 4750, USD 5250, and USD 8750 respectively.
10. Is the market size provided in terms of value or volume?
The market size is provided in terms of value, measured in Million and volume, measured in K Unit.
11. Are there any specific market keywords associated with the report?
Yes, the market keyword associated with the report is "Patient Portal Market," which aids in identifying and referencing the specific market segment covered.
12. How do I determine which pricing option suits my needs best?
The pricing options vary based on user requirements and access needs. Individual users may opt for single-user licenses, while businesses requiring broader access may choose multi-user or enterprise licenses for cost-effective access to the report.
13. Are there any additional resources or data provided in the Patient Portal Market report?
While the report offers comprehensive insights, it's advisable to review the specific contents or supplementary materials provided to ascertain if additional resources or data are available.
14. How can I stay updated on further developments or reports in the Patient Portal Market?
To stay informed about further developments, trends, and reports in the Patient Portal Market, consider subscribing to industry newsletters, following relevant companies and organizations, or regularly checking reputable industry news sources and publications.
Methodology
Step 1 - Identification of Relevant Samples Size from Population Database


Step 2 - Approaches for Defining Global Market Size (Value, Volume* & Price*)

Note*: In applicable scenarios
Step 3 - Data Sources
Primary Research
- Web Analytics
- Survey Reports
- Research Institute
- Latest Research Reports
- Opinion Leaders
Secondary Research
- Annual Reports
- White Paper
- Latest Press Release
- Industry Association
- Paid Database
- Investor Presentations

Step 4 - Data Triangulation
Involves using different sources of information in order to increase the validity of a study
These sources are likely to be stakeholders in a program - participants, other researchers, program staff, other community members, and so on.
Then we put all data in single framework & apply various statistical tools to find out the dynamic on the market.
During the analysis stage, feedback from the stakeholder groups would be compared to determine areas of agreement as well as areas of divergence
