

Key Insights
The North America amusement park market is poised for significant expansion, with a projected market size of $33.3 billion by 2033, driven by a compelling Compound Annual Growth Rate (CAGR) of 29.8% from the base year of 2025. This robust growth is underpinned by several key factors. Increasing disposable incomes and expanded leisure time among North American consumers are fueling demand for entertainment and family activities. Concurrently, continuous advancements in ride technology, including immersive and virtual reality experiences, are attracting a broader visitor base and encouraging repeat visits. Market segmentation highlights substantial opportunities within the 'Up to 18 years' demographic, emphasizing the importance of family-friendly attractions and targeted marketing. Diversified revenue streams, beyond ticket sales, include significant contributions from food and beverage, merchandise, and hospitality packages, indicating avenues for revenue optimization through strategic partnerships and upselling. While the United States remains the dominant market, Canada and Mexico offer considerable growth potential, supported by their expanding tourism sectors and evolving entertainment offerings. Potential challenges include economic volatility impacting discretionary spending and the continuous need for investment in infrastructure and safety to ensure high visitor satisfaction.
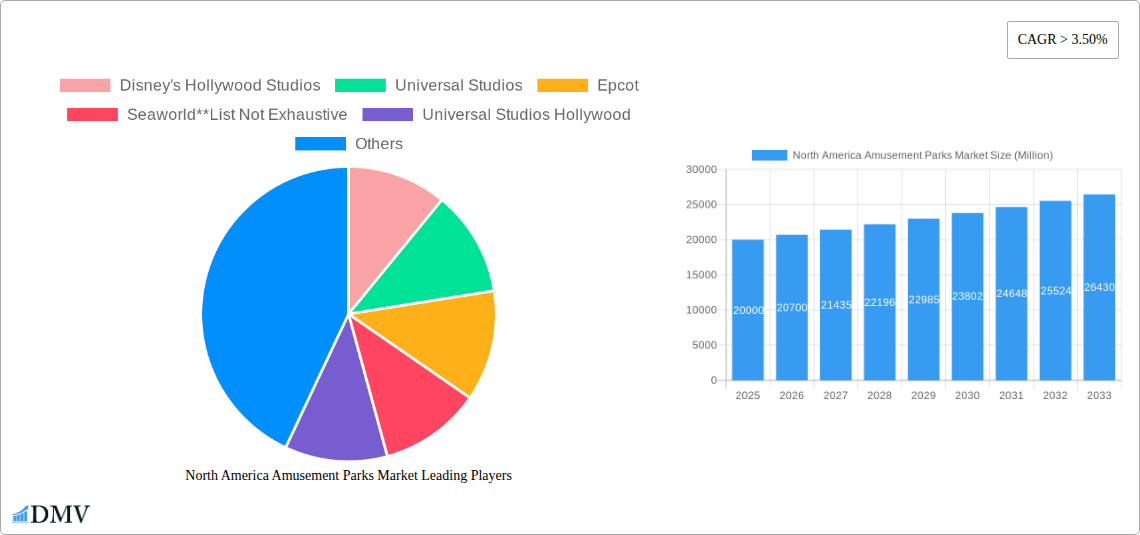
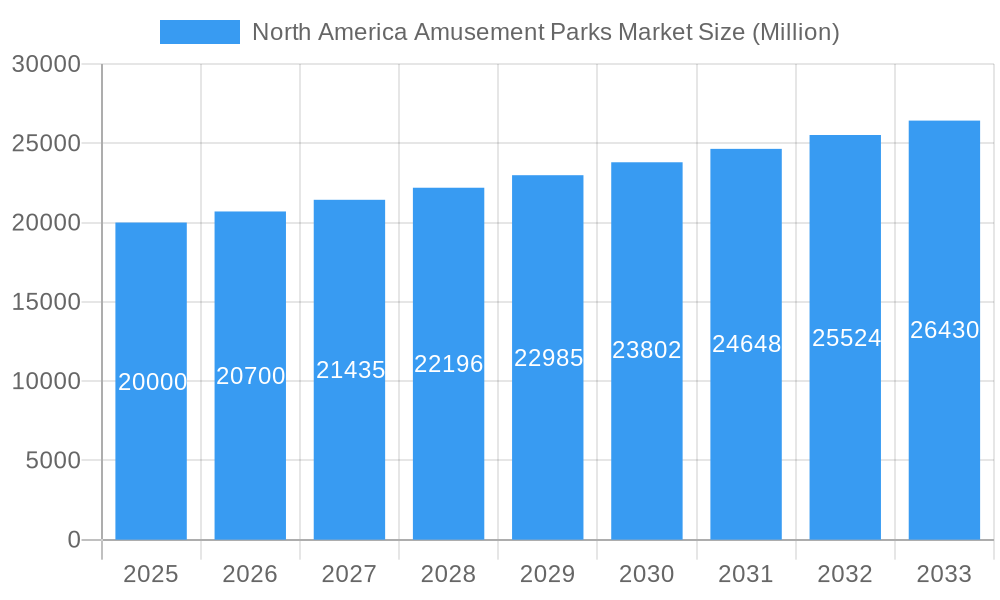
North America Amusement Parks Market Market Size (In Billion)
The competitive environment is characterized by major players such as Disney, Universal Studios, and SeaWorld, each implementing distinct strategies to engage specific market segments. Disney leverages its powerful brand recognition and broad appeal across age groups. Universal Studios attracts a younger, thrill-seeking demographic with its cinematic themes and exhilarating rides. SeaWorld differentiates itself through unique marine life attractions. The market is dynamic, with regional parks actively innovating to enhance their offerings and compete effectively. The integration of technology and immersive experiences is crucial for creating memorable guest journeys and supporting premium pricing. Furthermore, a growing emphasis on sustainability is enhancing the appeal of amusement parks to environmentally conscious consumers. A thorough analysis of these dynamics offers critical insights for strategic market positioning.
North America Amusement Parks Market Company Market Share
North America Amusement Parks Market: 2019-2033 Forecast Report
This comprehensive report provides an in-depth analysis of the North America amusement parks market, encompassing historical data (2019-2024), the base year (2025), and a detailed forecast for 2025-2033. Valued at xx Million in 2025, the market is poised for significant growth, driven by technological advancements, evolving consumer preferences, and strategic investments. This report is essential for stakeholders seeking to understand market dynamics, identify key players, and capitalize on emerging opportunities within this dynamic sector.
North America Amusement Parks Market Composition & Trends
The North America amusement parks market exhibits a moderately concentrated landscape, with major players like Disney (Magic Kingdom, Epcot, Disney's Hollywood Studios, Disneyland, Disney's Animal Kingdom, Disney's California Adventure), Universal Studios (Universal Studios Hollywood, Islands of Adventure, Universal Studios Florida), and SeaWorld holding significant market share. However, the market also accommodates numerous smaller regional parks, contributing to a diverse competitive environment. Innovation is a key driver, with parks constantly introducing new rides, immersive experiences, and technological advancements to enhance visitor engagement. The regulatory landscape, varying across different states and provinces, plays a significant role, impacting safety standards, operational permits, and environmental regulations. Substitute products, such as other forms of entertainment and leisure activities, exert competitive pressure. The primary end-user profile encompasses families, young adults, and tourists, with varying preferences based on age group and interests. M&A activity has been relatively active in recent years, exemplified by the acquisitions of smaller regional parks by larger players. This consolidation trend is predicted to continue, driving further market concentration. Market share distribution among the top players is estimated at approximately xx% for Disney, xx% for Universal Studios, xx% for SeaWorld, and the remaining xx% shared amongst other players in 2025. Recent M&A deal values have ranged from xx Million to xx Million, depending on the size and location of the acquired park.
- Market Concentration: Moderately concentrated, with significant players and numerous smaller parks.
- Innovation: Continuous introduction of new rides, technologies, and immersive experiences.
- Regulatory Landscape: Varies across regions, impacting safety, operations, and environment.
- Substitute Products: Competing entertainment options including cinemas, sporting events, and other leisure activities.
- End-User Profile: Families, young adults, and tourists, with diverse preferences across age groups.
- M&A Activity: Ongoing consolidation, with larger players acquiring smaller regional parks.
North America Amusement Parks Market Industry Evolution
The North America amusement parks market has experienced fluctuating growth over the historical period (2019-2024), influenced by economic cycles and global events. The COVID-19 pandemic significantly impacted attendance and revenue, causing temporary closures and reduced visitor numbers. However, a strong rebound is expected, with a projected Compound Annual Growth Rate (CAGR) of xx% from 2025 to 2033. Technological advancements, such as virtual reality (VR) integration, augmented reality (AR) experiences, and improved ride technology, are driving innovation and enhancing visitor experiences. Consumer demands are shifting towards more personalized and immersive experiences, prompting parks to invest in interactive technologies and themed attractions. The rising disposable incomes in certain demographics, along with an increasing focus on leisure and entertainment, fuels market expansion. The adoption rate of new technologies is increasing, with a projected xx% of parks implementing VR/AR experiences by 2033. Growth in specific segments, such as themed experiences and interactive attractions, outpaces the overall market growth rate, highlighting consumer preferences for unique and engaging activities.
Leading Regions, Countries, or Segments in North America Amusement Parks Market
The United States is the dominant market in North America, accounting for xx% of total revenue in 2025, followed by Canada (xx%) and Mexico (xx%). The "Up to 18 years" age group represents the largest segment by age, driving a substantial portion of ticket sales. In terms of revenue streams, tickets contribute the largest share (xx%), followed by food and beverages (xx%), merchandise (xx%), and hotels/resorts (xx%). Mechanical rides remain the most prevalent type of ride, capturing the majority of the market share, although water rides and "other rides" (including dark rides and simulator rides) also hold substantial segments.
- Key Drivers for the United States Dominance: High tourism numbers, substantial investment in large-scale theme parks, and a large population base.
- Key Drivers for the "Up to 18 years" age segment: Families with young children are a primary visitor demographic, resulting in higher attendance rates and spending.
- Key Drivers for Ticket Revenue Dominance: Ticket sales form the core revenue model for amusement parks.
North America Amusement Parks Market Product Innovations
Recent innovations focus on enhanced guest experiences through technology integration. VR and AR technologies are incorporated into rides and attractions, providing immersive and interactive experiences. Mobile apps facilitate ticketing, navigation, and in-park transactions, streamlining the visitor journey. Data analytics are used to personalize offerings and improve operational efficiency. Unique selling propositions include themed lands, character interactions, and innovative ride designs. These technological advancements enhance guest satisfaction, drive repeat visits, and create a more engaging and memorable experience.
Propelling Factors for North America Amusement Parks Market Growth
Technological advancements, such as VR/AR integration and mobile app functionalities, are enhancing guest experiences and attracting wider audiences. The increasing disposable incomes within key demographics lead to higher spending on leisure activities. Favorable government regulations supporting tourism and entertainment development stimulate market growth. For example, tax incentives for park development and tourism infrastructure projects boost investments in the sector.
Obstacles in the North America Amusement Parks Market
Regulatory hurdles and varying safety standards across different regions present operational challenges. Supply chain disruptions can impact the availability of essential components and materials, affecting construction and operations. Intense competition among established players and new entrants creates pressure on pricing and profitability, impacting margins. For instance, an estimated xx% increase in material costs in 2024 led to a xx% reduction in profit margins for some parks.
Future Opportunities in North America Amusement Parks Market
Expansion into new markets within North America offers growth potential. The development of sustainable and eco-friendly parks addresses growing environmental concerns. Integration of advanced technologies, including AI and IoT, enhances operational efficiency and guest personalization. Targeting niche market segments with tailored offerings, such as themed events and seasonal attractions, can attract new customer bases.
Major Players in the North America Amusement Parks Market Ecosystem
- Disney
- Universal Studios
- SeaWorld
- Six Flags
- Cedar Fair
Key Developments in North America Amusement Parks Market Industry
- July 2022: Five Star Parks & Attractions acquired three Malibu Jack's Indoor Theme Parks. This acquisition expanded their footprint and market share in the Kentucky region.
- January 2023: Delaware North expanded its presence in the parks and lodging sector through the acquisition of the Best Western Premier Grand Canyon Squire Inn, signifying growth in the hospitality aspect of the amusement park industry.
Strategic North America Amusement Parks Market Forecast
The North America amusement parks market is expected to experience robust growth over the forecast period (2025-2033), driven by continuous innovation, increasing tourist numbers, and rising disposable incomes. New technological advancements and the adoption of sustainable practices will further fuel expansion. The market's strong fundamentals, coupled with strategic investments and M&A activities, create a positive outlook for continued growth and profitability.
North America Amusement Parks Market Segmentation
-
1. Rides
- 1.1. Mechanical Rides
- 1.2. Water Rides
- 1.3. Other Rides
-
2. Age
- 2.1. Upto 18 years
- 2.2. 19 to 35 years
- 2.3. 36 to 50 years
- 2.4. 51 to 65 years
- 2.5. More than 65 years
-
3. Revenue
- 3.1. Tickets
- 3.2. Food & Beverages
- 3.3. Merchandise
- 3.4. Hotels/Resorts
- 3.5. Other Revenues
North America Amusement Parks Market Segmentation By Geography
-
1. North America
- 1.1. United States
- 1.2. Canada
- 1.3. Mexico
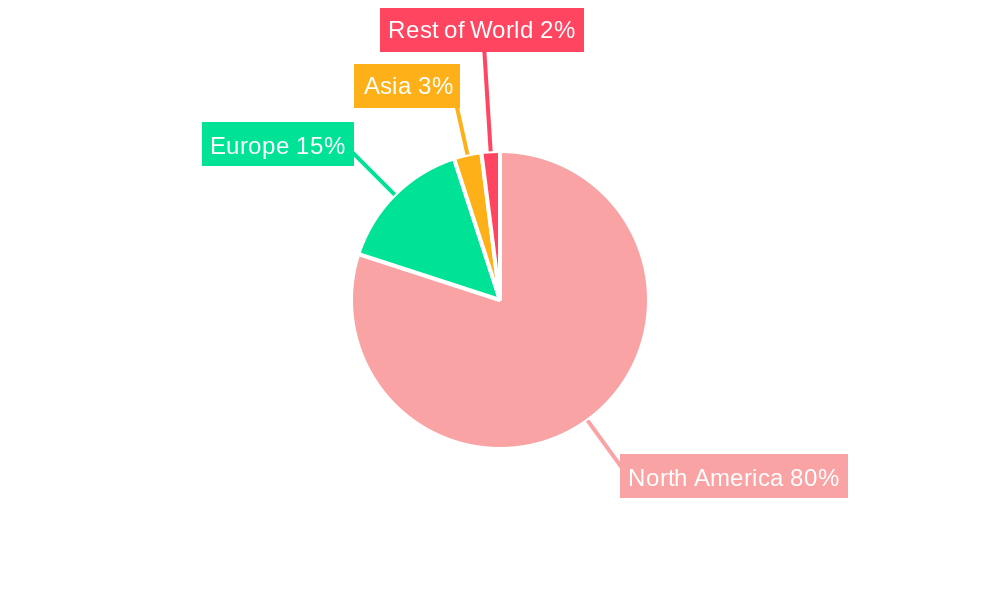
North America Amusement Parks Market Regional Market Share
Geographic Coverage of North America Amusement Parks Market
North America Amusement Parks Market REPORT HIGHLIGHTS
| Aspects | Details |
|---|---|
| Study Period | 2020-2034 |
| Base Year | 2025 |
| Estimated Year | 2026 |
| Forecast Period | 2026-2034 |
| Historical Period | 2020-2025 |
| Growth Rate | CAGR of 29.8% from 2020-2034 |
| Segmentation |
|
Table of Contents
- 1. Introduction
- 1.1. Research Scope
- 1.2. Market Segmentation
- 1.3. Research Objective
- 1.4. Definitions and Assumptions
- 2. Executive Summary
- 2.1. Market Snapshot
- 3. Market Dynamics
- 3.1. Market Drivers
- 3.2. Market Restrains
- 3.3. Market Trends
- 3.4. Market Opportunities
- 4. Market Factor Analysis
- 4.1. Porters Five Forces
- 4.1.1. Bargaining Power of Suppliers
- 4.1.2. Bargaining Power of Buyers
- 4.1.3. Threat of New Entrants
- 4.1.4. Threat of Substitutes
- 4.1.5. Competitive Rivalry
- 4.2. PESTEL analysis
- 4.3. BCG Analysis
- 4.3.1. Stars (High Growth, High Market Share)
- 4.3.2. Cash Cows (Low Growth, High Market Share)
- 4.3.3. Question Mark (High Growth, Low Market Share)
- 4.3.4. Dogs (Low Growth, Low Market Share)
- 4.4. Ansoff Matrix Analysis
- 4.5. Supply Chain Analysis
- 4.6. Regulatory Landscape
- 4.7. Current Market Potential and Opportunity Assessment (TAM–SAM–SOM Framework)
- 4.8. DMV Analyst Note
- 4.1. Porters Five Forces
- 5. Market Analysis, Insights and Forecast 2021-2033
- 5.1. Market Analysis, Insights and Forecast - by Rides
- 5.1.1. Mechanical Rides
- 5.1.2. Water Rides
- 5.1.3. Other Rides
- 5.2. Market Analysis, Insights and Forecast - by Age
- 5.2.1. Upto 18 years
- 5.2.2. 19 to 35 years
- 5.2.3. 36 to 50 years
- 5.2.4. 51 to 65 years
- 5.2.5. More than 65 years
- 5.3. Market Analysis, Insights and Forecast - by Revenue
- 5.3.1. Tickets
- 5.3.2. Food & Beverages
- 5.3.3. Merchandise
- 5.3.4. Hotels/Resorts
- 5.3.5. Other Revenues
- 5.4. Market Analysis, Insights and Forecast - by Region
- 5.4.1. North America
- 5.1. Market Analysis, Insights and Forecast - by Rides
- 6. North America Amusement Parks Market Analysis, Insights and Forecast, 2021-2033
- 6.1. Market Analysis, Insights and Forecast - by Rides
- 6.1.1. Mechanical Rides
- 6.1.2. Water Rides
- 6.1.3. Other Rides
- 6.2. Market Analysis, Insights and Forecast - by Age
- 6.2.1. Upto 18 years
- 6.2.2. 19 to 35 years
- 6.2.3. 36 to 50 years
- 6.2.4. 51 to 65 years
- 6.2.5. More than 65 years
- 6.3. Market Analysis, Insights and Forecast - by Revenue
- 6.3.1. Tickets
- 6.3.2. Food & Beverages
- 6.3.3. Merchandise
- 6.3.4. Hotels/Resorts
- 6.3.5. Other Revenues
- 6.1. Market Analysis, Insights and Forecast - by Rides
- 7. Competitive Analysis
- 7.1. Company Profiles
- 7.1.1 Disney's Hollywood Studios
- 7.1.1.1. Company Overview
- 7.1.1.2. Products
- 7.1.1.3. Company Financials
- 7.1.1.4. SWOT Analysis
- 7.1.2 Universal Studios
- 7.1.2.1. Company Overview
- 7.1.2.2. Products
- 7.1.2.3. Company Financials
- 7.1.2.4. SWOT Analysis
- 7.1.3 Epcot
- 7.1.3.1. Company Overview
- 7.1.3.2. Products
- 7.1.3.3. Company Financials
- 7.1.3.4. SWOT Analysis
- 7.1.4 Seaworld**List Not Exhaustive
- 7.1.4.1. Company Overview
- 7.1.4.2. Products
- 7.1.4.3. Company Financials
- 7.1.4.4. SWOT Analysis
- 7.1.5 Universal Studios Hollywood
- 7.1.5.1. Company Overview
- 7.1.5.2. Products
- 7.1.5.3. Company Financials
- 7.1.5.4. SWOT Analysis
- 7.1.6 Magic Kingdom
- 7.1.6.1. Company Overview
- 7.1.6.2. Products
- 7.1.6.3. Company Financials
- 7.1.6.4. SWOT Analysis
- 7.1.7 Disney's Animal Kingdom
- 7.1.7.1. Company Overview
- 7.1.7.2. Products
- 7.1.7.3. Company Financials
- 7.1.7.4. SWOT Analysis
- 7.1.8 Disney's California Adventure
- 7.1.8.1. Company Overview
- 7.1.8.2. Products
- 7.1.8.3. Company Financials
- 7.1.8.4. SWOT Analysis
- 7.1.9 Islands of Adventure
- 7.1.9.1. Company Overview
- 7.1.9.2. Products
- 7.1.9.3. Company Financials
- 7.1.9.4. SWOT Analysis
- 7.1.10 Disneyland
- 7.1.10.1. Company Overview
- 7.1.10.2. Products
- 7.1.10.3. Company Financials
- 7.1.10.4. SWOT Analysis
- 7.1.1 Disney's Hollywood Studios
- 7.2. Market Entropy
- 7.2.1 Company's Key Areas Served
- 7.2.2 Recent Developments
- 7.3. Company Market Share Analysis 2025
- 7.3.1 Top 5 Companies Market Share Analysis
- 7.3.2 Top 3 Companies Market Share Analysis
- 7.4. List of Potential Customers
- 8. Research Methodology
List of Figures
- Figure 1: North America Amusement Parks Market Revenue Breakdown (billion, %) by Product 2025 & 2033
- Figure 2: North America Amusement Parks Market Share (%) by Company 2025
List of Tables
- Table 1: North America Amusement Parks Market Revenue billion Forecast, by Rides 2020 & 2033
- Table 2: North America Amusement Parks Market Revenue billion Forecast, by Age 2020 & 2033
- Table 3: North America Amusement Parks Market Revenue billion Forecast, by Revenue 2020 & 2033
- Table 4: North America Amusement Parks Market Revenue billion Forecast, by Region 2020 & 2033
- Table 5: North America Amusement Parks Market Revenue billion Forecast, by Rides 2020 & 2033
- Table 6: North America Amusement Parks Market Revenue billion Forecast, by Age 2020 & 2033
- Table 7: North America Amusement Parks Market Revenue billion Forecast, by Revenue 2020 & 2033
- Table 8: North America Amusement Parks Market Revenue billion Forecast, by Country 2020 & 2033
- Table 9: United States North America Amusement Parks Market Revenue (billion) Forecast, by Application 2020 & 2033
- Table 10: Canada North America Amusement Parks Market Revenue (billion) Forecast, by Application 2020 & 2033
- Table 11: Mexico North America Amusement Parks Market Revenue (billion) Forecast, by Application 2020 & 2033
Frequently Asked Questions
1. What is the projected Compound Annual Growth Rate (CAGR) of the North America Amusement Parks Market?
The projected CAGR is approximately 29.8%.
2. Which companies are prominent players in the North America Amusement Parks Market?
Key companies in the market include Disney's Hollywood Studios, Universal Studios, Epcot, Seaworld**List Not Exhaustive, Universal Studios Hollywood, Magic Kingdom, Disney's Animal Kingdom, Disney's California Adventure, Islands of Adventure, Disneyland.
3. What are the main segments of the North America Amusement Parks Market?
The market segments include Rides, Age, Revenue.
4. Can you provide details about the market size?
The market size is estimated to be USD 33.3 billion as of 2022.
5. What are some drivers contributing to market growth?
Rise in the Number of Visitors to Museums is Driving the Market; Digitalization is Driving the Market.
6. What are the notable trends driving market growth?
Mechanical Rides Powering North America's Amusement Park Industry.
7. Are there any restraints impacting market growth?
Maintenance and Preservation Costs; Changing Visitor Preferences.
8. Can you provide examples of recent developments in the market?
January 2023: Global hospitality and entertainment company Delaware North announced its continued expansion in the parks and lodging sector through the acquisition of the Best Western Premier Grand Canyon Squire Inn.
9. What pricing options are available for accessing the report?
Pricing options include single-user, multi-user, and enterprise licenses priced at USD 4750, USD 4950, and USD 6800 respectively.
10. Is the market size provided in terms of value or volume?
The market size is provided in terms of value, measured in billion.
11. Are there any specific market keywords associated with the report?
Yes, the market keyword associated with the report is "North America Amusement Parks Market," which aids in identifying and referencing the specific market segment covered.
12. How do I determine which pricing option suits my needs best?
The pricing options vary based on user requirements and access needs. Individual users may opt for single-user licenses, while businesses requiring broader access may choose multi-user or enterprise licenses for cost-effective access to the report.
13. Are there any additional resources or data provided in the North America Amusement Parks Market report?
While the report offers comprehensive insights, it's advisable to review the specific contents or supplementary materials provided to ascertain if additional resources or data are available.
14. How can I stay updated on further developments or reports in the North America Amusement Parks Market?
To stay informed about further developments, trends, and reports in the North America Amusement Parks Market, consider subscribing to industry newsletters, following relevant companies and organizations, or regularly checking reputable industry news sources and publications.
Methodology
Step 1 - Identification of Relevant Samples Size from Population Database


Step 2 - Approaches for Defining Global Market Size (Value, Volume* & Price*)

Note*: In applicable scenarios
Step 3 - Data Sources
Primary Research
- Web Analytics
- Survey Reports
- Research Institute
- Latest Research Reports
- Opinion Leaders
Secondary Research
- Annual Reports
- White Paper
- Latest Press Release
- Industry Association
- Paid Database
- Investor Presentations

Step 4 - Data Triangulation
Involves using different sources of information in order to increase the validity of a study
These sources are likely to be stakeholders in a program - participants, other researchers, program staff, other community members, and so on.
Then we put all data in single framework & apply various statistical tools to find out the dynamic on the market.
During the analysis stage, feedback from the stakeholder groups would be compared to determine areas of agreement as well as areas of divergence